Yen Hits New 11-Month Low against Euro

Source: ForexYard

The JPY started off the week by falling to a fresh 11-month low against the euro, as positive global data has led to increased risk taking among investors. After hitting 123.30 during the overnight session, the EUR/JPY has since dropped to its current level of 122.50. With little in the way of significant news from either the euro-zone or Japan scheduled for today, traders can expect the current trend to continue.

Economic News

USD – USD Sinks against Majors

The US dollar dropped against most of its major currency rivals during last week’s trading session. The greenback fell about 300 pips vs. the euro and the EUR/USD pair reached as high as the 1.4450 level, marking a 16-month high. The dollar fell about 250 pips against the British pound as well.
The dollar’s decline in 2011 was driven by interest rate hikes or the expectations of them from European central banks. A sharply divided Washington – which can’t seem to agree on budget deficit issues and come up with a credible medium-term plan for fiscal consolidation – also contributed to the decline.
Currency strategists generally agree the weak dollar is a theme that will drive foreign exchange markets for some time, especially as long as the US Federal Reserve keeps the prospect of interest rate hikes at arm’s length. But the extent to which the dollar will weaken further is an area of debate in the foreign exchange markets.

Looking ahead to this week, many significant economic releases are expected from the U.S. economy. The most noteworthy reports look to be the Retail Sales, the weekly Unemployment Claims, the CPI and the TIC Long-Term Purchases. Traders are advised to follow these reports as they are likely to have a large impact on the dollar.

EUR – Euro Trades Steady Ahead of Slow News Day

The euro started off the week virtually unchanged against most of its main currency rivals, including the USD and British pound. It appears that the 17-nation single currency may have hit strong resistance following last week’s bullish run, spurned by the euro-zone interest rate hike. The EUR/USD is currently trading at 1.4463, down slightly from last Friday’s high of 1.4486. The EUR/GBP, currently at 0.8836, is down marginally versus its rate at market closing last week.

The euro was able to make fairly strong gains against the Japanese yen during the overnight session, and the EUR/JPY pair hit a fresh 11-month high before staging a slight correction. The pair is currently trading steadily at 1.2250, down almost 80 pips since it peaked last night.

Turning to today, a slow news day will likely mean that the euro will maintain its current trends. That being said, traders will want to pay attention to any developments out of Japan regarding the ongoing efforts to rebuild the stricken nation. If any further complications arise regarding the nuclear crisis there, the yen is likely to fall further against the euro.

JPY – Yen Falls To a 11-Month Low against the Euro

The yen fell to an 11-month low against the euro and a 2- year trough versus the Australian dollar in overnight trading on Monday, and stayed on a weakening trend as investors piled into carry trades in favor of higher-yielding assets.

The yen has fallen sharply in the wake of joint yen-selling intervention by the Group of Seven industrialized nations in March. The G7 stepped in after the yen hit a record high of 76.25 yen to the dollar on March 17, propelled by speculation that Japanese investors would repatriate their overseas assets after a massive earthquake and tsunami struck Japan’s northeast on March 11.

As for this week, traders are advised to follow the Japanese equity market, as the yen is highly affected by its movements. Special attention should also be given to the Monetary Policy Meeting Minutes scheduled for today, as its release is likely to have a significant impact on yen trading.

Crude Oil – Crude Oil Hits a Fresh 2 1/2 Year High amid Mid-East Unrest

The price of oil soared last week, hitting a fresh two-and-a-half year high at $113 a barrel, as investor concerns regarding supplies out of the Middle East continued to affect the market.

Widening unrest in the Middle East and a weakening dollar lent new impetus to a rally in oil markets with Brent crude briefly hitting the $113.18 mark before pulling back slightly on prospects of a peace deal in Libya.

As for today, traders are advised to follow all the developments from Libya, as this conflict is now the main catalyst in crude trading. In the case of any further escalation in the fighting there, oil prices might climb even further.

Technical News

EUR/USD

The pair has recorded much bullish behavior in the past several days. However, the technical data indicates that this trend may reverse anytime soon. For example, the daily chart’s Stochastic Slow signals that a bearish reversal is imminent. . Going short with tight stops might be a wise choice.

GBP/USD

The price of this pair appears to be floating in the over-bought territory on the 8-hour chart’s RSI indicating a downward correction may be imminent. The downward direction on the daily chart’s Momentum oscillator also supports this notion. When the downwards breach occurs, going short with tight stops appears to be preferable strategy.

USD/JPY

The 4-hour chart is showing mixed signals with its RSI fluctuating at the neutral territory. However, the daily Chart’s RSI is already floating in the over-bought territory indicating that a bearish correction might take place in the nearest future. Going short with tight stops might be the right strategy today.

USD/CHF

The cross has been dropping for the past week now, as it now stands at the 0.9080 level. The Slow Stochastic of the daily chart shows a bullish cross has recently formed, indicating that an upward correction is imminent. This view is also supported by the RSI of the 8-hour chart. Going long with tight stops may turn out to be the right choice today.

The Wild Card

Crude Oil

Oil prices rose significantly in the last week and peaked at $113.18 per barrel. However, daily charts’ RSI is floating in an overbought territory suggesting that a recent upwards trend is loosing steam and a bearish correction is impending. This might be a good opportunity for forex traders to enter the trend at a very early stage.

Forex Market Analysis provided by ForexYard.

© 2006 by FxYard Ltd

Disclaimer: Trading Foreign Exchange carries a high level of risk and may not be suitable for all investors. There is a possibility that you could sustain a loss of all of your investment and therefore you should not invest money that you cannot afford to lose. You should be aware of all the risks associated with Foreign Exchange trading.

Holcim Philippines, Inc. Breaks Its Silence

holcim philippines inc., HLCM, holcim group, cement, concrete, construction, ron acoba, symmetrical triangle, daily stock picks, stock market trading

Holcim Philippines, Inc. or HLCM in the Philippine Stock Exchange is in the business of producing cement and concrete. Last Friday, the company’s shares popped out of the radar when it unexpectedly rose by 10.62%. 

HLCM was one of the best performing stocks in 2010. It opened the year 2010 at only PHP 4.75 and reached a high of PHP 16.26 in December. After peaking at the said high, HLCM gradually fell until it marked a low of PHP 10.04 this February 28, 2011. It then consolidated within a symmetrical triangle before it broke out from the triangle and its 4-month downtrend line last Friday.

Friday’s breakout appears to be valid given the volume behind it. Notice also that both MACD and RSI are indicating that it could be starting to gain an upward momentum. Should buying interest remains, HLCM could aim for its initial target at PHP 14.00. A move past that could then send it back to around PHP 16.00.

More on LaidTrades.com

Daily Market Review for the 11.04.2011

AUD/JPY

Time: 08:00 Rate: 89.50

Strategy: Short

Daily time frame

This pair which was mentioned in the previous market reviews performed continuous increase of about 21%, the continuous movement of this size is from the longest that were seen in this pair, in the area of 90.60-89.90 there is the Fibonacci level of 161.8 % of the last downward movement which can be used as a resistance point to provide the creation the first downward retracement.

As can be seen by the graph bellow:


4 hour time frame

The price creates clear bearish deviations in the indicator CCI 20 (green) and closes the Bullinger Band, the aspect indicating the downward volatility and gathering before choosing a new way. A good point for entering short is after the stop of the upward price pattern (pattern M or the creation of high lower low and the downward break down)   

As can be seen by the graph bellow:


Potential Trade

Short after the break down of the high patterns and the double top pattern.

Stop: beyond the pattern or beyond the red area 90.70.

First target: 86.50 (retracement 23.6 Fibonacci of the upward movement, daily time frame)

Optional second target: 84.20 (retracement 38.2 Fibonacci).

USD/CHF

Time: 08:30 Rate: 0.9085

Strategy: Long

4 hour time frame

Before the end of the week the pair was examined for the creation of the movement to the two directions, activated the short trigger (0.9130) of the 4 hour time frame and arrived with success to the target of 0.9060.

As can be seen by the graph bellow:


Daily time frame

Although the downtrends before the end of the week, the pair still satisfies the conditions for short bull wolf pattern but should be waited for a clear price stop and the break out of the level 0.9340.

One should pay attention to two important points in the price stop- one in the psychological area of the level 0.9000 and the second lower in the area of 0.8800 which is the most important Fibonacci area. These areas could be used as good support for the short time frame trading.

As can be seen by the graph bellow:              


Potential Trade

Long in the break out of 0.9340

First target: 0.9590

Second target: 1.0000


RISK DISCLAIMER

Forex trading involves high risk. Before any trade, you should consider carefully the investment objectives and the level of risk. The data sent by mail is not necessarily real-time data or precise. Real-Forex is not liable for the losses resulting from the utilization of the data. Real-Forex (Finnocorp Trading Solution Ltd

.) is not liable for losses or damages as a result of reliance on the information provided by e-mail or on the overall data, quotes, charts, signals buy / sell. It is hereby clarified that the investor must be aware of risks involved in trading in financial markets, which is a form of investment that may contain potential risks.

Real-Forex team

Trade like the pro’s with a true ECN Forex broker


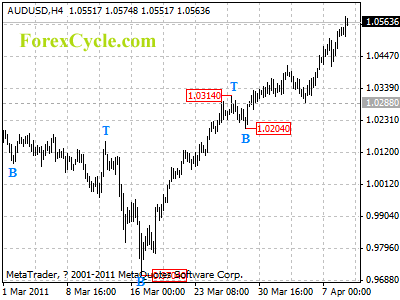
AUDUSD rose strongly to 1.0581

AUDUSD rose strongly to as high as 1.0581. Support is now at 1.0500, as long as this level holds, uptrend could b expected to continue, and next target would be at 1.0700 zone. However, below 1.0500 will indicate that a cycle top has been formed on 4-hour chart, then consolidation of uptrend could be seen.

audusd

Daily Forex Analysis

FOREX: Large Currency Speculators trim Dollar shorts. Aussie longs higher, Yen drops

By CountingPips.com

The most recent Commitments of Traders (COT) report, released on Friday by the Commodity Futures Trading Commission (CFTC), showed that large futures speculators cut back their short positions of the US dollar against the other major currencies while increasing bets against the Japanese yen. Non-commercial futures positions, those taken by hedge funds and large speculators, were overall net short the US dollar by $25.18 billion against other major currencies as of April 5th. The data is a decline from the total short position of $27.77 billion on March 29th, according to the CFTC data and calculations by Reuters which calculates the dollar positions against the euro, British pound, Japanese yen, Australian dollar, Canadian dollar and the Swiss franc.

This week’s most notable change was Japanese yen positions declining sharply for a second straight week to their lowest level in almost a year. Australian dollar futures positions increased to the highest level of the year while euro positions advanced for a third straight week.

EuroFx: Currency speculators increased their net long positions for the euro against the U.S. dollar for a third consecutive week. Futures positions in the euro rose to a total of 59,857 long positions as of April 5th following a total of 56,630 long positions on March 29th.


The COT report is published every Friday by the Commodity Futures Trading Commission (CFTC) and shows futures positions as of the previous Tuesday. It can be a useful tool for traders to gauge investor sentiment and to look for potential changes in the direction of a currency or commodity. Each currency contract is a quote for that currency directly against the U.S. dollar, where as a net short amount of contracts means that more speculators are betting that currency to fall against the dollar and net long position expect that currency to rise versus the dollar. The graphs overlay the forex spot closing price of each Tuesday when COT trader positions are reported for each corresponding spot currency pair.

GBP: British pound sterling bets rebounded as of April 5th to a total of 32,414 net long positions after declining the week before to a total of 743 long contracts on March 29th.


JPY: The Japanese yen net contracts dropped sharply for a second straight week. Yen contracts dropped to a total of 43,231 short contracts following a total of 7,052 net long contracts reported on March 29th. This is the lowest level for yen contracts since May 2010.


CHF: Swiss franc long positions were lower for a third straight week as of April 5th. Franc positions declined to a total of 10,843 net long contracts following a net of 18,957 long contracts on March 29th.


CAD: The Canadian dollar positions increased higher for a second consecutive week. CAD positions rose to a total  of 65,030 contracts as of April 5th after CAD net contracts had edged higher to a total of 51,245 net long contracts as of March 29th.


AUD: The Australian dollar long positions rose higher last week to the highest level in over a year. AUD contracts totaled a net amount of 90,938 long contracts as of April 5th after AUD positions had totaled 85,565 net long contracts on March 29th.


NZD: New Zealand dollar futures positions edged slightly higher for a third consecutive week. NZD contracts increased to a total of 2,695 long positions as of April 5th from a total of 239 long contracts on March 29th.


MXN: Mexican peso long contracts rebounded higher to a total of 119,062 net long contracts on April 5th. MXN positions had been about unchanged the week before at a total of 88,075 long contracts as of March 29th.


COT Data Summary as of April 5, 2011
Large Speculators Net Positions vs. the US Dollar

EUR: +59,857
GBP: +32,414
JPY: -43,231
CHF: +10,843
CAD: +65,030
AUD: +90,938
NZD: +2,695
MXN: +119,062

Further COT Resources from around the web:

EURUSD hits major Fibonnacci level

EURUSD Weekly Technical Analysis.

A tough week for the dollar has culminated in EURUSD hitting the 61.8 Fibonacci area coming from the major down wave 1.6035 – 1.1187.  This Fib retrace level comes just below the psychological round number 1.4500.

The weekly candle close is marginally above the level but this could yet prove to be major resistance as it is typically the strongest Fibonacci level in my opinion.   However,  the recent bullish price action necessitates a high quality price action reversal signal if a counter trend position is to be taken.

A more favourable strategy, for trend traders,  could be to wait for price action confirmation on any suitable pull back to the 1.4250 area. This is previous resistance and could potentially become support.  In terms of correlations the dollar index has broken through recent support which also suggests more upside potential for EURUSD.

For further Forex market analysis visit my Forex trading blog.

Murphy Oil climbs after receiving deepwater drilling permit

The Interior Department yesterday granted a deepwater drilling permit to Murphy Oil (MUR) for a sidetrack well, according to a press release issued by the Interior Department’s Bureau of Ocean Energy Management, Regulation and Enforcement. A sidetrack well is drilled to a new geologic target or a new location within the original target from the existing wellbore. The company had a rig on location when drilling preparation activities were halted due to the temporary drilling suspensions imposed following the Deepwater Horizon oil spill. In early afternoon trading, Murphy gained $2.41, or 3.21%, to $77.48.

Google acquisition of ITA Software approved, with conditions

The Department of Justice said it had approved Google’s (GOOG) acquisition of travel software maker ITA Software with a number of conditions. The department will require Google to develop and license travel software, to establish internal firewall procedures and to continue software research and development. The department said that Google will also be required to provide mandatory arbitration under certain circumstances and provide for a formal reporting mechanism for complainants if Google acts in an unfair manner.

Monster Worldwide Up 3.7% Following Jim Cramer Comments

Monster Worldwide (MWW) rises after theStreet.com’s Jim Cramer said late Thursday he sees a bullish trend for MWW. The company trades at just 20 times earnings, but has a 20% long-term growth rate, he said. He said shares will likely snap back soon, and he’d be a buyer.