Mid-Week Trading Trends & Analysis: Stocks and Commodities in favor again?

By Chris Vermeulen, thegoldandoilguy.com

It has been a very interesting week thus far. Monday kick started traders with a heart pounding equities sell off which sent money into the US Dollar, precious metals and bonds as the safe havens of choice.

A lot has happened this week on a technical analysis basis which I can’t really show in a written report like this. But can do so in detail within my video newsletter. There are just to many charts required and layers of analysis to cover… But I can cover some of the points and my thoughts using the charts below:

SPY 30 Minute Intraday Chart
This chart shows the volume traded at various price levels for the SP500 index. These high volume levels act as support or resistance depending if you are above or below them. On Wednesday, we had large gap higher into a resistance level which the market could not break through. So I am expecting to see the market take a pause and fade back down to fill part or all of Wednesday’s gap window.

While most gaps tend to get filled. Gaps that occur right at the beginning of a new trend when momentum is strong. They generally do not fill all the way down to the bottom. I expect a couple days of sideways to lower price action. Buyers should step back in and send the market higher next week if this trend is to continue.

GDX – Gold Miner Stocks – Daily Chart
Gold stocks have been underperforming the price of gold bullion for several months. This typically is not a strong sign for physical gold prices. That being said I do feel the majority of investors are seeking true safety and want to own real gold and not some highly leveraged gold stock. This to me is more of a risk off trade for global investors and it explains the performance.

From the recent price action shown on the GDX chart I am expecting to see prices trade sideways or lower in the coming days. A sideways move would actually be bullish and would signal a possible breakout to upside. So that is what I am hoping will unfold in the coming days/weeks.


US Dollar Daily Chart

The dollar continues to get sold at a tremendous rate and the Fed is devaluing the currency as quickly as they can trying and save the world one dollar at a time…
The trend is strongly down but it’s starting to near a point where we should start to keep a closer eye on it for signs of a reversal to the upside. When the dollar makes a move higher and starts a rally it will put downward pressure on stocks and commodities. We must be prepared to move our protective stops ups and possibly take advantage of falling prices in the near future. Until then remain long equities and commodities.

Mid-Week Trend Conclusion:
In short, it looks as though stocks and commodities are in favor again. Monday’s panic sell off looks to have shaken the masses out of the market and the big money players were buying up all the shares they could. Members and myself are sitting nicely in our long positions and this could be the start of something exciting.

You can get my Pre-Market Trading Analysis Videos, Intraday Chart Updates and Trade Alerts with my Premium Newsletter: http://www.thegoldandoilguy.com/free-preview.php

Chris Vermeulen

Understanding the Fed

EWI’s free eBook explains the common and misleading myths about the U.S. Federal Reserve Bank

By Elliott Wave International

What exactly is the function of the Fed? If it’s to help the U.S. economy grow steadily, then how come in 2007-2009 we had the biggest stock market crash in decades followed by “the Great Recession” and a worldwide financial crisis?

For answers, let’s turn to someone who has spent a considerable amount of time studying the Fed and its functions: EWI’s president Robert Prechter.

This is an excerpt from a free Club EWI eBook, “Understanding the Fed.” Enjoy — and for details on how to read this important 32-page eBook in full, free, look below.

The Fed’s Presumed Inflation Since 2008 Is Mostly a Mirage

Excerpted from Prechter’s December 2009 Elliott Wave Theorist

… We all know that the Fed created $1.4 trillion new dollars in 2008. It has told the world that it will inflate to save the monetary system. So that is the news that most people hear.

But the Fed’s dramatic money creation in 2008 only seems to force inflation because people focus on only one side of the Fed’s action. Even though the Fed created a lot of new money, it did not affect the total amount of money-plus-credit one bit… When the Fed buys a Treasury bond, net inflation occurs, because it simply monetizes the government’s brand-new IOU. But in 2008, in order for the Fed to add $1.4 trillion new dollars to the monetary system, it removed exactly the same value of IOU-dollars from the market. It has since retired some of this money, leaving a net of about $1.3 trillion.

So investors, who previously held $1.3t. worth of IOUs for dollars, now hold $1.3t. worth of dollars. They are no longer debt investors but money holders. The net change in the money-plus-credit supply is zero. The Fed simply retired (temporarily, it hopes) a certain amount of debt and replaced it with money.

Evidence for this case is in Figure 4. Even though the Fed has swapped over a trillion dollars of new money for old debt, the banks aren’t lending it. The money multiplier is back in negative territory, which means that there is more debt being retired than there is new money being created. In other words, deflation is winning.

The Fed's new money is simply replacing old debt, not creating new debt

The bottom line is that the Fed hasn’t created much inflation over the past two years. The only reason that markets have been rallying recently is that the Elliott wave form required a rally. In other words, in March 2009 pessimism had reached a Primary-degree extreme, and it was time for a Primary-degree respite. The change in attitude from that time forward has, for a time, allowed credit to expand again.

But the Fed and the government didn’t force the change. They merely accommodated it, as they always have. They offered unlimited credit through the first quarter of 2009, and no one wanted it. In March, the social mood changed enough so that some people once again became willing to take these lenders up on their offer.

When credit collapses again during the wave 3 downtrend, we at Elliott Wave International will no longer have to keep “making the case” that the Fed is impotent. It will be clear once again, just as it was in 2008. (…continued)


Read the rest of this important 32-page eBook online now, free! All you need is to create a free Club EWI profile. Here’s what it covers:Chapter 1: Money, Credit and the Federal Reserve Banking System
Chapter 2: What Makes Deflation Likely Today?
Chapter 3: Can the Fed Stop Deflation?
Chapter 4: Jaguar Inflation
Chapter 5: Can’t Buy Enough…of That Junky Stuff, or, Why the Fed Will Not Stop Deflation
Chapter 6: The Fed’s “Uncle” Point Is In View
Chapter 7: Government Thrashing
Chapter 8: The Coming Deflationary Pressure on the Government 

Keep reading this free report now.

This article was syndicated by Elliott Wave International and was originally published under the headline Understanding the Fed. EWI is the world’s largest market forecasting firm. Its staff of full-time analysts led by Chartered Market Technician Robert Prechter provides 24-hour-a-day market analysis to institutional and private investors around the world.

Super Volcano In First Gen Corporation (FGEN)

first gen corporation, FGEN philippine stocks, lopez, ron acoba, cup and handle, daily stock picks, stock market trading

If my chart reading reading is correct, then First Gen Corporation or FGEN in the Philippine Stock Exchange could be poised for a huge upside. 

FGEN is actually one of the top performers among local equities so far this year with about 11% in YTD return. But its story does not end there as based on its daily chart at least, FGEN could explode like a super volcano. Looking at its price chart over the past 6 years, I noticed that it was bottoming into a huge cup and handle pattern with a neckline at just above PHP 14.00. FGEN is already inching towards the said resistance and when it breaches that level, there’s a good chance that it could swing all the way towards PHP 21.20 (measured by projecting the height of the cup from the point of potential breakout)!

I would, of course, wait for a break out to occur first before I go long to diminish the possibility of getting whipsawed. An entry point of PHP 15.00 would give me a possible 41% upside!

More on LaidTrades.com

Philex Mining Corporation (PX) Digs Up Some Gains!

Despite the 0.56% and 1.14% drop of the PSEi today and the Dow Jones Industrial Average (DJI) yesterday respectively, gold mining companies listed in the Philippine Stock Exchange like Philex Mining Corporation, Manila Mining Corporation and Lepanto Consolidated Mining Company still made it to the top gainers list today. In which case, I chose the stock chart of Philex Mining Corporation or PX in the Philippine Stock Exchange to be the highlight in this post.

On the canvass is the 2-year chart of Philex Mining. By the way, this was one of our stock pick from the Absolute Traders event “BULL pa ba or BEAR na ba??? which I presented last March 25 (kindly check here). Anyway, PX broke out from the 7-month symmetrical triangle chart pattern yesterday and based on the triangle’s size, the target price could be PHP19.00. In the bigger picture, the symmetrical triangle also serves as the handle of the possible 15-month cup and handle formation with the neckline at PHP17.00 and today’s 3.57% gain closed the stocks at PHP17.06. Thus, we could consider PX to have broken out from the cup and handle formation backed up with heavy volume, the MACD heading further north and the 50, 100 and 200-day moving averages being left behind. On the other hand, the cup and handle breakout doesn’t look very convincing so we’ll need tomorrow’s trading session to confirm a complete break above the PHP17.00 marker. Otherwise, it could retrace back down to its immediate support at PHP16.30 before it clears out the PHP17.00 hurdle. In case PHP16.30 won’t hold, the next support could be the 7-month uptrend. On the bright side, gauging the cup’s height and added it to the breakout point, my target price is set to PHP23.00. However, before it reaches that level, the PHP20.00 all-time high will most likely be retested first.

More on LaidTrades.com

Metro Pacific Investments Corp. (MPI) Inching Higher

 metro pacific investments corp., MPI philippine stocks, pennant, manny pangilinan, ron acoba, daily stock picks, stock market trading

Manny Pangilinan’s Metro Pacific Investments Corporation or MPI in the Philippine Stock Exchange is slowly getting under the market’s radar.  

Despite the company’s solid fundamentals, its shares have been laggard for the past several months. From a high of PHP 4.44 last November 2010, it even found itself to a low of PHP 3.11 less than a month ago. However, it was able to pick itself up since that low. After clearing the PHP 3.40 resistance, it sprung towards PHP 3.80 before it consolidated to what appears to be a bullish pennant pattern. And guess what? MPI just broke out from this pennant yesterday. So if we use the height of the pennant’s pole to gauged it’s upside, we would arrive to a minimum upside target of PHP 4.10 in the near term. Not bad. Any dip here and there of course would also be a good pick up level in my opinion.

By the way, this was one of  our stock picks from the Absolute Traders event “BULL pa ba or BEAR na ba??? last March 25 which my colleague presented along with DMCI Holdings Inc. (DMC) and Philex Mining (PX) just before they broke out (kindly check here).

More on LaidTrades.com

Stocks Of Cebu Air, Inc. (CEB) To Crash Land?


Cebu Air, Inc. is a Philippine company engaged in the aviation industry offering scheduled flights to both domestic and international destinations. For those who do not know, they are a subsidiary of JG Summit Holdings (JGS) which is majority owned by the Gokongwei family.

Also known as Cebu Pacific or CEB in the Philippine Stock Exchange, it hit the 11th spot in today’s top losers list. Its 3% decline to PHP76.90 triggered the recent breakdown from the symmetrical triangle chart pattern. As a fresh breakdown, the stocks could further hit lower grounds in the coming days. Actually, adding the height of the triangle’s base to the breakdown point, I’m looking at PHP63.00 as the target price for CEB but before it reaches that level, buying pressure could be experienced at the PHP74.50 all-time low. On the upside, in case the stocks head north once again, the immediate resistance could be the triangle’s support. If that hurdle gets cleared out, the next resistance could be the 5-month downtrend.

On the side note, my technical sentiments on CEB will be bearish until the MACD moves to the positive territory, the stocks break above the 50-day moving average and the 5-month downtrend line gets broken. Although the flight sales of Cebu Pacific is skyrocketing right now as more people fly in and out of town or country for the summer vacation, I’d rather buy the stocks given a bright technical entry.

More on LaidTrades.com

Bullish Market Lifts Riskier Assets, Weighs on USD

Source: ForexYard

Wednesday’s relatively thin market conditions have apparently granted support to the euro and other commodity-linked currencies. Tensions appear to be easing in regards to recent flare-ups in debt woes in the US and Europe, which have helped temper risk aversion in the market and pull down on safe havens like the USD.

Economic News

USD – USD Drops after Existing Homes Sales Data Boosts Risk Appetite

The US dollar lost some ground yesterday as positive figures from the existing home sales data helped generate risk appetite. This shift in sentiment has spurred a rebound in higher yielding currencies like the euro, British pound, Swiss franc and Canadian and Australian dollars as traders pulled out of safe havens and into currencies with slightly higher yields.

Wednesday’s relatively thin market conditions have apparently granted support to the euro and other commodity-linked currencies. Tensions appear to be easing in regards to recent flare-ups in debt woes in the US and Europe, which have helped temper risk aversion in the market and pull down on safe havens like the USD.

Coupling the home sales data with yesterday’s bullish figures out of Europe also helped the EUR/USD push up from Tuesday’s losses. Traders may begin to anticipate a modest bump in the pair as fundamentals tilt more and more towards riskier currencies. With today’s manufacturing and unemployment figures out of the United States, there is a chance that a positive reading out of today’s indicators may help drive investors deeper into riskier assets, further pulling down on the greenback.

EUR – EUR Bullish as Investors Turn to Higher Yielding Assets

The euro experienced an uptick yesterday as global investors took bullish reports out of Europe and the United States as a sign to buy into riskier assets. The EUR/USD bounced off its 1.4206 support line and currently trades near the 1.4530 level as of this morning. This week’s thin market conditions from the Easter holiday and Spring Break vacation period provides little support to move the price in either direction, but fundamentals appear to be shifting in favor of the euro as of mid-week.

Monetary policy adjustments have many currencies trading more volatile than they have been recently, with Sweden’s Riksbank the most recent example with a lifting of rates by 25 basis points yesterday. The British pound has experienced a few price swings and the move into and out of carry trades has made trading the Swiss franc, Japanese yen and even US dollar more unpredictable. But yesterday’s shift into riskier assets is providing some normalcy for short-term traders who now see riskier assets pushing higher against their rivals.

The economic calendar today is focused more intently on Britain and North America. Overall, traders are eyeing tomorrow’s retail sales figures out of Britain and Canada for a fuller picture of what is to come after the Easter holiday this weekend. Traders will want to keep a lookout for tomorrow’s German Ifo Business Climate report since it will be the last significant figure published by the euro zone in this week’s trading. It could push the EUR higher if it comes out above expectations, especially considering the recent move into riskier assets from positive fundamentals.

JPY – Yen Mixed as Risk Appetite Gains Momentum

This week’s talk of rising risk appetite may have found solid ground yesterday as American existing home sales data helped highlight growing consumer optimism, lower oil inventories signaled positive industrial growth in the US, and Australian import prices and inflationary data grew more than expected, leading many to speculate a tightening of monetary policy by the Aussie giant. The impact has been for safe havens, like the Japanese yen, to find its feet swept out from underneath it, but mixed versus other safe havens, like the US dollar and Swiss franc.

The yen has fallen against most of its currency rivals since yesterday. The USD/JPY, however, has remained flat near 82.50 since Monday. Against the British pound, traders have also witnessed a leveling-off effect as the pair consolidates around 135.50. With the economic calendar today focused on British and Canadian economic news, the yen will likely not experience much change unless the US economy continues to release positive data. If that is the case today, traders may want to anticipate a second rise in risk appetite as traders move to higher yielding currencies.

Crude Oil – Unexpectedly Sharp Drop in Inventories Lifts Oil Price

US crude oil inventories revealed an unexpectedly steep decline of 2.3M barrels this week. Traders have begun to assess what impact this will have on price and what it may mean for global industry. The connection of US stockpiles to the price of crude oil is difficult to gauge, however. A decline could either represent a short-fall in supply or simply an expansion of usage from bolstered demand. Either way it tends to suggest an increase in price, which is what traders witnessed yesterday.

The other side of this equation, however, may be that the US decided to release more of its inventories to alleviate pressure at the pumps since US gas prices have climbed to nominal record highs over the past few weeks. No matter what the reason, this shortfall in stockpiles is helping to fuel a buy-in on crude oil’s spot and futures market driving the price to an 8-day high. Traders may expect a corrective downturn if the USD finds support soon, otherwise it may be a safe bet to join the bullish trend.

Technical News

EUR/USD

Most technical indicators are showing that this pair is overbought, and is likely to see a downward correction in the near future. On the 4-hour chart, the Williams Percent Range has crossed into the overbought zone, while the 8-hour chart’s Slow Stochastic shows a bearish cross has formed. Going short appears to be the wise choice today.

GBP/USD

The Stochastic Slow on the 8-hour chart has formed a bearish cross, indicating that downward movement is likely to occur. This theory is supported by the Relative Strength Index on the 4-hour chart, which is currently well into overbought territory. Traders will likely want to short this pair today.

USD/JPY

The Williams Percent Range is currently well into the oversold zone on the daily chart, indicating that an upward correction may occur today. In addition, the Relative Strength Index on the 8-hour chart is also oversold. Going long may be the wise choice today.

USD/CHF

The Stochastic Slow on the 4-hour chart has formed a bullish cross, indicating that an upward correction is likely to occur in the near future. The Williams Percent Range on the daily chart is currently at the -90 level, giving further support to the theory of upward movement today. Going long with tight stops may be the preferred strategy today.

The Wild Card

AUD/USD

The Williams Percent Range on the 4-hour chart of this pair is currently in overbought territory, indicating that a downward correction is likely to take place. This theory is supported by the Stochastic Slow on the same chart, as well as the 8-hour chart’s Relative Strength Index. Now may be a great time for forex traders to open up short positions before the downward breach occurs.

Forex Market Analysis provided by ForexYard.

© 2006 by FxYard Ltd

Disclaimer: Trading Foreign Exchange carries a high level of risk and may not be suitable for all investors. There is a possibility that you could sustain a loss of all of your investment and therefore you should not invest money that you cannot afford to lose. You should be aware of all the risks associated with Foreign Exchange trading.

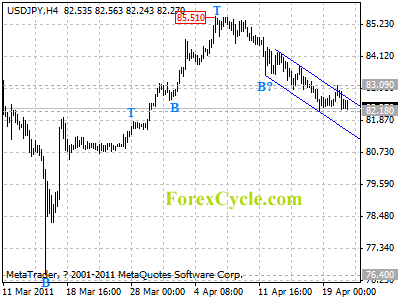
USDJPY stays in a falling price channel

USDJPY stays in a falling price channel on 4-hour chart, and remains in downtrend from 85.51. Key resistance is located at 83.09, as long as this level holds, downtrend could be expected to continue, and next target would be at 81.50 area. However, a break above 83.09 will indicate that a cycle bottom has been formed, and the fall from 85.51 has completed at 82.18 already, then the following upward move could bring price back to 83.45 zone.

usdjpy

Forex Signals