EU/IMF Bailout of Portugal Announced, EUR/USD Bearish

Source: ForexYard

The euro appears to have fallen mildly against a number of its currency rivals yesterday after the European Union and International Monetary Fund (IMF) announced their expected plans for a bailout of Portugal. As a result, the EUR/USD came off its recent 17-month high of 1.4900 to trade moderately lower, near the 1.4820 mark at today’s Asian market open.

Economic News

USD – Safe Havens Gain, USD Mixed, as Investors Move to Safety

The US dollar experienced mixed results yesterday as traders began to shift away from riskier assets citing expectations for al Qaeda reprisals following Osama bin Laden’s death. The USD moved lower against the safe haven Swiss franc and Japanese yen on global concerns while stocks and commodities begin to trade flatter.

The USD did see some minor gains against the EUR, however, as news of the European Union’s bailout of Portugal surfaced, pushing traders away from Europe side-by-side with Britain following yesterday’s decline in the UK’s manufacturing PMI. The US economy also published a series of highly bullish figures yesterday, such as a new factory orders report which showed a 3% monthly jump coming alongside a slightly better than forecast total vehicle sales indicator.

The issue of American interest rates remains ever-present in economic analyses lately; leading many speculators to claim that this recent return to safety may leave the dollar exempt from the shift, as it usually is during times of uncertainty. Today’s publication of ADP’s Non Farm Employment Change report will give a preview into the all important employment sector of the US economy. There is a possibility that bullish jobs data could lift the USD in the short-term, but it is yet to be seen whether it can balance the bearishness brought on by last week’s FOMC rate statement.

EUR – EUR Bearish following Portugal Bailout Announcement

The euro appears to have fallen mildly against a number of its currency rivals yesterday after the European Union and International Monetary Fund (IMF) announced their expected plans for a bailout of Portugal. As a result, the EUR/USD came off its recent 17-month high of 1.4900 to trade moderately lower, near the 1.4820 mark at today’s Asian market open.

The downturn may end up being short-lived, however, as investors returned temporarily to safe haven investments in expectation of an al Qaeda reprisal following bin Laden’s death this weekend. Portugal’s bailout was structured as expected and should not have a lasting impact on the region’s currency value. The bearishness on the EUR today should end up a mild downtick in a prolonged upward movement versus its major counterparts.

As for today, the euro looks like it may take further losses as trader sentiment moves towards safety. The 17-nation economic bloc will once again be largely absent from today’s calendar, with only a minor Flash PMI publication scheduled to be released at 9:00 GMT and a regional retail sales report at 10:00 GMT. A strong series of data releases is expected out of Great Britain, though, and should have significant impact on the faltering British economy.

JPY – Greenery Day Continues Golden Week in Japan

The JPY has been trading with mixed results recently as investors turn their focus elsewhere amid global reactions to the death of Osama bin Laden. After reaching upwards of 82.75 on Monday, the USD/JPY quickly dropped to a daily low of 81.00 by Tuesday evening, and looks to fall farther in today’s sessions as investors remain largely bearish on the greenback.

With Japan celebrating Greenery Day, amid Golden Week, liquidity throughout the region will be somewhat depressed. The JPY could gain from this absence as the rest of global traders shift towards Europe, as well as safe havens. As for today, the JPY will be absent from the market again, meaning global investors will continue to focus their attention elsewhere, creating mixed results for the yen. But the recent shift into safe havens following expectations of an international reprisal from al Qaeda in response to bin Laden’s death has helped lift the yen and should continue to do so for the remainder of the week.

Oil – Physical Assets and Stocks Decline as Investors Seek Safety

The prices of physical assets and global stocks ended Tuesday lower on the day as traders largely began to speculate an imminent reprisal from al Qaeda following Osama bin Laden’s death. The result has been a moderate dip in stock prices, also weighing on the price of assets like oil, silver, gold, and a variety of industrial metals. The biggest gainers on the day were the Swiss franc and Japanese yen, making strides from the shift in sentiment.

As for today, crude oil traders may want to consider that commodities, which are linked to the value of the US dollar, are likely going to continue receiving a boost in the immediate future due to recent monetary policy statements out of the US. Hawkish statements about economic growth may suffice to hold prices stable between $111 and $115, but many speculators are beginning to anticipate another bull run in commodity prices, but timing is everything. Recent events have delayed that event, but do not yet appear to have killed its prospects.

Technical News

EUR/USD

The pair has been range trading between 1.4750 and 1.4900 and the failure of the pair to make a close above the 1.4900 level is slowing momentum behind the bullish trend. Weekly stochastics are overbought and a decline in the pair could trigger a price drop to the 1.4630 area with further support coming in at 1.4520, a level that coincides with the rising trend line off of the January low. A breach above 1.4900 would target the 2009 high at 1.5140.

GBP/USD

Following yesterday’s sharp decline in the pair, initial support is near the 20-day moving average at 1.6460. The support level at 1.6430 could be an area of interest for technical analysts. This price level coincides with the late April low and a 38.2% Fibonacci retracement of the April move higher. Below this key area further support is found at the mid-April low of 1.6165, followed by the rising trend line off of the May 2010 lows which comes in today at 1.5970.

USD/JPY

The pair continues to fall towards the 80 yen level after moving below the 50% Fibonacci retracement from the pre-intervention low. Traders should be mindful of a breach below the 80 level as this could bring further intervention by the Japanese Ministry of Finance. Support comes in at 82.80.

USD/CHF

Yesterday the pair briefly hit a new all-time low under the 0.8600 level before pulling back to 0.8640. Traders should be short on the pair with stops above the 20-day moving average line which comes in today at 0.8825.

The Wild Card

Silver

Silver prices plunged yesterday by more than 8% to a low of $40.53 before trading back to $41.00. The price drop is largely considered a technical correction and the low of the day coincides with the rising trend line off of the January low. Forex traders may find this an opportunity to buy into the uptrend on a bounce from the trend line. A protective stop should be placed underneath the rising trend line to protect against any further downside move in the commodity.

Forex Market Analysis provided by ForexYard.

© 2006 by FxYard Ltd

Disclaimer: Trading Foreign Exchange carries a high level of risk and may not be suitable for all investors. There is a possibility that you could sustain a loss of all of your investment and therefore you should not invest money that you cannot afford to lose. You should be aware of all the risks associated with Foreign Exchange trading.

GBP/USD Technical Analysis – May/04

GBP/USD Technical Analysis – May/04

By Praful Patat  05:00 GMT

GBPUSD is consolidation on 1 hour chart, also trend line pass at 1.6483 (Wedge Formation pattern). Now GBPUSD is on 50.0% (1.6454) of 1.6164 to 1.6745, 61.8% (1.6387). GBPUSD retraced 38.2% (1.6625) of 1.6429 to 1.6745, extension 1.6830, 1.6940, still in progress.  In GBPUSP minor support is at 1.6429. GBPUSD break of 1.6683 resistances, next target will be 1.6830-1.6940 area. If GBPUSD will reverse from 1.6523, 1.6383 area, extension is at 1.6895, 1.7091 in bigger range.

New High:  1.6573, 1.6672, 1.6585.

New Low:  1.6376, 1.6475, 1.6388.

Pivot Point: R3-1.6733, R2-1.6658, R1-1.6611, PP-1.6536, S1-1.6460, S2-1.6414, S3-1.6338.

For more please Visit – ForexTradingEVO.com


GBPUSD Dialy chart 03-05


LatestGBPUSD
Last1.6472
High1.6660
Low1.6462
5 day1.6622
10 day1.6552
20 day1.6430
50 day1.6269
100 day1.6041
200 day1.5898

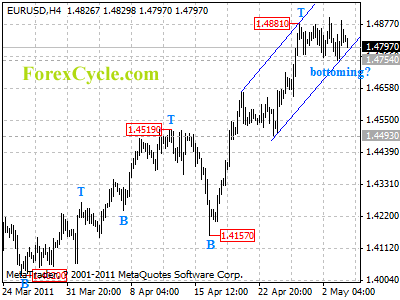
EURUSD rebounded from 1.4754

Being supported by the price channel on 4-hour chart, EURUSD rebounded from 1.4754, suggesting that a cycle bottom is being formed. Now the bounce from 1.4754 would possibly be resumption of uptrend from 1.4157. further rise would likely be seen later today, and next target would be at 1.5000. Only a clear break below the channel support will indicate that lengthier consolidation of uptrend is underway, then pullback to 1.4600 area is expected.

eurusd

Forex Signals

Century Peak Metals Holdings Corporation (CPM) Reversing Its Course!


The stocks of Century Peak Metals Holdings Corporation or CPM in the Philippine Stock Exchange was today’s top 10 flyer closing the trading session up by 5.26% to PHP2.40 with 6.3 million volume traded. For those who do not know, this company is engaged in the mining industry as well as investing in real estate development and energy.

Last December of 2010, CPM tapped an all-time high of PHP7.10 then started to descend from there on. It reached a low of PHP1.82 last March and could fortunately be attempting to bounce back up given its recent price movement. Like last April 7, the stocks broke out from the 1-year downtrend with an 18.8% gain shifting the MACD towards the positive territory. Also, in today’s trading session, the 50, 100 and 200-day moving averages have been completely cleared out. In that case, the bulls could be taking over.

Even better, if you look at my analysis above, there could be a 6-month inverted head and shoulders forming. As most of us know, this area pattern is often a reversal pattern. This inverted head and shoulders could bring CPM back to the bullish track as it currently moves sideways following the 1-year descent. To confirm the inverted head and shoulders spotted, the stocks need to break above the PHP2.50 neckline. If that hurdle gets cleared out, we could get a minimum target price of PHP3.10 which I got by adding the size of the head to the possible breakout point. However, before it gets to that level, it first needs to clear out the PHP2.84 resistance. In case the inverted head and shoulders fail and the stocks start to drop, the immediate support could be the 1-month uptrend. If that further breaks, PHP2.10 could be the next support.

More on LaidTrades.com

PNB To Revisit Its 8-Year High?


Philippine National Bank or PNB in the Philippine Stock Exchange made an awesome 60% run in just 2 months. One of the reason for the sudden rise was the speculation of another bank’s acquisition on PNB. From PHP42.05 last February, the price shot up to PHP68.60 2 months later.  Then PNB corrected and started consolidating sideways. In the process, its stocks could be forming a 3-week bullish pennant awaiting for a breakout as the price moves above the 50, 100 and 200-day moving averages. The diminishing volume also confirms the possible formation. If the stocks break above the pennant’s resistance with heavy volume, the target price we could set is the 8-year high of PHP74.50. I got this by gauging the height of the pennant and added it to the possible breakout point. However, before it reaches that level, the 68.60 resistance first needs to be cleared out. On the flip side, the immediate support could be 61.90. If that gets breached, the next support could be 56.80.

More on LaidTrades.com

Stocks Rally On the News of Bin Laden’s Death, You Say? It’s Not That Simple

Interest rates, oil prices, trade balances, corporate earnings and GDP: None of them seem to be important, or even relevant, to explaining stock price changes

By Elliott Wave International

On the morning of May 2, the financial headlines were abuzz with the news of Osama Bin Laden’s death and its positive impact on the stock market:
“Stock Market Celebrates Killing of Bin Laden” (The Wall Street Journal)

But despite a positive open, stocks closed lower on May 2. Undoubtedly, in the days ahead we’ll hear analysts explaining how Bin Laden’s death is not that “bullish” of an event, after all.

On that same note, MarketWatch.com ran an interesting story on May 2 that quoted from a research paper which found “little evidence that non-economics events have a big effect on the stock market.”

Here at EWI, we go one step further and say the following: Economic events have little impact on the stock market, too.

Don’t believe us? Read this excerpt from a free Club EWI resource, the 50-page 2011 Independent Investor eBook, and judge for yourself.

The Independent Investor eBook, 2011 Edition

(Excerpt; full report here)

…Economists’ Claim #5: “GDP drives stock prices.”

Suppose that you had perfect foreknowledge that over the next 3¾ years GDP would be positive every single quarter and that one of those quarters would surprise economists in being the strongest quarterly rise in a half-century span. Would you buy stocks?

If you had acted on such knowledge in March 1976, you would have owned stocks for four years in which the DJIA fell 22%. If at the end of Q1 1980 you figured out that the quarter would be negative and would be followed by yet another negative quarter, you would have sold out at the bottom.

Suppose you were to possess perfect knowledge that next quarter’s GDP will be the strongest rising quarter for a span of 15 years, guaranteed. Would you buy stocks?

Had you anticipated precisely this event for 4Q 1987, you would have owned stocks for the biggest stock market crash since 1929. GDP was positive every quarter for 20 straight quarters before the crash and for 10 quarters thereafter. But the market crashed anyway. Three years after the start of 4Q 1987, stock prices were still below their level of that time despite 30 uninterrupted quarters of rising GDP.

Figure 10 shows these two events.

GDP does not determine the trend of the stock market

It seems that there is something wrong with the idea that investors rationally value stocks according to growth or contraction in GDP. …
Claim #6: “Wars are bullish/bearish for stock prices.”(continued)

Keep reading the 50-page Independent Investor eBook now, free — all you need is a free Club EWI password.

This article was syndicated by Elliott Wave International and was originally published under the headline Stocks Rally On the News of Bin Laden’s Death, You Say? It’s Not That Simple. EWI is the world’s largest market forecasting firm. Its staff of full-time analysts led by Chartered Market Technician Robert Prechter provides 24-hour-a-day market analysis to institutional and private investors around the world.

Why the Stock Markets Closed Lower Yesterday

stock_indexThe stock markets are up 15% over the past year… If you had asked me what stock markets should have done on Monday, after we learned Enemy Number One was killed in a compound in Pakistan, I would not have guessed that markets would have lost points yesterday.

But that’s what happened.

All three major indexes finished lower on Monday, and gold and oil also dropped.

In fact, some experts are saying the drop in crude oil prices was what pulled down the stock markets on Monday.

But let’s keep things in perspective. Crude oil prices dropped less than $1 a barrel. With gasoline prices at a national average of more than $3.95 per gallon, you’d think that a drop in oil prices would be welcomed by the stock market.

Energy stocks took much of the hit, which added to the drop in the stock market. And yet, there might be another reason why markets lost some ground on Monday.

Refocused on the Economy

From the Associated Press:

Buffett doesn’t expect the bin Laden news to affect business much.

“I don’t think this is a big market factor,” Buffett said on the Fox Business Network. “The American people feel wonderful today — all of us — but in terms of earning power of American business, I don’t think that factor should change dramatically because of this.”

That means the market has been moved by what’s actually happening in our economy. The stock market has been ignoring the truth about the American economy for a long time. And now that focus has turned back to the details.

Earnings reports have come off well this first quarter, but higher costs will start to eat into corporate profits. The market rally is already running out of steam.

Indeed, some investors, who have been holding on to gains from the market rally, used the news of bin Laden’s death as a reason to sell.

This could put more important economic reports back in the spotlight.

(Investing doesn’t have to be complicated. Sign up for Smart Investing Daily and let me and my fellow editor Jared Levy simplify the stock market for you with our easy-to-understand investment articles.)

An Unstable Recovery

The manufacturing index fell in April. The index is still signaling growth… just not as much as in March.

The economy is recovering. We will see GDP growth this year. But the recovery is happening very slowly, and there are some really strong arguments that question the strength of this recovery.

We’ve made some of them here. Food prices are still sky-high. Energy prices, too, despite the drop in oil prices yesterday. Unemployment is still outrageous, and government debt is still climbing. The Federal Reserve is holding interest rates near zero for an unknown amount of time.

None of this is good for the long-term health of the U.S. economy.

The problem is, in my opinion, the markets have priced in a full-blown recovery. Bloomberg reports, “The S&P 500 Total Return Index, which measures the gauge’s performance including reinvested dividends, rallied for an eighth straight month in April to match its longest streak of gains since 1995.”

And analysts are still saying that the markets are not overvalued.

This may not even be true in comparison to the S&P 500’s historic average. The index showed a valuation of 15.5 last week, but since 1870, the S&P 500 has had an average P/E ratio of 15.

S&P Doubled Since 2009

Just look at this rebound from the 2008 financial crisis:

S&P Chart
View larger chart

Since March 9, 2009, the S&P 500 has climbed more than 101%. Now, I thought the bottom back then was way overdone. A lot of good, solid companies suffered right along with the companies that brought the financial crisis down on us…

But this rebound is ridiculous without the support of strong economic data.

Are we making improvements? Yes. Official unemployment rates are back below 9%. We’re seeing consumers creep back into malls. Manufacturing is still growing… This is all good news.

It’s a real start. By the looks of this chart, though, we’ve already done the heavy lifting, and that is nowhere near the truth.

In the next nine to 12 months, we could see corporate profits start to decline as energy and food prices are passed on to consumers. As the Federal Reserve comes out of its debt-buying frenzy, it might have to confront higher inflation.

“Free money in the hands of very smart people for too long is likely to create something unpleasant,” Jack Welch said in an appearance on CNBC on Monday.

We have certainly dug ourselves a deep hole, and eventually the Fed will have to raise rates.

An already shaky recovery might not be able to handle that kind of intervention.

We recommend all our readers have some sort of inflation hedge in their portfolio — even at these expensive prices.

Editor’s Note: Natural gas has been in a bear market for two years. But a constellation of forces is lining up to send gas prices through the roof.

Get the full details from Taipan’s Velocity Trader.

Article brought to you by Taipan Publishing Group. Additional valuable content can be syndicated via our News RSS feed. Republish without charge. Required: Author attribution, links back to original content or www.taipanpublishinggroup.com.

{jtagstpg} {authorstpg}

Other Related Sources:

  • U.S. Stocks Fall as Drop in Oil Companies Overshadows Bin Laden
  • Buffett, Welch: Bin Laden Death Won’t End Terror
  • U.S. Stocks Slip as Focus Shifts to Economy
  • Is the Stock Market Cheap?
  • How Do You Make Sense of Earnings Reports?
  • Food Crisis Means Global Changes
  • FX Technical Analysis – GBP/USD

    printprofile

    Following today’s release of disappointing UK Manufacturing PMI data, Sterling sold off sharply. Traders should be looking for a technical retracement to reenter at better levels.

    Looking at the daily chart for the GBP/USD, Sterling was sold today and looks to have found support near the 20-day moving average at 1.6460. Today’s daily low came in at 1.6466.

    The support level at 1.6430 could be an area of interest for technical analysts. This price level coincides with the late April low and a 38.2% Fibonacci retracement of the April move higher. Below this key area further support is found at the mid-April low of 1.6165, followed by the rising trend line off of the May 2010 lows which comes in today at 1.5970.

    To the upside, the mid-April high at 1.6600 may prove to be resistive if only temporary. Traders should initially target a return to last week’s high at 1.6745, followed by the November 2009 high at 1.6875 and the 2009 high at 1.7042.

    GBPUSD_Daily

    Another Blow to British Manufacturing; GBP at Risk of Downturn

    printprofile

    Today’s figures out of the United Kingdom have put the pound sterling’s (GBP) latest uptick at risk of getting pared as investors anticipate a slow-down in British manufacturing. Today’s manufacturing PMI data disappointed traders with a reading well below expectations. This blow to the manufacturing and industrial sector of the British economy has begun to ram against the pound’s April gains, putting it at risk of a downturn through May.

    While the Confederation of British Industry (CBI) did publish a better-than-forecast reading on industrial sales, the data came on the coattails of this morning’s disappointing PMI figure and do not appear to have been enough to lift the pound today.

    This news comes after last week’s highly distressing industrial new orders data revealing a sharp contraction in the industrial sector of the British economy. Britain was not the only nation affected by this downturn in industry. The sluggishness appears to be global with the euro zone, Japan and the United States each experiencing its own trek through the metaphorical mud.

    The pound was trading lower today as a result of this PMI downturn, with the GBP/USD falling to fresh 4-day lows and the GBP/JPY also sank with global investors turning to safe-havens. The shift into riskier assets late last week initially assisted the rise of the GBP, but this week’s poor fundamentals along with a dip in commodity prices has begun to adjust a number of portfolio positions and causing the pound to lose strength in its legs as its pairs falter. Look to the pound continuing to lose support if global industry remains in a downspin.