How to beat the mutual fund companies at their own game

By Ulli G. Niemann

You’d have had to be living on a desert island with no TV, newspaper or internet connection to have missed hearing about the great mutual fund scandal of 2003.

The issue was that some mutual fund companies allowed certain hedge funds to engage in after-hours trading, sometimes incorrectly referred to as market timing. Unfortunately, some companies have used the confusion about the term “market timing” to further their own cause. How?

They have used this issue to pretty much ban all forms of trading their funds, and some companies are imposing hefty short-term redemption fees-penalties for all intents and purposes-in the name of avoiding impropriety. But the real idea behind it all is: Buy our fund and never sell it!

These companies advocate a stubborn Buy & Hold philosophy despite the devastating effects that approach had on investors’ portfolios during the recent bear market. Performance is immaterial to them-they want your money in their fund whether it’s going up or down.

With all of the negative press over the months you’d think that mutual fund companies would have cleaned up their act and started giving more consideration to the individual investor. Not so.

This was brought home to me when a fund manager of an $800 million mutual fund called me to see what my plans were in respect to holding our positions with his fund (about $2 million).

I explained my trend tracking methodology and he got very angry when he heard I would protect my clients’ accumulated profits by selling his fund if it were to drop 7% off its highs.

His blustering made it quite clear that he did not like anyone managing for the benefit of their clients; he only cared about what was best for him and his company.

So, what can you do to prevent being taken advantage of? For one thing, do what your mutual fund company does – not what they tell you to do. Adopt a strategy for following trends, such as I do, and use the mutual fund manger’s superior stock picking ability to your advantage by buying and holding only as long as the fund is performing well.

Remember, the fund manager has one big disadvantage over you: He always “has to” be invested so that the public can purchase shares in his fund. You don’t!

If market conditions dictate that you are better off in the safety of a money market account because we are in a severe downtrend, then you can take your money and run for cover. He can’t. He is constantly trying to adjust his portfolio to ever-changing economic conditions so that his potential losses are minimized. At the same time you are being told that his fund is the investment for all seasons. Don’t fall for it!

You as an individual investor are really in the driver’s seat. Unfortunately, you have probably been conditioned to think that Buy & Hope is a good investment strategy, when in fact it is a losing proposition.

Bottom line is, use a well performing mutual fund during strong up trends and get over to the sidelines during trend reversals. (That’s exactly what I did for my clients in October, 2001, and we retained the lion’s share of their profits while Buy & Holders kept insisting the emperor was wearing new clothes.) Pretty soon you will feel that you are in charge of your financial destiny and any chosen mutual fund is merely a tool to bring you closer to your goals of maximizing your gain and minimizing your losses.

© Ulli G. Niemann


Ulli Niemann is an investment advisor and has been writing about objective, methodical approaches to investing for over 10 years. He eluded the bear market of 2000 and has helped countless people make better investment decisions. To find out more about his approach and his FREE Newsletter, please visit: www.successful-investment.com.

Profit From Understanding This Financial Market Secret

jared levyFrom a young age I can remember my father saying, “Those who forget the past are doomed to repeat it.” My father was talking about the wars and mistakes that people and governments make. Those mistakes have thrown many economies and whole countries into turmoil and in the worst of cases caused the deaths of many.
As I get older, I notice that many of us have heard this saying. We try hard to live that way.

A person who doesn’t drink coffee may not know to check how hot it is before he takes a big gulp. He burns his mouth, but that shocking (and painful) experience would make him more cautious and take a smaller sip next time. This memory would most likely last the rest of his life.

You can find examples of this all around you!

Another might be taking a curve at high speed in your car and having to brake violently to avoid an accident. I bet your next trip around that curve would be much slower and more calculated.

Financial markets, on the other hand, are different.

They would have no problem trying to take that turn at a high speed again and again, even if they had crashed before. Recognizing when the market is acting “irresponsible” can make you (or save you) a lot of money.

There are several reasons for this.

Financial Market Amnesia

The stock market has a sort of amnesia. It tends to forget about major catastrophes and serious geopolitical effects that can have a prolonged impact. It also tends to disregard — or at least discount — the impact these past scenarios have when they repeat themselves.

The “Flash Crash” caused complete pandemonium for a day about a year ago. We still don’t have a clear answer to why it happened. Many experts (including me) believe that the flash crash could happen again. There are major flaws in some of the financial trading products (like certain ETFs) but the market doesn’t see them.

Right now, there are a plethora of major market uncertainties around the globe and talk of housing other economic bubbles in China as well as bubbles in commodities that could send stocks sharply lower.

Just recently are we beginning to see some cracks in the market’s foundation, but the market still remains oblivious…

So why doesn’t the stock market “care” about what is really happening around us?

This is mostly because the market is not an individual with one memory or one opinion; it is a collection of millions of human minds and computers that are constantly changing. In this massive gathering of millions of people that are all connected, they begin to act very different than any individual could.

(Sign up for Smart Investing Daily and let me and fellow editor Sara Nunnally simplify the market for you with our easy-to-understand articles.)

The Crowd

I have spent a great deal of time analyzing crowds of people. I found one of the best descriptions of this phenomenon written in Gustave Le Bon’s book appropriately titled book The Crowd.

To paraphrase:

No matter what the character, occupation or intelligence of an individual, once they become part of a crowd, they will begin to possess a “collective mind” which makes that person feel, think and act in a manner that is completely different from which they would in isolation.

All of us have our own views and opinions, but when we read the paper, watch the news or surf the net, other ideas are being planted in our heads. This is not always a bad thing, but when everyone begins to think the same thing, bubbles can form… Implosions are usually soon to follow.

Remember in 2007, when everything was about real estate? It was everywhere you turned. Positive talk about cheap rates and booming values lured even the savviest investors down the primrose path. Eventually, it all led to disaster.

If you find that people are OVERLY optimistic (or pessimistic), it may not be a bad idea to think about doing the opposite. The difficulty here is timing.

Bubbles and Implosions

Bubbles will always be a part of capitalism. It is your job to recognize them and protect yourself if you think one is about to burst. Part of the reason bubbles form is that greed takes over. The crowd doesn’t want to “miss out” on the deal of the century. Trust me; there will be many opportunities to make money — don’t be afraid to sit out a couple.

There are a couple ways to spot a bubble in progress.

  • Unusual price movements — If you are looking at a stock or index and notice that it is making peculiar movements recently, wait before entering that buy order. The simplest way to spot this is to use a chart.

    If the stock is getting progressively further away from its 50-day moving average and has been moving higher for an extended period of time without a pullback, this might be a caution flag.

    This happened with Google (GOOG:NASDAQ) back in the second half of 2010, and again in the most recent quarter of 2011.

    Make sure do your homework on a stock and find out what has been driving it higher. If you can’t find a realistic explanation, stay away!

  • Overpopular — If a stock or commodity is being touted on TV, news and in your circle of friends and family as a “hot stock,” be wary. Bubbles occur when the crowd becomes obsessed and feels it has to jump on a train that’s leaving the station.

    What ends up happening to most of us is we jump on when the train is actually coming into the station and stopping.

Use your common sense and try not to get excited about any stock or investment. You should have an objective system and checklist that you use to review each and every trade. If an investment doesn’t meet all of your criteria, walk away. Sip your coffee, don’t gulp it. Never go all in!

There will always be opportunities; the trick is to not get caught in the hype of any one of them. The market does not remember the many times it has been burnt, but we the individual participants sure do.

If you want more guidance on when and where the bubbles are forming and how to avoid them, I offer weekly guidance and trade ideas in my trading research service WaveStrength Options Weekly.

Editor’s Note: After bubbles pop, there’s a period where stocks shoot higher. This is the start of a “New Economy.” It’s not a time to be on the sidelines. Safe Haven Investor editor Kent Lucas has created a “New Equity Recovery Program” designed to help you win back some of those gains the housing bubble and market crash took from you. Read his letter if you’re interested in safe, high-percentage returns.

Article brought to you by Taipan Publishing Group. Additional valuable content can be syndicated via our News RSS feed. Republish without charge. Required: Author attribution, links back to original content or www.taipanpublishinggroup.com.

{jtagstpg} {authorstpg}

Other Related Sources:

  • Conflict in the Financial Stock Market… Protect Yourself Now!
  • Why the Stock Markets Closed Lower Yesterday
  • Gold Bubble, Debt Bubble, Or Both?
  • Dollar Under Pressure as Euro Recovers

    printprofile

    The euro came off of its daily lows versus the dollar but traders may be tempted to unwind long euro positions prior to the holiday weekend. Japan was downgraded by Fitch Ratings which allowed the dollar to come off yesterday’s lows versus the yen.

    The dollar was down a day after disappointing US GDP data carried over and the euro came back from its sharp losses despite lower than expected inflationary pressures in Germany. The EUR/USD traded up at 1.4240 from 1.4133. Heavy buying has been seen in the Asian trading sessions followed by heavy selling in the US session. One may not have to look very far to identify the source of the buying as yesterday a Financial Times report cited Chinese interest in the Portuguese debt auctions from the European Financial Stability Facility. This would be a positive for the euro in the medium term. For the remainder of the day the EUR/USD could see its gains capped at 1.4280 near the upper boundary of a short term consolidation pattern due to the reluctance of traders to hold positions going into the holiday weekend. A breach below 1.4180 could take the pair lower to the 1.4130 level.

    Japan was downgraded by Fitch Ratings to negative from stable which allowed the dollar to claw back from yesterday’s declines versus the yen. The move by Fitch is not a surprise after the fiscal trouble combined with the earthquake/tsunami/nuclear reactor issues the country faces. The USD/JPY rose to 81.11 from yesterday’s weekly low of 80.83. Support comes in at 80.35 with resistance at the previous trend line off of the May low at 81.60.

    Traders will be following the release of US personal spending later today and judging from recent US data releases could come in on the low side as inflationary pressures in the States have been minute. Pending home sales may also offer a bit of late afternoon volatility as the long weekend approaches with holidays on Monday in both Britain and in the US.

    Read more forex trading news on our forex blog.

    Dollar Falls to Record Low vs Swiss Franc

    Source: ForexYard

    The Swiss franc and the Japanese yen were the strongest performers yesterday as the Greek debt crisis continues to weigh on the euro. Weak US data has pushed market players into alternative safe-haven currencies rather than the US dollar.

    Economic News

    USD – Dollar Falls to Record Low vs Swiss franc

    The dollar has begun to weaken again as traders are turning to substitutes for a safe-haven currency rather than the traditional US dollar. Weak US data has kept a negative tone in the market for dollars and yesterday was no exception. The US preliminary GDP report was released in turn with the weekly jobs report and both fell short of market forecasts. US Q1 GDP came in at 1.8% on expectations for an increase of 2.2% while new jobless claims rose 424K on forecasts of only 403K. The negative data reports initially fed into USD selling but the trend reversed itself until comments Jean-Claude Juncker shifted market sentiment in favor of the safe haven currencies.

    Following the remarks, the Swiss franc rose to a record high versus the dollar with the USD/CHF falling to a new low at 0.8541. The USD/JPY also fell sharply to 80.89 before recovering to the 81 level.

    Despite the increased tensions in Europe over the Greek debt crisis the dollar has not been a main beneficiary of the market environment, rather the Swiss franc has become the preferred method of shorting the euro. Weak US economic data has weighed on the dollar and may continue to keep the EUR/USD supported above the 1.4000 level barring any significant change in the Greek debt situation or a drastic improvement in US economic data.

    EUR – Juncker Comments Sink Euro

    Yesterday comments by the head of the euro zone finance ministers Jean-Claude Juncker shifted FX market sentiment and increased the anxiety of euro longs which helped to drop the euro back below its weekly highs. Junker commented that Greece may not achieve this year’s deficit target and therefore would be ineligible to receive its next tranche of funding from the EU/IMF negotiated bailout. Following the comments the euro fell from its intraday highs and hit a new record low versus the Swiss franc at 1.2164.

    While the proposed austerity measures are expected to be implemented, many market pundits have low expectations of Greece’s ability to reach its stated deficit reduction levels. Comments such as yesterday’s from Junker continue to weigh on the FX markets as Greece may fail to service its debt as early as July. Steps are being taken by the Greek government in the right direction as further austerity moves have been made as well as a hastened privatization program.

    The intensification of the European debt crisis as well as the politicking that continues in order to extract increased concessions from the indebted nations may well continue. A similar situation that comes to mind is the low Irish corporate tax rate, something which Irish government officials have been firm in their negations with the EU/IMF as this topic is off limits. Both Germany and France may attempt to leverage this issue should Ireland request a lower interest rate than it originally received from the bailout package.

    JPY – Yen Surges against Dollar on Safe Haven Appeal

    The yen rebounded sharply versus the dollar and yesterday following the comments from Jean-Claude Juncker. The sharp one day appreciation in the yen comes at a time when the yen was beginning to weaken versus the dollar over the past month given a broad rebound in the greenback. However, the flair up of the Greek debt crisis combined with increasingly negative US data threatens to derail any rebound in the USD/JPY. Traders will often use the Japanese yen as a safe-haven currency in times of high market stress and anxiety.

    Yesterday the USD/JPY fell to a low of 80.89 from 81.88 before recovering to 81.04. The initial support at 81.30 was easily taken out and the next support level rests at 80.30, followed by the May low at 79.60. To the upside the previous trend line off of the May low should serve as resistance as well the May high at 82.20.

    Oil – Crude Oil Prices Finish Lower but Remain above $100

    The price of spot crude oil dipped yesterday but stayed above the psychological price level of $100. Crude prices were sent lower following the US data releases that came in below market expectations. After the disappointing GDP and weekly employment numbers spot crude oil prices dipped to a low of $100.60 before climbing back to close at $100.78.

    US Q1 GDP grew a paltry 1.8% on market expectations of an increase to 2.2% while weekly unemployment claims rose to 424K on forecasts of only 403K. The noticeable downturn in US economic data has increased pressure on crude oil prices. While much of the recent demand for crude oil is driven by growth in China, the US still makes up a significant portion of crude oil consumption.

    Technicals for crude oil remain constructive with the price locked in a triangle consolidation pattern on the daily chart. Resistance comes in at $102.60 with support at $97.85 followed by $96.40.

    Technical News

    EUR/USD

    Momentum continues to shift to the downside with weekly stochastics falling sharply. Initial support was found at the 100-day moving average and the next major levels that come into play are between 1.3910 and 1.3860. The former is the 50% retracement level from the January to May move. The latter is a previous support level from mid-March. A breach here would target 1.3675 where the 200-day moving average and the 61.8% retracement levels coincide. This morning the EUR/USD took out the 1.4200 resistance level and new resistance is found at 1.4290 followed by the 50-day moving average at 1.4350.

    GBP/USD

    Cable has received a bounce this week off of the rising trend line from the May 2010 low and broke through resistance at 1.6320 from the previous trend line off of the January low. Cable now targets 1.6515. Support is found at the 200-day moving average at 1.5935 which coincides with the March low.

    USD/JPY

    Yesterday the pair made a decisive break below the short term rising trend line off of the May low and could signal a reversal to the downside. Daily stochastics are falling, indicating that short term momentum has shifted lower. Support comes in at 80.35 followed by the May low at 79.55.

    USD/CHF

    The weekly high at 0.8890 coincided with the trend line falling off the February high. Since then the value of the USD/CHF has collapsed, moving below the previously broken lower channel line from the October 2010 low and the previous low in April. Traders should be short on the pair.

    The Wild Card

    NZD/USD

    The Kiwi continues to be the strongest performer out of the G-10 currencies. Early this morning the pair broke above the resistance off of the May high only to encounter resistance at the 0.8200 level. Momentum is to the upside and as such, forex traders may see the NZD/USD test its all-time high at 0.8214.

    Forex Market Analysis provided by ForexYard.

    © 2006 by FxYard Ltd

    Disclaimer: Trading Foreign Exchange carries a high level of risk and may not be suitable for all investors. There is a possibility that you could sustain a loss of all of your investment and therefore you should not invest money that you cannot afford to lose. You should be aware of all the risks associated with Foreign Exchange trading.

    Forex Economic Calendar: May 27, 2011

    By CountingPips.com

    Economic News Releases –  All Times GMT

    German Consumer Price Index
    German Retail Sales
    09:00 Europe Economic Confidence
    12:30 United States Personal Consumption Expenditure
    12:30 United States Personal Income / Spending
    13:55 United States University of Michigan Consumer Confidence Survey
    14:00 United States Pending Home Sales

    Economic Calendar

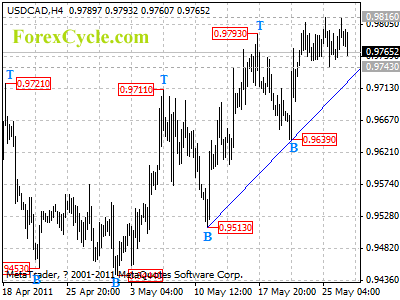
    USDCAD moved sideways

    USDCAD moved sideways in a narrow range between 0.9743 and 0.9816. The price action in the range is treated as consolidation of uptrend from 0.9444. Further rise is still possible and next next target would be at 0.9900. Support remains at the uptrend line from 0.9513 to 0.9639, only a clear break below the trend line could indicate that lengthier consolidation of uptrend is underway, then pullback to 0.9650-0.9700 area could be seen.

    usdcad

    Forex Signals

    China Expresses Interest in Portugal Bonds

    By James McKee

    Europe has been experiencing a great deal of trouble financially despite having taken austerity measures upon itself, and this has resulted in a drop of the value of the Euro against the USD on the online forex exchange. The European economy at large needs a good deal of help, and to date that help has come from European nations helping one another. The United States is not in a position to lend money and most other nations are in the same spot, it seems like everyone is broke…but not China. China is flush with cash due to a symbiotic trading relationship with the United States, and while China is no longer looking to buy as much debt from the US they are looking for other investments. Since Europe is closer to China geographically than the US it makes more sense to keep that region as stable as possible.

    It has long been known to China that the United States would rather crawl ever deeper into debt than pay off their debts to China and others. This continual cycle of debt and more debt has caused the US economy and USD to slump against those else where in the world. Such a scenario has remained on the horizon for the United States for some time now and in all likelihood there is going to be no shortage of excuses; however, China it seems has heard enough. The voiced interest on the part of China in buying European debt was enough to cause the Euro to bounce back against the US dollar. While this is all well and good for Europe a shift in China’s economic interests could spell out serious trouble for the USD in the short and long term.

    This all spells out trouble overall for the USD on the online forex exchange and more than likely there is going to be a grab for Chinese money. In order to begin paying off its debts the United States needs to make a TRUE effort to do well by its investors and walk the walk. The time for talking has been over for a long time now and austerity measures are the least of what the United States must do to make things right with China and other investors…there has to be change and it must come now. China and the rest of the world have heard enough excuses and are beginning to turn their focus elsewhere.

    About the Author

    Author is a Forex trader and financial analyst residing in Denver, Colorado. To stay up to date on all the latest developments in the financial world and beyond be sure to check out the online forex trading regularly.

    What Does a Fractal Look Like?

    And What Does It Have to Do with the Stock Market?

    By Elliott Wave International

    If the word ‘fractal’ comes up at all in conversation, that conversation is probably being held in a mathematics department. However, anyone who is interested in the Wave Principle and how it applies to the stock market may have stumbled across the phrase “robust fractal.” If you want to know more about what it means in that context, here’s an excerpt from Elliott Wave International’s primer on fractals that explains the connection.

    * * * * *

    Excerpted from The Human Social Experience Forms a Fractal
    by Robert R. Prechter

    In the 1930s, Ralph Nelson Elliott discovered that aggregate stock market prices trend and reverse in recognizable patterns. In a series of books and articles published from 1938 to 1946, he described the stock market as a fractal. A fractal is an object that is similarly shaped at different scales.

    Although Elliott came to his conclusions fifty years before the new science of fractals blossomed, he took a step that current observers of natural processes have yet to take. He explained not only that the progress of the market was fractal in nature but discovered and described the component patterns. The patterns that Elliott discerned are repetitive in form but not necessarily in time or amplitude. Elliott isolated and defined a number of patterns, or “waves,” that recur in market price data. He named and illustrated the patterns. He then described how they link together to form larger versions of themselves, how they in turn link to form the same patterns at the next larger size, and so on, producing a structured progression. He called this phenomenon The Wave Principle….

    The Stock Market as a Robust Fractal
    A classic example of a self-identical fractal is nested squares. One square is surrounded by eight squares of the same size, which forms a larger square, which is surrounded by eight squares of that larger size, and so on.

    A classic example of an indefinite fractal is the line that delineates a seacoast. When viewed from space, a seacoast has a certain irregularity of contour. If we were to drop to ten miles above the earth, we would see only a portion of the seacoast, but the irregularity of contour of that portion would resemble that of the whole. From a hundred feet up in a balloon, the same thing would be true.

    Photo of Madeira coastline, near Sao Jorge, by Plane Person (source: Wikimedia Commons)
    Scientists today recognize financial markets’ price records as fractals, but they presume them to be of the indefinite variety. Elliott undertook a meticulous investigation of financial market behavior and found something different. He described the record of stock market prices as a specifically patterned fractal yet with variations in its quantitative expression. I call this type of fractal, which has properties of both self-identical and indefinite fractals, a robust fractal. Robust fractals permeate life forms. Trees, for example, are branching robust fractals, as are animals, circulatory systems, bronchial systems and nervous systems. The stock market record belongs in the category of life forms since it is a product of human social interaction.

    How Is the Stock Market Patterned?

    Idealized Wave Development and Subdivisions

    Figure 1 shows Elliott’s idea of how the stock market is patterned. If you study this depiction, you will see that each component, or “wave,” within the overall structure subdivides in a specific way by one simple rule: If the wave is heading in the same direction as the wave of one larger degree, then it subdivides into five waves. If the wave is heading in the opposite direction as the wave of one larger degree, then it subdivides into three waves (or a variation). These are called motive and corrective waves, respectively. Each of these waves adheres to specific traits and tendencies of construction, as described in Elliott Wave Principle (1978).

    Waves subdivide this way down to the smallest observable scale, and the entire process continues to develop larger and larger waves as time progresses. Each wave’s degree may be identified numerically by relative size on a sort of social Richter scale.

    Want to Know More About Fractals and the Stock Market? Then read the whole special report, called “The Human Social Experience Forms a Fractal.” It’s free of charge, so long as you are a member of Club EWI, which gives you access to many free reports that explain Elliott wave analysis and the Wave Principle.

    This article was syndicated by Elliott Wave International and was originally published under the headline What Does a Fractal Look Like?. EWI is the world’s largest market forecasting firm. Its staff of full-time analysts led by Chartered Market Technician Robert Prechter provides 24-hour-a-day market analysis to institutional and private investors around the world.