Sterling Volatile after Moody’s Comments, Yen on the Rise

printprofile

The dollar was gaining versus the majors as Europe absorbed Ben Bernanke’s comments from yesterday. The Aussie dollar is the weakest against the USD with sterling not too far behind. A lack of data releases on the economic calendar today will have traders keying in on the upcoming central bank meetings, the most heavily scrutinized will be that of the ECB.

Sterling was down on the day against the dollar after the wires showed a Moody’s official saying Britain’s top credit rating could come under review if economic growth continues to deteriorate and if the fiscal program goals fall short. While this isn’t much different from the rating agency’s previous stance that was proclaimed in March, the sharp drop in cable shows how sensitive the forex trading market has become to the rating agencies moves. More weakness could be in store for cable as a break of the rising support line at 1.6350 could spur losses to the June low at 1.6280.

The Australian dollar is weaker across the board a day after the Reserve Bank of Australia held its base interest rate at the current level and appeared less hawkish than expected. AUD/USD support is seen at 1.0585 with the potential for further declines back to the May low at 1.0440.

Intervention talk is floating through the wires as the USD/JPY made its way below the 80 yen mark in overnight trade. The pair is trading at its lowest level since early May but volatility versus both the dollar and in the crosses is far from its pre-intervention levels since mid-March.

The euro is off both against the dollar and in the crosses. German economic data was not supportive with a smaller than expected trade balance and weaker than forecasted industrial production numbers. Euro pairs may see a bit more volatility as tomorrow’s ECB meeting nears. Market expectations are for Trichet to chime in with the phrase, “strong vigilance”, the market’s code for an expected rate hike in the July ECB meeting. Odds are in favor of this happening, though there will be plenty of contrarians out there should Trichet leave those key words out of his speech tomorrow. While market positioning is not as stretched in favor of the euro as it was in May, a slide in the EUR/USD could extend to 1.4410-20, a 38% retracement from the May to June move higher. The 50-day moving average also hovers in this area.

Read more forex trading news on our forex blog.

Bernanke Comments May Shift Focus to Europe as Japan Posts Bullish Data

Source: ForexYard

Market news out of Japan this morning was largely positive for the island economy, with the country’s Current Account growing to 0.55T and its M2 money supply maintaining its present rate of growth. The yen may seem poised to make gains today, but investors appear likely to shift towards riskier assets following Bernanke’s comments on Tuesday.

Economic News

USD – Bernanke Comments Drop-Kick USD’s Recent Gains

The US dollar experienced strongly bearish results yesterday as traders began to shift away from the greenback following comments by Federal Reserve Board Chairman Ben Bernanke. Speaking at the International Monetary conference in Atlanta, GA, yesterday, the Fed chief hinted at holding US interest rates at all time lows for even longer than was originally thought.

With Friday’s Non-Farm Payroll (NFP) figure revealing surprise stagnation in the US employment sector, traders appeared more reluctant to go into the greenback in order to stave off further losses in their portfolios. Bernanke’s comments, coming on the coattails of Friday’s report, resulted in a sharp kick to USD values gained since mid-Monday, however.

As for today, dollar traders will be licking their wounds while the American economy stays largely absent from the economic calendar. The euro zone is set to release several figures and the Pacific economies of Australia, New Zealand and Japan are in line for one of their most significant news days in weeks. With increased USD aversion since last Friday, traders appear to be anticipating a continuation of the USD’s recent bearishness throughout this week.

EUR – EUR Bullish as Investors Run from USD on Bernanke Statements

The euro rose versus the US dollar this morning, with the pair’s price reaching a one-month high near 1.4670. Soft data out of the American economy last week forced a reevaluation by many investors who went long on the USD following the European Central Bank’s (ECB) cloudy rate statement from a month back, and several grumblings about Greece’s debt woes.

What little data was published out of the euro zone yesterday highlighted better growth than was expected. The difference in fundamental data from the US and Europe has generated a heightened intrigue in the comparative interest rates as risk sentiment gets shifted. Fed Chairman Bernanke’s statements yesterday have many investors turning to the higher yielding economies of Europe in expectation of record low interest rates in the US for longer than was initially forecast.

As for today, the euro zone will be publishing several minor data sets concerning the region’s trade and government budgets. Most investors are turning their attention on the American economy after yesterday’s comments and Friday’s dismal NFP reading, and there appears to be a good chance that dollar bears will continue to push the EUR higher as the day wears on.

JPY – Japan Market Fundamentals Positive, Yen Mixed

The Japanese yen (JPY) has been trading with largely positive results since Friday as investors turn their focus towards news out of the United States. Fed Chairman Ben Bernanke’s remarks yesterday about US interest rates has many traders buying back into the yen as a more beneficial safe-haven in times of risk.

The JPY was seen trading somewhat mixed this morning, however, holding steady gains versus the USD, but faltering mildly against the EUR and GBP. Market news out of Japan this morning was largely positive for the island economy, with the country’s Current Account growing to 0.55T and its M2 money supply maintaining its present rate of growth. The yen may seem poised to make gains today, but investors appear likely to shift towards riskier assets following Bernanke’s comments on Tuesday.

Oil – Oil Prices Find Support at $98

The price of Crude Oil ended Tuesday mildly positive after finding support just below the $98 price mark. The result has been a steady price movement in oil prices these past several days with lows near $98 and highs of $100 a barrel.

Recent events have made speculating about oil prices more difficult. The plummeting value of the US dollar since Friday should have helped lift oil prices, but the commodity fell for the third consecutive day as of this morning. Rising stockpiles in the United States, reported Thursday, may have helped fuel the shift away from oil as rising inventory tends to suppress price hikes. As for the rest of today, oil prices also appear flat, with technical support targets near $98.50 a barrel possibly coming into view, and a target near $100 on the upside if the black gold is able to find buyers.

Technical News

EUR/USD

The current rally has helped the pair climb above the 61.8% Fibonacci retracement level from the May downtrend at 1.4570. While monthly stochastics are beginning to roll over, both the weekly and the daily stochastics are moving sharply higher. The pair could continue to rise where it may encounter resistance off of the previous trend line from the January to May rally which comes in at 1.4750. This level has further significance as it coincides with the late April/early May lows. Further strength would test the May high at 1.4940 while any pullback could find support at 1.4450 from Friday’s low, followed by 1.4310.

GBP/USD

Sterling is showing a few signs of weakness versus the dollar as daily stochastics are declining and a failed attempt to close the week above the 1.6515 resistance level. A move higher would then test the April high at 1.6745 followed by the 2009 high at 1.0755. To the downside the 20-day moving average may prove to be supportive at 1.6305 as well as the trend line rising from the May 2010 low which comes in at 1.6150. A breach here would expose the May 2011 low at 1.6055.

USD/JPY

Yen strength has reemerged and the pair looks to test its post-intervention lows from early May at 79.56. A break of this level exposes the pre-intervention low at 76.11 as the charts are absent of any significant support levels. To the upside, 81.75 should see some resistance followed by the May high at 82.15.

USD/CHF

A new week and a new high for the Swiss franc as the USD/CHF traded as low as 0.8326. Falling stochastics on the weekly chart point to further potential declines in the pair. Traders may find opportunities to enter into the downtrend on a pullback in the pair. Support is located at the May low of 0.8550 followed by the falling trend line off of the February high at 0.8750.

The Wild Card

Oil

Spot crude oil prices have been consolidating in a triangle chart pattern for the past month and are currently testing the lower leg of the pattern at $97.25. A breach here and the commodity perhaps would find support at $96.30 followed by the early May low at $94.70. Beyond this level the next support is located at the January highs near $93.00. Forex traders will want to wait for confirmation of a move below the lower leg of the triangle before initiating a potential short position.

Forex Market Analysis provided by ForexYard.

© 2006 by FxYard Ltd

Disclaimer: Trading Foreign Exchange carries a high level of risk and may not be suitable for all investors. There is a possibility that you could sustain a loss of all of your investment and therefore you should not invest money that you cannot afford to lose. You should be aware of all the risks associated with Foreign Exchange trading.

G-10 and EM Central Bank Meetings

printprofile

The greenback was once again on its back foot following Ben Bernake’s speech yesterday which stressed the Fed’s commitment to keep inflation low as well as a loose US monetary policy in the mid-term. Unsurprisingly the Fed chief failed to hint at a possible QEIII which put the S&P 500 back in the red for the fifth consecutive trading session and had the USD trading on its lows at the NY close. The decline in both equities and the US dollar highlights the pullback in risk aversion by global portfolio managers following the disappointing string of US economic data. For the remainder of the week traders will shift their attention to the glut of central bank meetings both in the G-10 (NZD, GBP, EUR) and in the emerging markets (BRL, PLN, IDR, KRW).

Today’s Economic Data Releases:

EUR – German Industrial Production – 10:00 GMT
Expectations: 0.1%. Previous: 0.7%.
Earlier today the German trade balance fell back from previous levels though exports rose a healthy 13.4% from April 2010. As such a bit of a slowdown could be seen from the industrial numbers today. However, market participants may be tentative leading up to tomorrow’s ECB policy meeting. EUR/USD resistance comes in near 1.4760 off of the late April/early May lows and the previous trend line from the January to May move. Support is found at 1.4450.

Oil – Crude Oil Inventories – 14:30 GMT
Expectations: -1.4M. Previous: 2.9M.
The disappointing US economic data continues to weigh on spot crude oil prices as the commodity has been consolidating in a triangle chart pattern for the past month and are currently testing the lower leg of the pattern at $97.25. A breach here and the commodity perhaps would find support at $96.30 followed by the early May low at $94.70. Beyond this level the next support is located at the January highs near $93.00.

USD – Beige Book – 18:00 GMT
On the heels of last week’s disappointing non-farm payrolls data economists will be looking for further signs of a slowdown in the various regions as reported by the Federal Reserve. This would likely lead to further dollar selling.

NZD – Official Cash Rate and RBNZ Rate Statement – 21:00 GMT
Expectations: 2.50%. Previous: 2.50%.
Consensus forecasts are for the Reserve Bank of New Zealand to keep interest rates at their current levels as to continue to aid the economic recovery from two earlier earthquakes. However, economists are expecting the RBNZ to convey a more hawkish policy stance given the rising inflation expectations in the business community and a strong trade surplus. A break of the resistance 0.8260 and the NZD/USD may have the scope to 0.8500.

Read more forex trading news on our forex blog.

New Zealand Rate Statement on Tap Today

printprofile

The Reserve Bank of New Zealand (RBNZ) will be publishing its decision on short-term interest rates later in today’s trading session. The report and subsequent rate statement are scheduled to be announced around 22:00 GMT Wednesday.

Interest rates have gained prominence in many investment circles lately with attention shifting towards the differential between the United States and Europe. What have gone mildly unnoticed are the shifts in sentiment towards rate hikes in the Pacific economies since early March. Many analysts at the beginning of the year were expecting hawkish movement by such Pacific giants as Australia and New Zealand, yet the mood appears to have shifted to hesitation and doubt. Today’s rate statement may shed light on why this may be and is worth paying attention to.

Read more forex trading news on our forex blog.

EURUSD stays above trend line

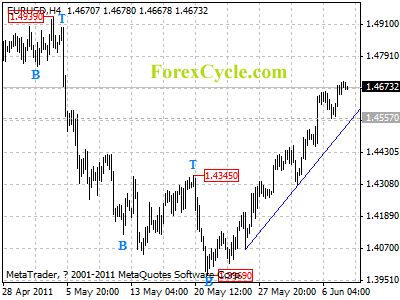
EURUSD stays above the rising trend line on 4-hour chart, and remains in uptrend from 1.3969. Key support is now at 1.4557, as long as this level holds, uptrend could be expected to continue, and next target would be at 1.4750 area. However, a breakdown below 1.4557 will indicate that a cycle top has been formed, and the rise from 1.3969 has completed, then the following downward move could bring price back towards 1.3500.

eurusd

Forex Signals

The Trend Is Your Friend: How Moving Averages Can Improve Your Market Analysis

By Elliott Wave International

Many traders and investors use technical indicators to support their analysis. One of the most popular and reliable also happens to be an indicator that has been around for years and years — moving averages.

A moving average is simply the average value of data over a specific time period. Analysts use it to figure out whether the price of a stock or a commodity is trending up or down. It effectively “smooths out” the daily fluctuations to provide a more objective way to view a market.

Although simple to construct, moving averages are dynamic tools, because you can choose which data points and time periods to use to build them. For instance, you can choose to use the open, high, low, close or midpoint of a trading range and then study that moving average over a time period, from tick data to monthly price data or longer.

Moving Averages can help you identify the trend in a market, which is important since we all know that the trend is your friend. Yet certain moving averages can serve as support or resistance, and also alert you to trading opportunities.

This excerpt from EWI Senior Analyst Jeffrey Kennedy’s free eBook, How You Can Find High-Probability Trading Opportunities Using Moving Averages, shows how a popular moving average setting identified trading opportunities in the stock of Johnson & Johnson. Download the full 10-page eBook here.

A popular moving average setting that many people work with is the 13- and the 26-period moving averages in tandem. The figure below shows a crossover system, using a 13-week and a 26-week simple moving average of the close on a 2004 stock chart of Johnson & Johnson. Obviously, the number 26 is two times 13.

During this four-year period, the range in this stock was a little over $20.00, which is not much price appreciation. This dual moving average system worked well in a relatively bad market by identifying a number of buyside and sellside trading opportunities.

Learn to apply Moving Averages to your trading and investing by downloading Jeffrey Kennedy’s free 10-page eBook. Here’s what you’ll learn:

  • How to apply the three most popular moving average techniques.
  • How to decide which moving average parameters are best for the markets and time frames you trade.
  • How to avoid several common but dangerous myths about moving averages.

Download How You Can Find High-Probability Trading Opportunities Using Moving Averages now.

This article was syndicated by Elliott Wave International and was originally published under the headline The Trend Is Your Friend: How Moving Averages Can Improve Your Market Analysis. EWI is the world’s largest market forecasting firm. Its staff of full-time analysts led by Chartered Market Technician Robert Prechter provides 24-hour-a-day market analysis to institutional and private investors around the world.

Christopher Vecchio from DailyFx talks currency themes, USD, Yen and Loonie in Forex Interview

By Zac, CountingPips.com

Today, I am pleased to share a forex interview with currency analyst Christopher Vecchio from DailyFx.com on the latest currency market major events and trends. Christopher studies fundamental analysis of the foreign exchange markets by examining the interrelationship between geopolitical events, macroeconomic trends, and finance while also incorporating technical analysis into his research in order paint the most complete picture of what is occurring across various asset classes in the short-term and medium-term.

What do you think at the current time is the main theme (or themes) in the Forex markets?

“Cautious optimism” would be current theme for not just the Forex market, but financial markets across the globe. The news last week that the European Troika – the European Union, the European Central Bank, and the International Monetary Fund – would extend another tranche to Greece certainly lifted investor sentiment in regards to the sovereign debt situation in Europe. I think that this is most easily discerned due to the fact that Greek yields have fallen fairly consistently since May 23. The trend of “cautious optimism” is not just denoted by the drop in yields, however: an equal-weighted basket of currencies, with the Australian Dollar, the Canadian Dollar, and the New Zealand Dollar (collectively known as the commodity currencies) in a long position against an equal-weighted basket of the Japanese Yen, the Swiss Franc, and the U.S. Dollar (collectively known as the safe haven currencies) shows that the markets are moving into the safe haven currencies. While the index has oscillated sharply since April 26 (the index’s highest point in 2011), it is lower now, and has been trending lower since last Wednesday. This suggests that while there have been brief intraday moments of optimism among traders, concern still remains. The near-term trend, at least for the next three months, is a flight to safety, and until there is some substantial proof that the two biggest weights on investor sentiment change – a struggling recovery in the United States coupled with a debt limit issue, as well as the sovereign debt crisis in Europe – traders will have to tread carefully.

There are a lot of important economic news releases scheduled for this week including interest rate decisions, GDP reports and employment releases as well as the Greece sovereign debt situation in Europe. Is there any one or two events you feel will have the biggest impact on the FX markets?

The European Central Bank rate decision on Thursday represents the most important event, in my opinion, this week. While there are three other central bank interest rate decisions, the market is clearly eager to hear what President Jean-Claude Trichet has to say at his monthly press conference following the meeting. The chance that the European Central Bank raises rates at their meeting this week is miniscule: in fact, the Credit Suisse Overnight Index Swaps show a -1.0 percent chance of a 25.0-basis point rate hike at the meeting on Thursday. Still, there has been much posturing by European officials for a hike in the near future, perhaps as soon as July. Jurgen Stark, a member of the ECB, called last week for a rate hike as soon as at Thursday, for example. That being said, President Trichet’s rhetoric will be key. However, a rate hike could stir further trouble for Greece, and certainly for other periphery countries that are facing

The Nonfarm Payroll Report released on Friday was a big disappointment as job creation came in much less than expected. Do you feel this most likely further dampens the dollar’s prospects against the major currencies?

No, in fact, I feel the exact opposite. A strong recovery in the United States boosts the market’s appetite for risk, and accordingly, a shift into riskier assets, such as other currencies and equities. However, the softer-than-expected figure – the actual number came in lower than the lowest estimate, according to survey figures – has spurred another move to risk-aversion, which, as the U.S. Dollar currently holds the title for the world’s reserve currency, is good for the Greenback. This of course begs the question of a third round of quantitative easing, but I think that’s an unlikely scenario to begin with; Federal Reserve policymakers have been lambasted for the ‘monetization’ of U.S. debt, and the purchases of U.S. Treasuries has added onto fears of another breach of the debt ceiling and thus inability to meet current obligations.

Looking out over the medium to long-term, do you see anything that could be a catalyst for change in sentiment of the dollar?

Only a third round of quantitative easing would further debase the Dollar. The general sentiment is that when Federal Reserve stops their purchases at the end of June, there could be a major rally in the Greenback, a scenario I expect. While the Federal Reserve will likely keep rates on hold for an ‘extended period,’ the continued monetization of debt is an unlikely scenario, in the near-term. Of course, if asset prices collapse, unemployment soars, and growth grinds to a complete halt, by the Fall, there would likely be talk once more of quantitative easing. Until more easing is announced, I believe the horizon for the Greenback is bullish.

The USD/JPY is back trading near the 80.00 level. After the earthquake / tsunami, we saw the Bank of Japan with other central banks intervene in the currency markets to sell the yen. Do you feel that we might likely see another intervention to boost the dollar versus the yen?

At this point in time, no, it is unlikely that there would be another intervention. While a weaker Yen is certainly beneficial to the Japanese economy – foreigners would have more purchasing power, and in theory, would purchase more Japanese goods – the past two interventions – the one in March following the earthquake, and the one in September as the USD/JPY pair breached the 83.00 exchange rate – did not ultimately work; the Yen is stronger against the Dollar in the weeks following such moves. Furthermore, I believe that given the tremendous problems that are arising elsewhere around the globe – debt worries in Europe and the United States, plus continued conflict in the Middle East and North Africa region – if the market dictates risk-aversion, the Yen will appreciate over the long-run, a trend we are in the midst of experiencing. A slew of strong data out of Asia, Europe, and North America would allow an intervention, but right now, with so many other problems occurring elsewhere, central banks are going to be more concerned with domestic issues. Then again, the actions of some of the world’s largest central banks have not been entirely rational, so an intervention could be an automated process once the USD/JPY pair exchange rate breaches a certain level.

The Canadian dollar has been especially weak over the past month or so against the other major currencies. Canada’s employment report will be released this week with early estimates of a 20,000 gain in jobs. Do you feel we could see a turnaround in the loonies fortunes in the next weeks to months?

While I am particularly bullish on the Loonie – the Canadian economy is the only advanced economy to have regained all of the jobs it lost during the recession, and thus the only economy that has created new jobs – the fortunes of the Canadian economy are directly tied to the fortunes of the American economy. This is most easily confirmed by the fact that the Loonie depreciated the most since the ADP jobs report last Wednesday. The fear is that if American growth slows, there will be dampened demand for oil – the number one exporter of oil to the United States is Canada. While in any other scenario I would project that adding jobs to the economy would likely boost the Loonie, unfortunately, the Loonie needs to wait and see what is happening in the United States before any further advances or declines occur. Positive data from the United States will translate into a stronger Loonie, ultimately.

Thank you Christopher for taking the time for participating in this week’s forex interview. To read Christopher’s latest currency analysis and trading strategies you can visit DailyFx.com.

Are SPY Options Signaling a Market Rally?

jared_levy150x150-2Options give an experienced trader the ability to make money in any market — no matter which way it’s headed. But did you know they can also act as a warning signal or a buy signal? Options can tell you when the market is about to go haywire, and they can also tell you when the market (or a stock) is ready for a rally.

To understand how, we need to take a step back for a second and look at exactly what an option is and what its price represents.

An option is a contract that gives an investor the right to buy or sell a stock at a certain price (called a “strike price”) by a certain date. These investments give traders a lot of flexibility that stock investors don’t have. Most investors who buy stocks can only make money if share prices climb. Options investors can make money if the stock moves in either direction by investing in the right kind of option.

Traders buy “call” options when they think the underlying stock is going to rise in price. If you think Exxon Mobil’s (XOM:NYSE) share price is going to climb from $80 to $85, you might want to buy call options. Call options increase in value when a stock’s share price climbs.

Traders buy “put” options when they think the underlying stock is going to fall in price. If you think Exxon Mobil’s share price is going to fall from $80 to $75, you might want to buy put options. Put options increase in value when a stock’s share price falls.

This last bit is how options traders make money when the market is falling.

Now that we have a basic understanding of what options are, let’s talk about how options are priced.

The Five Components That Influence an Option’s Price

Stock Price — Obviously the price of the underlying asset (stock, index, ETF, etc.) will have an effect on the price of an option.

Time Till Expiration — All options have an expiration date. The longer an option has until its expiration, the more expensive it is. You’re basically paying for more time for the underlying stock to move. The amount of time until an option expires will have a direct effect on the price.

Dividends — Believe it or not, dividends also influence option value. Dividends lower the price of calls and raise the price of puts. (When you buy an option, all the dividend math is already figured in.)

Interest — Interest rates have a fairly minor effect on most options, but they do influence option prices. Higher interest rates will increase call values and lower put values.

Volatility — If there is a high demand for an option or if a stock is extremely erratic, “implied” volatility will be higher and the option more expensive and vice versa. Here’s what that means:

  • The implied volatility is related to events and movements in the stock. It is always expressed in percentage terms.

  • If an option’s volatility is out of line or looks abnormal, it could spell trouble on the horizon.

  • It can also tell us things that the stock charts or news can’t…

When the Natural Order Is Disturbed

The fact is that most of the investment community and media know little or nothing about options. They say the Volatility Index (VIX) is telling us whether the market is overbought or oversold or if investors are scared or confident. The truth is that the VIX alone can’t even come close to predicting these things without considering other factors.

There is an innate balance and relationship between a stock and its options as well as the puts and calls themselves.

What I am about to show you is what we professionals use to spot impending danger or safe opportunities. When there is a severe disparity between different options volatility, professional traders can use it to their advantage.

One of the simplest uses is to gauge real market sentiment.

(Investing doesn’t have to be complicated. Sign up for Smart Investing Daily and let me and my fellow editor Sara Nunnally simplify the stock market for you with our easy-to-understand investment articles.)

Meet “SKEW”

Without turning this into a math lesson or boring you all to death, I’ll keep this simple and straight forward.

Look at the chart below. This is an options chain, or a list of all the different options you can buy on a specific stock or ETF. This options chain is for the S&P 500 Index.

You will see two options highlighted. One is a put (highlighted in red) and the other is a call (highlighted in green), both of which have strike prices exactly $25 away from the current price of the stock. Logically, their prices should be the same, but…

Notice how much cheaper the call option is (IN GREEN) than the put option (IN RED). Why the huge difference in price?

S&P 500 Index
View larger chart

I’ll give you a hint…

Note the implied volatility of each (it’s the percentage number); the put is 18.32% and the call is 14.62%. This difference is called “skew” or “vertical skew” to be more precise.

Basically skew is the difference in volatility from option to option. We option traders find all sorts of skew patterns. We even have cute names like “volatility smile” to describe them…

It’s somewhat normal to see call volatility cheaper than put volatility. That’s exactly what we’re seeing in this options chain.

This is because most investors tend to buy stock, so they will more often sell covered calls (the most popular option strategy) or buy puts against their long stock to protect themselves.

(Selling covered calls just means that you’re selling call options and you have enough shares of the actual stock to be able to sell to the options buyer if they decide to “cash in” their options contract for stock.)

Professional option traders monitor the volatility skew and look for trends or abnormalities.

I saw something very interesting happening in SPDR S&P 500 ETF (SPY:NYSE) over the past couple of days, which flies in the face of what you may think about market direction.

Not What You Would Think

OK, so if everyone thought the market was going to hell in a handbasket, you would expect everyone to be selling calls and buying puts. We’ve said this is how investors protect their stock investments. This action should be sending call prices lower and put prices through the roof. But that is NOT what is happening in the SPY!

Take a look at the chart below that tracks June options for the SPY. What you will see is the black line (Puts) has been going DOWN over the past couple days and the green line (Calls) are going UP! This tells me that investors think the S&P 500 is going to go up… at least until June option expiration (17th).

Courtesy of OptionsHouse.com
Options House Chart
View larger chart

This is a very different view from what we’ve been hearing from the mainstream financial media (many are talking about a meltdown). But sometimes you have to look at the market through a different lens to get the clearer picture.

Here’s another tip: I always try to back up a market opinion with several indicators to make sure that I am on the right track. Even though it looks like the market is melting down, look for some support around the 1,275 level. That’s just above the 200-day moving average — a point that tends to provide a bounce in prices.

Also, the 1,250 looks to be the absolute bottom that option traders may be looking at until June expiration day. That’s where the S&P 500 bottomed out in mid-March. It might not be the best news, but at least you have an idea of what the “smart money” is thinking.

Editor’s Note: Jared is the editor of WaveStrength Options Weekly. His method of options trading gives readers low-risk, high-success opportunities. Whether you’re a seasoned options trader, or you’re new to the game, Jared’s straightforward and clear analysis will give you the confidence to step into each options trade well-armed and ready to profit.

You can learn more about how Jared’s trading strategy works by visiting this link.

——————————————————-

These are scary times. Nuclear disasters, fighting in the Mid-East, a constant threat of collapse in Europe and, let’s not forget, America’s own economic struggle. 2011 will go down as one of the most violent and volatile years on record.

But in every crisis there is an opportunity. As we’ve shown over the past 20 years, there are winners and there are losers.

Later this year, I will call the Taipan team together for our annual summit in Las Vegas. Our mission this year is simple… survival. We will bring together 11 of the industry’s brightest, most well-connected investors with a single purpose in mind — to show you how to use the coming crisis to your advantage.

To get things started, on June 20 we will host the first of our survival-themed webinars. This one focuses on using Washington’s antics to your advantage. To join this one-of-a-kind event, follow this link.

——————————————————-

Article brought to you by Taipan Publishing Group. Additional valuable content can be syndicated via our News RSS feed. Republish without charge. Required: Author attribution, links back to original content or www.taipanpublishinggroup.com.

{jtagstpg} {authorstpg}

Other Related Sources:

  • Get Options Trading Secrets From ‘Behind the Curtain’
  • Investors Beware — The VIX Options Are a Lie
  • S&P 500 Declines Five Consecutive Weeks: Negative Sign for Stocks?
  • Three Warning Signs of a Dangerous Dividend

    By Carla Pasterna, DividendOpportunities.com

    Three Warning Signs of a Dangerous Dividend

    One fund is paying a tempting 11% yield. Another offers 8%. Which one should you reach for?

    To answer that, you need to ask the right question.

    The question is not, “How high is the yield?” Instead, it’s “How secure is the dividend?” Dividend safety is far more important to total returns than yield size. I touched on this idea a few weeks ago.

    World Wrestling Entertainment (NYSE: WWE) chopped its dividend by two-thirds in late April. The shares fell 9% in a day.

    Alpine Total Dynamic Dividend Fund (NYSE: AOD) cut its monthly payments in half from $0.12 per share to $0.055 back in June 2010. The shares fell more than 13%.

    The good news is that it is fairly easy to assess how secure payouts are — especially for income-focused funds. Here are the three warning signs to watch:

    Return of capital
    Undistributed net investment income (UNII)
    Payout ratio

    Return of capital — When a fund makes regular payments consisting of “return of capital,” it can be a signal of a dangerous dividend. Often, these payments are simply returns of an investors’ own capital or shareholders’ equity.

    Funds supplement their distributions with returns of capital when investment income or gains aren’t enough to maintain the dividend. In effect, the fund dips into its capital pool to keep up the dividend.

    Undistributed net investment income (UNII) — Closed-end funds are required to distribute at least 90% of their taxable income each year to avoid paying corporate taxes on what’s distributed. They also must pass along at least 98% of their income and net capital gains each year to avoid paying a 4% excise tax on what’s distributed.

    However, some managers elect not to distribute all income earned during the year and instead pay the 4% excise tax on this income. What’s lost to taxes is gained in asset value, and the UNII can be used to supplement future distributions as needed.

    So UNII secures the dividend and bodes well for dividend increases.

    In contrast, over-distributed net investment income, when a fund distributes more than it made in a year, may be a sign of dividend danger. The statement of assets and liabilities tells you whether the fund has undistributed or over-distributed income.

    Payout ratio — Closed-end fund distributions typically can come from three sources: return of capital, capital gains, and investment income. Of these, investment income from dividends and interest on portfolio holdings is generally the most predictable as they are issued at regular intervals.

    The payout ratio provides a handy measure of how much of the fund’s distribution comes from investment income, net of expenses. The ratio provides a quick gauge of how secured the yield is by the fund’s current portfolio holdings. So if a find earns $1.00 per share in net investment income and pays out $0.90, you can quickly see a fund can cover its payments without dipping into its capital or depending on stock gains.

    Good Investing!


    Carla Pasternak’s Dividend Opportunities

    DividendOpportunities.com