Affiliate Marketing In The Forex Niche – The Road To Success

By James Woolley

Many people, including myself, have discovered that the forex niche is one of the most profitable ones to be in from an affiliate marketing point of view. So with that in mind, I want to discuss 5 steps to becoming a successful forex affiliate.

1. Learn about forex trading.

As incredible as it may seem, there are lots of affiliate marketers who enter this niche expecting to make vast profits promoting various different products, whilst only having a very limited knowledge of forex trading. The reality is that most people are not stupid. If you are trying to sell a certain product or service, people will soon realize that you don’t really know what you are talking about. So you should first of all learn as much as you can about how the currency markets actually work.

2. Create a website or blog.

If you are looking to make lots of sales, then you need to have a presence online and ideally come across as some kind of authority (which follows on from my last point). If people respect you and your opinions, then they will be more inclined to buy the products you recommend, and you will therefore be able to generate more sales.

3. Drive traffic and build an email list.

You could have the best website in the world, but it will all be in vain if it is not getting any traffic. So you need to be utilizing every avenue to get as much traffic as you can, whether it’s from articles, press releases, search engine optimization, blog commenting or social bookmarking, for instance. Then you need to capitalize on this traffic by building an email list because email marketing is generally where the big money is made.

4. Join affiliate programs.

Once you have a website that’s getting traffic and an accompanying email list, you can then start finding good quality forex products and services to promote. It’s easy to be tempted by the big ticket items, but you can make equally good profits from some of the cheaper products on the market if they are good quality.

5. Write product reviews and promote products.

Once you have signed up to one or two affiliate programs you can then start actively promoting them. Ideally you want to check out the product beforehand because then you can write an honest review, which will help you generate even more sales.

The point is that it is not that difficult to start making decent profits as an affiliate in the forex trading niche. As long as you follow these basic steps, you should be generating sales in no time at all.

About the Author

James Woolley is a full time trader and an active affiliate marketer. Click here to read his forex affiliate program reviews and to learn more about forex trading.

Weekly Technical FX Preview – Dollar Strength Could Continue Versus Euro and Sterling

printprofile

EUR/USD

A three week rally was met with a failure of the pair to breach 1.4700, a level not far from the previous trend line which opened the door for a significant pullback that retraced 50% of the late May to early June gains. The week’s declines ended at the 20-day moving average at 1.4330 and will serve as initial support. Falling daily stochastics suggest the move lower may have scope to continue where the pair may find resistance at 1.4250, a level that coincides with the 61% retracement and the rising trend line from the May low. A breach here and the pair will test the 100-day moving average followed by the May low at 1.3970. To the upside, resistance will likely come in 1.4570 followed by 1.4700.

EURUSD_Daily

GBP/USD

The weekly candlestick suggests further declines may be in store as last week’s candlestick ended on a shaven bottom, indicating momentum is moving to the downside. A confirmation will be needed from this week’s trade to confirm the bearish pattern. In the meanwhile the move lower finished at the 38% retracement level of the December to April move and is quickly approaching the trend line off the May 2010 low at 1.6180. The pair could receive a bounce from this level, as was the case in late May. Resistance is located at 1.6400 and 1.6460, and 1.6550. Should the pair not receive a bounce at the trend line declines could mount to 1.6060 and the April low at 1.5935.

GBPUSD_Weekly

USD/JPY

The yen was relatively unchanged from the previous week after an attempt to breach below the 80 yen level was only briefly successful before the pair was bid higher. While most oscillators remain in neutral territory, the pair continues to trade lower with resistance at the falling trend line from April high which comes in near the 20-day moving average at 81.00. This level may offer traders a better price to enter short. Further resistance is located at 81.75 from the May 31st high followed by 82.25 of the May 19th high. Support comes in at the May low of 79.50 followed by the all-time low at 76.11.

USDJPY_Daily

USD/CHF

The pair is testing a short term resistance level at 0.8450 and a breach here would expose the resistance at 0.8855 which lies just below the 20-day moving average. A rise to this price may offer traders better levels at which to enter short. Above these levels rests the falling trend line from the mid-February high which comes in at 0.8720. Support is found at the all-time low at 0.8325.

USDCHF_Daily

Read more forex trading news on our forex blog.

Forex Trading: Deciding on a Pair and a Time Frame

By James McKee

Once you understand what currency trading is it is important to consider your own personality and ability. While some traders might be able to make split decisions all day long, others might want to do intraday trades that last more than 24 hours on on the online forex exchange. Those who trade on a certain time frame will use the corresponding chart with “candles” that correspond to that period. For a 1 hour time frame each candle displayed will represent one hour’s worth of market activity. If you cannot monitor the market on at least a semi-regular basis than the one-hour or less time frame will not be ideal for you.

Choosing the right time frame to accommodate not only your trading style, but also your lifestyle can be a difficult balance to find. For most people it is a matter of trying out a variety of time frames prior to settling on one that works for them. Trying out everything from the 15-minute chart to the 8-hour chart can help new traders to understand how different strategies must be applied to different time tables. For instance, most of the time trends that occur are usually going to be found in the 15-minute time period, and they should be traded accordingly.

Those have a more responsive and extremely fast paced personality would probably be better suited for scalping. Scalping is a type of trading that revolves around targeting the shorter time tables (15 min, 1 hour) in order to make and take fast profits. While smaller in scope scalping also exposes the trader to less risk, and there are more trade possibilities during the course of a week. There has to be a balance determined by the trader with regard to which time frame is best for them, and this can be done easily by trying them all out in a practice account.

Testing out any new trading system or technique in a practice account prior to going live is very important. Figuring out what you stand to gain or lose by playing it out in theory prior to wagering real money on a decision is a good way to see not only whether or not it will be effective, but also whether or not it suits your own needs. If you are absolutely miserable on one time frame then go ahead and try another, and another until you have found something that works for you.ves.

About the Author

Author is a Forex trader and financial analyst residing in Denver, Colorado. To stay up to date on all the latest developments in the financial world and beyond be sure to check out the online forex trading regularly.

E-Mini Trading: Charts, Price Action, and Indicators

By David Adams

There are a wide variety of methods to trade e-mini contracts currently taught by trading educators. Some are good, some are not very effective. From time to time I get some very talented traders visiting my trading room and they all have one common characteristic; they understand e-mini charts and price action, and don’t rely upon oscillators, moving averages, and indicators.

This article is not a condemnation of using oscillators and indicators in the trading process, but I do want to point out that using oscillator and indicator methodologies as your primary trading tools generally leads to mediocre or unprofitable trading results. All oscillators and indicators are tools that lag the market, despite claims by some that they have developed leading indicators. Indicators and oscillators use information from the previous time periods to develop, through a specific algorithm, their output. By definition, using historical information creates lagging results.

While many schools of thought deny any level of randomness present in equity markets, the empirical evidence disproving this line of thought is overwhelming. There can be no doubt that 60% to 70% of the market movement is created by normal backing and filling operations that are the heart of equity markets. These backing and filling operations create periods of consolidation and range bound channels that are, at best, difficult to trade. During these periods of consolidation, or slightly wider periods of range bound trading, indicators and oscillators can give wildly false trading indications and, especially for new traders, present setups that are faulty and unprofitable. Of course, oscillators and indicators work well during trending markets, but I don’t need any indicators to trade a trending market, no one does; trade with the trend and you will generally profit.

Price is everything.

This statement leads me to my thesis in this article; learn to read charts and understand price action and you will be well on your way to success. The very best e-mini traders I have known were masters of support and resistance, trend lines, volume analysis, and identifying unprofitable trading channels. In my trading I use 2 indicators. I use these indicators to reinforce the ideas that I have developed about trading from the chart action, and they are never the primary source for potential e-mini trading setups. I would be remiss if I did not point out that it takes time, experience, and specific type education to master chart reading. On the other hand, these skills are really not so difficult to master with proper diligence. I highly recommend that e-mini traders learn to read charts and understand price action, as I have watched many of my students increase their profitability and trading confidence through understanding these types of skills.

In summary, we have discussed some of the inherent deficiencies that are problematic with oscillator and indicator based trading. We have identified the lagging tendencies of these indicators. I have suggested that learning price action and chart reading are the keys to success in e-mini trading. Time and experience with struggling new traders (and watching their improvement) has proven that the key to e-mini trading lies in understanding price action in the information contained on your trading chart.


About the Author

Real Live Trading Doesn’t Lie. Spend several days in my trading room and see if you can benefit from a fresh and unique view on trading e-mini contracts. Sign up for your free trading experience by clicking here

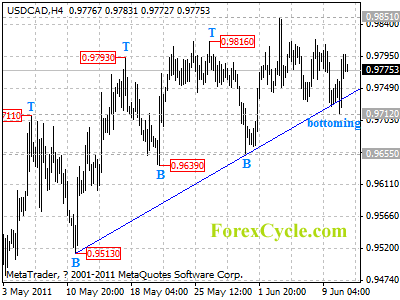
USDCAD rebounded from 0.9712

After touching the trend line from 0.9513 to 0.9655, USDCAD rebounded from 0.9712, suggesting that a cycle bottom is being formed on 4-hour chart. Further rise towards 0.9851 is expected later today, a break above this level will confirm that the uptrend from 0.9444 has resumed, then next target would be at 0.9900 zone. Only break below 0.9712 could indicate that lengthier consolidation of uptrend is underway, then the pair will find support at 0.9650 area.

usdcad

Daily Forex Forecast

Forex Product Launches – Why They Are Very Lucrative For Affiliates

By James Woolley

When you become an affiliate in the forex trading niche, you will notice that there are a lot of big product launches taking place throughout the year. A lot of these will be relatively low cost, poor quality products, but some will be premium high end courses costing several thousand dollars. Anyway the point is that these product launches can be really beneficial if you are an affiliate marketer.

The fact is that these product launches can help you to make some truly massive commissions. The biggest companies in the currency trading niche generate millions of dollars worth of sales every time they launch a new product, and they do this by doing lots of testing to ensure that the sales funnel is perfectly optimized, and everything is set up to get maximum sales.

This is good news for you because all you have to do is to get your readers or subscribers into this sales funnel. Then you can simply sit back and watch the sales roll in when the product launches.

The way it works is quite simple. Whenever you get the big product launches, you will usually find that they follow the same pattern. There is often lots of free content available prior to the launch, and there may also be videos showing the upcoming product in action.

This content is accessible by leaving your name and email address. So your job is simply to tell your website readers and email subscribers about this free content, and send people to this content via your affiliate link. When a visitor opts in, they are then fully cookied and any subsequent sales will be credited to you if they decide to buy the forex product after it goes on sale.

The beauty of all this is that you never have to actually do any selling yourself. All you have to do is send people to the free content. The pre-selling will be done by the company selling the product using a combination of email messages, online videos and possibly webinars as well.

So the point is that it is well worth promoting some of the premium forex products because the product launches are perfectly set up for you to generate lots of sales. With many of these products paying upwards of $700 per sale, you can generate some huge commissions in a very short space of time. All you need to do is to get as many people into the sales funnel as possible (by promoting the free content), and then sit back and watch the sales roll in.


About the Author

For more information about forex affiliate programs, and to discover which affiliate programs James Woolley has found to be the most profitable, simply click on the following link:

http://theforexarticles.com/forex-affiliate-programs/

Yemen Revolution Underway

By James McKee

Now that Yemen’s revolution is more or less underway it is important to consider the widespread implications of this country’s decision. The country of Yemen is a known haven to some terrorist organizations and as a result many Western countries warn that Yemen could become a bastion of hate. Such concerns have already been aired by the United States who has already attempted to facilitate peaceful talks between Yemen’s rebels and the politicians in place. While much of Yemen’s rebels want a complete ouster of all politicians others are willing to work with some elements of the current government. Much like the Libyan coup the one in Yemen involves a family that rules the entire government. Yemen’s current leader has a son and nephews in control of much of Yemen’s military.

The effect of Yemen’s revolution on the USD on the online forex exchange will not be positive, indeed an unstable country on the border of Saudi Arabia could spell out serious trouble. Saudi Arabia is the world’s number one oil producer and supplier if that oil supply is interrupted then the world’s economy is in serious trouble. The continued violence in Yemen has resulted in numerous deaths and exponential property damage since it began nearly a month ago. There are no signs of direct intervention on behalf of the US or Saudi Arabia; however, it is only a matter of time before this becomes necessary. If the wrong people are allowed to gain power in Yemen there will be a large degree of trouble for the oil supply, and for the world’s economy.

As of late there has been no sign of the revolution in Yemen slowing any time soon, with the evacuation of Yemen’s president for so-called medical reasons there is concern he will return. If the leader of Yemen does come back to the country there is certain to be a good deal of resistance to his attempts to reassert power. The all-out violent revolution many have foreseen for the country of Yemen will not occur if there is comprehensive negotiation. The chances of this negotiation occurring with any element leftover from the former leader’s regime is highly unlikely. There must be a period of relative calm where the nation of Yemen is concerned if there is to be any peace in the nation. What occurs in Yemen may set the precedent for even more revolutions to occur in the Arab world.

About the Author

Author is a Forex trader and financial analyst residing in Denver, Colorado. To stay up to date on all the latest developments in the financial world and beyond be sure to check out the online forex trading regularly.

E-Mini Trading: Displaying Price Data on Bar Charts. Which Method Is Best?

By David Adams

If you ask a group of 10 e-mini traders which type of bar they prefer on their trading charts you will find no shortage of strong opinions. Most traders were taught to trade on a specific type of bar, say a candlestick, and adjust to their trading to the art of reading candlestick charts. Generally speaking, once they have learned a specific system it is difficult to dislodge, especially if the e-mini trader has been having success with candlesticks. On the other hand, there are a wide variety of bar charting techniques worthy of consideration, and most people fail to do so.

In this short article we will look at five types of bar charting techniques and give a short analysis of the advantages and disadvantages of each technique. We will be looking at:

• Candlestick charts
• Standard bar charts
• Heiken-Ashi charts
• Renko charts
• Range charts

It is my observation that the most popular charts and use today are candlestick charts. For the sake of convenience, we will be talking about bar charting techniques in relation to e-mini trading; though there are a wide variety of trading disciplines that employ the charting techniques we will discuss.

Candlestick charts

It is assumed by most historians that candlestick charts were developed in the 1500’s in Japan. Japan is considered by many to be the first country to develop a futures market of sorts in the rice trading industry. A candlestick is several components in its composition; a body, upper and lower wicks (though if the price closes at the top or bottom of a candlestick, it will not have a shadow at that point). It is also common to hear the wick formation referred to as a shadow. The body portion of a candlestick chart was traditionally painted black or white indicating the direction the body had moved. On most current charts, you will generally see upward movements in the body painted green and downward movements in the body painted red. There are groups of traders who have used traditional Japanese patterns in candlestick formations to predict movement in the market. The empirical evidence on accuracy of the predictive nature of candlesticks points toward a negative correlation and accuracy, though I would admit that a conclusive decision on this topic is yet to be formalized.

Heiken-Ashi Candlesticks

The Heiken-Ashi version of candlesticks also has its origins in the 1500’s in the Japan rice markets. They differ significantly from traditional candlesticks in that they are weighted in nature and are trend oriented. I have used them with success in my trading, though certain market conditions must exist for them to be used successfully. The formula for calculating Heiken-Ashi bars is as follows:
• Open = (open of previous bar+close of previous bar)/2
• Close = (open+high+low+close)/4
• High = maximum of high, open, or close (whichever is highest)
• Low = minimum of low, open, or close (whichever is lowest)
As you can notice there is a heavy weighting on the latter portion of the bar and the system is especially effective in trend following systems. There are a set of specific guidelines for using Heiken-Ashi charting bars which is reasonably extensive and beyond the scope of this article. However, I recommend any trader investigate this charting system as it has many useful applications.

Standard Bar Charts

While I no longer trade this charting system, when I learned the trade it was the predominant system in use. There are many traders at present who still prefer standard bar charts, especially stock traders, for their charting needs. Standard bar charts are reasonably simple in their construction; there is a vertical line that shows the range of the traders chosen bar time. And a hash mark on the left side of the line to indicate the open, and a hash mark on the right side to indicate the close of that particular bar. This charting system is often referred to as an OHLC chart. While this may be the simplest of charting systems, it’s still important to note that all charting systems are essentially displaying the same data in different formats.

Renko and Range charts

These two charting systems are similar in many ways, though they have some very distinct dissimilarities that should be thoroughly understood before undertaking any serious trading with them. Like candlesticks and Heiken-Ashi charting, Renko bars also have their origin in Japanese trading. Quite literally, Renko means bricks. Renko bars are often referred to as bricks by e-mini traders. When using these bars you set a specific range to be charted. For example, you may set your Range and Renko bars to a setting of four. With a setting of 4, every time the market moves 4 ticks a bar is formed. But there is a fundamental difference between Renko and Range bars. Range bars chart market movement in either direction, while Renko bars chart only in one direction. For example, when using Renko bars the market would have to move 4 ticks upward or downward before a new brick is displayed. On the other hand, a range bar will chart the complete range, up or down, and form a bar indicative of this movement.

In summary, we have taken a close look at 5 different charting tools. While an in-depth discussion of the advantages and disadvantages of each system would entail a very lengthy discussion, I have tried to point out some basic advantages and disadvantages of each system. Each type of bar charting system provides a definite purpose for the e-mini trader, and I recommend serious e-mini traders investigate the advantages and disadvantages of each of these charting systems.


About the Author

Real Live Trading Doesn’t Lie. Spend several days in my trading room and see if you can benefit from a fresh and unique view on trading e-mini contracts. Sign up for your free trading experience by clicking here

Finding A Suitable Fx Trading House Before Investing In Forex

By Cedric Welsch

Forex trading is the act of buying and selling foreign currencies when the values of the money fluctuate enough to make profits. The art of this type of trade is one that can be somewhat complex, but with the right amount of diligence and knowledge it can be a profitable adventure for one to dabble in. The best way to venture into Forex trading is to find a suitable Forex trading house to connect with before investing.

A foreign exchange trading house is simply a company that is generally ran online that keeps up to the minute statistics running daily on trading charts and provides a middle man for all trading activities. Many people use a company such as this because they take a lot of the leg work out of foreign currency trading. There are a lot of aspects to trading currencies and a company that provides up to date information and keeps archives of past trades is most useful to those wishing to invest in foreign dollars.

When an individual does enough research or is taught to work specifically with the buying and selling of foreign currencies, the need for a company to keep track of all the updated stats and assist in the actual buying and selling proves to be a great asset to making profits. Some people prefer to keep a middle man out of the picture in order to better increase their profits, this is not entirely a bad idea if the person is capable of keeping track of the multitudes of information needed in trading.

Individual’s that do not have the knowledge or capability of keeping track of all of the information and the ever changing values of each countries dollar, are more likely to profit by investing their money with a company that has the software to keep up with this sort of trading. Because currency can fluctuate from one hour to the next it certainly is wise to seek a reputable trading company before investing hard earned money in foreign currency.

Events such as natural disasters, shifts in a country’s economy, and various other situations can cause countries currency values to fluctuate from one day to the next. These fluctuations are what investors are counting on to make a profit, having a company to keep track of all the information is pertinent to successful investing. A Forex trading house handles all of the charts and information that is crucial to an investor, finding a reputable house to handle investments is most often the key to any profit while trading in currency.

About the Author

Do not belittle the capacity of the forex industry to make you a rich business person someday.
There is certain magic in fx trading that makes even the commoner to amass profits quick.

Forex: Large Currency Speculators add to Dollar shorts. Yen, Euro Positions rise

By CountingPips.com

The latest Commitments of Traders (COT) report, released on Friday by the Commodity Futures Trading Commission (CFTC), showed that large futures speculators increased their short positions against the US dollar for the second consecutive week. Non-commercial futures positions, those taken by hedge funds and large speculators, were overall net short the US dollar by $22.98 billion against other major currencies as of June 7th, according to Reuters. The data is a rise from the total short position of $15.73 billion on May 31st, according to the CFTC COT data and calculations by Reuters which calculates the dollar positions against the euro, British pound, Japanese yen, Australian will dollar, Canadian dollar and the Swiss franc.

This week’s notable changes were Euro positions increasing to their highest level since May 10th while Japanese yen positions rose over to the long side and to their highest level since late March.

EuroFx: Currency speculators boosted their net long positions for the euro against the U.S. dollar for a second straight week as of June 7th. Euro futures positions rose to a total of 51,836 long contracts following a total of 21,970 long positions on May 31st.

The COT report is published every Friday by the Commodity Futures Trading Commission (CFTC) and shows futures positions as of the previous Tuesday. It can be a useful tool for traders to gauge investor sentiment and to look for potential changes in the direction of a currency or commodity. Each currency contract is a quote for that currency directly against the U.S. dollar, where as a net short amount of contracts means that more speculators are betting that currency to fall against the dollar and net long position expect that currency to rise versus the dollar. The graphs overlay the forex spot closing price of each Tuesday when COT trader positions are reported for each corresponding spot currency pair.

GBP: British pound sterling positions were about unchanged after an improvement last week. Pound contracts edged lower to a total of 1,700 net short positions as of June 7th following a total of 1,829 short contracts on May 31st.


JPY: The Japanese yen net contracts increased after two straight weeks of declines. Yen positions rose to a total of 17,631 net long contracts reported on June 7 following a total of 1,648 net long contracts on May 31st.


CHF: Swiss franc long positions decreased as of June 7th after increasing the week previous. Franc positions fell to a total of 16,865 net long contracts following a net of 21,119 long contracts on May 31st.


CAD: The Canadian dollar positions fell to their lowest level since September of 2010 last week. CAD positions decreased to a total of 13,522 long contracts on June 7th following a total of 26,402 long contracts on May 31st.


AUD: The Australian dollar long positions rose higher for a third consecutive week. AUD contracts increased to a total net amount of 65,205 long contracts as of June 7th. AUD positions had totaled 60,015 net long contracts on May 31st.


NZD: New Zealand dollar futures positions rose for a third consecutive week to the highest level since early December. NZD contracts advanced to a total of 16,004 long positions as of June 7th from a total of 15,724 long contracts on May 31st.


MXN: Mexican peso long contracts decreased for a second straight week and fell to the lowest level since March 29th. MXN contracts fell to 90,198 net long contracts as of June 7th from a total of 108,268 long contracts as of May 31st.


COT Data Summary as of June 7, 2011
Large Speculators Net Positions vs. the US Dollar

EUR: +51836
GBP: -1750
JPY: 17631
CHF: +16865
CAD: +13522
AUD: +65205
NZD: +16004
MXN: +90198