EUR Holds Gains as Investors Bet on Greece Bailout

Source: ForexYard

The euro zone will be publishing its reports on consumer confidence today; most predominant will be the ZEW readings. Many investors are turning their attention on the euro zone regional economy after yesterday’s faltering debt discussion met resistance. Most speculative traders appear to be betting on a last minute deal being thrown together this week to save Greece, and the EUR will benefit from the shift in risk appetite that results.

Economic News

USD – USD Bearish as Traders Seek Risk

The US dollar was seen in decline in trading yesterday as traders began to seek risk following speculation that the euro zone would put together an eleventh-hour deal to bailout Greece.

The EUR/USD was seen moving towards 1.43 yesterday before settling mildly below this mark. The GBP/USD was also in a bullish channel, but witnessed a stronger downtick later in the session than its euro zone counterpart.

Yesterday’s stagnant German PPI figures have so far done little to help lift the value of riskier assets, but other news surrounding Greece’s bailout has held the international spot light. The EUR, GBP, and AUD were each appreciating against the US dollar throughout the latter half of Monday’s session, with mild downturns coming towards the day’s closing.

With a heavy news day expected, traders are sure to see heightened volatility. Most significantly, the US economy will be publishing its Existing Home Sales report. Expectations are for solid growth of approximately 4.8M housing sales. The USD could see some bullishness if the data surprises to the upside.

EUR – EUR Bullish as Investors Move into Riskier Assets

The euro rose versus the US dollar this morning, with the pair’s price reaching a recent high near 1.4300. Soft data out of the American economy last week forced a reevaluation by many investors who went long on the USD following the European Central Bank’s (ECB) cloudy rate statement from over a month back, and several grumblings about Greece’s debt woes.

What little data was published out of the euro zone yesterday highlighted stagnant growth. The difference in fundamental data from the US and Europe has generated a heightened intrigue in the comparative interest rates as risk sentiment gets shifted. Fed Chairman Bernanke’s statements yesterday have many investors turning to the higher yielding economies of Europe in expectation of record low interest rates in the US for longer than was initially forecast.

As for today, the euro zone will be publishing its reports on consumer confidence; most predominant will be the ZEW readings. Most investors are turning their attention on the euro zone regional economy after yesterday’s faltering debt discussion met resistance. Most speculative traders appear to be betting on a last minute deal being thrown together this week to save Greece and the EUR will benefit from the shift in risk appetite that results.

JPY – Japanese Yen Bearish as Investors Seek Higher Yields

The Japanese yen was seen trading lower against most of its currency rivals yesterday as investors moved towards higher yielding assets in Europe and the Pacific. Japan’s economy has published several positive figures over the last week, much of which has helped establish the yen’s recent bullishness.

With yesterday’s rate statement affecting JPY values, traders are likely to see heightened volatility as the day moves ahead. While the yen suffers from its own economic concerns, shifts in consumer sentiment have helped lift yen values against a number of its rivals.

This trend was cut short yesterday, however, as investors took cues from bullish inflationary reports out of the US and UK to mean that riskier assets may see an uptick. The yen, which traditionally acts as a store of value during times of uncertainty, was seen taking a hit yesterday as investors largely moved away from the island currency and into higher yielding assets like the EUR and AUD.

Oil – Crude Oil Prices Continue Decline

Crude Oil prices dropped sharply towards $92 a barrel Monday as sentiment appeared to favor a downturn in global industry and expectations for unilateral action among members of OPEC.

Data releases out of Britain and Europe yesterday were driving many investors back into higher yielding assets as most reports suggested steady growth in global inflation and consumer spending. Sudden upticks in dollar values have helped many investors pause briefly on their short-taking positions on physical assets, however.

Crude Oil witnessed a mild uptick in yesterday’s late sessions while Gold and Silver began to largely see sideways movement. Should sentiment hold steady this week, oil prices may continue to find weak support near its current price, but the trend remains bearish so far this week.

Technical News

EUR/USD

Last week’s failure of the pair to close below the 100-day moving average should not dismay euro shorts. The late in the week rally failed to move above the 20-day moving average which may induce some traders to sell into any euro gains. Both monthly and weekly stochastics have turned lower and point to potential declines. Support is found at 1.4075 followed by the May low at 1.3970. The 200-day moving average may be a likely target and below that the rising trend line from the May 2010 low comes in this week at 1.3610. Resistance is found at Friday’s high of 1.4340 followed by 1.4500 and the early June high of 1.4690.

GBP/USD

Cable is on the verge of breaking the neckline of a head and shoulders top which comes in today at 1.6120. A breach at this level and a measured move from the chart pattern could take the GBP/USD lower to 1.5370. The likeliest target on the charts is the December low at 1.5350. On the way lower cable could encounter support at the May low of 1.6050 and the March low at 1.5940. To the upside the pair may see resistance at last week’s high at 1.6440 as well as 1.6550 off of the May high.

USD/JPY

The pair failed to establish a beachhead above the 81 yen level and proceeded to fall. This level will serve as initial resistance followed by the May 31st high at 81.75 followed by 82.20 and 82.57. Falling daily stochastics hint at further declines. Support comes in at the May low of 79.50 followed by the all-time low at 76.11.

USD/CHF

The USD/CHF rose to the May support which has turned into a resistance level at 0.8550, a phenomenon which often occurs in technical analysis. A break higher would run into the 50-day moving average which coincides with the falling trend line off of the February high at 0.8640. This may offer traders a good level to enter short into the long term downtrend. Additional resistance is located at the mid-May low at 0.8750 and the May high of 0.8950. To the downside the all-time low could be supportive at 0.8325.

The Wild Card

Gold

Spot gold prices are rising and the technicals are setting up in favor of further gains. Both daily and weekly stochastics are moving higher indicating momentum is to the upside. A successful test and subsequent move higher from the rising trend line off of the January low also bodes well for additional gains. Forex traders should look for a break of the June resistance at $1,1553 where the commodity would likely test the all-time high at $1,576. Support comes in at $1,150.50.

Forex Market Analysis provided by ForexYard.

© 2006 by FxYard Ltd

Disclaimer: Trading Foreign Exchange carries a high level of risk and may not be suitable for all investors. There is a possibility that you could sustain a loss of all of your investment and therefore you should not invest money that you cannot afford to lose. You should be aware of all the risks associated with Foreign Exchange trading.

NOK Could Rise on Interest Rate Differentials

printprofile

Tomorrow the Norges Bank will release its key policy rate decision and Monetary Policy Report. Expectations are for the Norwegian central bank to hold rates steady but to signal its intention to continue on its current path of monetary policy tightening in the future which would be a catalyst for the Norwegian krona.

Consensus estimates are for the Norwegian central bank to remain on hold in its current cycle of rate tightening while most expectations are for an additional interest rate increase in the near term. The current rate stands at 2.25%. However, according to most economists’ forecasts the timing for the next 25 bps interest rake hike could come sometime between August and October.

An increase to the Norwegian interest rate will be needed as unemployment in Norway has dropped to 3.3%. Norway has an unemployment rate most industrialized nations can only dream of but the strong macroeconomic fundamentals may spill over into future inflationary pressures as rising wages could feed into further price increases.

While the Norges bank continues to raise rates following its first increase in May, this may keep the NOK well bid versus the majority of G7 currencies that are striving to maintain interest rates at record low levels in order to aid their economic recoveries, particularly in the US. Given the Greek debt crisis is coming to a head, this may present an opportunity in the EUR/NOK.

Turning to the charts, the EUR/NOK is encroaching on resistance at 7.950-80, a level the pair has not traded above since early December. Significant support comes in at 7.7850 and 7.7165. These defined support and resistance levels may offer traders an opportunity to short the EUR/NOK with a strong profit to risk ratio of at least 3:1.

Read more forex trading news on our forex blog.

EUR Slapped as Greece Bailout Discussion Hit Road-Block

printprofile

Forex traders had been anticipating an announcement from this morning’s ECOFIN meetings which may signal an impending second round of financing for the ailing Greek economy. Initial agreements had the bailout in approval stages, conditioned upon Greece imposing a severe $40B austerity package that had sparked riots and a governmental cabinet shuffle.

As the government of Greece meets further pressure from its populace, the debate over a bailout for the regime has apparently reached an impasse. Several speculative reports have hinted that an emergency rescue deal would be passed shortly to stave off a default by Greece, but the delay in the approval process has shifted many traders into a bearish posture on their EUR/USD positions. The pair is likely to see further downside throughout the week if bailout talks stall any longer.

Read more forex trading news on our forex blog.

New Zealand Manufacturing Sales Climbs 2.9%

printprofile

The agency Statistics New Zealand published figures very early this morning which highlighted one optimistic tone in the static filled room of global manufacturing. Sales for manufactured goods in New Zealand climbed 2.9% this past month, down only 0.1% from the previous reading.

As many traders have witnessed these past two months, manufacturing and industrial data have shown a stark slowdown in output and demand from the United States, Britain, China, Switzerland and the broader euro zone. The healthy growth in manufacturing demand in New Zealand gives weight to notions of speedy growth among the Asian and Pacific nations lasting through the second quarter, likely outpacing its Western hemisphere rivals.

Read more forex trading news on our forex blog.

Japanese Trade Deficit Holding Steady

printprofile

A report from the Bank of Japan (BOJ) this morning gave several investors reason for optimism in regards to Japan’s exporting capabilities. Given the surging strength of the yen for the past few years, many had anticipated a slowdown in Japan’s ability to boost exports, which it depends on for growth.

The trade balance figure released less than an hour after market opening today revealed the island economy’s trade deficit holding steady at 0.47T yen. Expectations were for a widening trade gap to 0.54T, but today’s steady figures could prove a solid gauge of the country’s impending bounce back in the months ahead.

Read more forex trading news on our forex blog.

Euro Zone Current Account Deficit Widens

printprofile

As the Economic and Financial Affairs Council (ECOFIN) kicks off another round of talks, the euro zone published today a report which showed the region’s current account deficit widening. The news has only added to recent fears that the Greece bailout plans may falter.

The EUR was seen holding uneasily against its currency rivals this morning. Many investors have been awaiting comments to emerge from the ECOFIN conference. So far, news has been largely pessimistic, with an impasse forming in the last several hours. Traders may see the EUR plummeting as the day wears on if nothing is done to address investor concerns soon.

Read more forex trading news on our forex blog.

Is This the Ultimate Sell Signal?

stock crashLast week I discussed the chance of a major drop in the S&P 500. And for the past couple of months, Sara and I have accurately warned of sell-offs and market corrections. After all this selling you would think we would look at the bright side of the equities markets… unfortunately there is more bad news.

We may have just gotten the ultimate sell signal.

Those of you who have read or watched my commentary for some time know I am a fan of technical analysis and am an ardent statistical observer. In fact, I made a career out of numbers. It’s not because I believe in some secret mathematical code that controls the stock market, but rather I use numbers to find patterns in human behavior.

You don’t have to be a psychologist. With a smidgeon of knowledge, math reveals the truth behind human logic.

The 200-Day Moving Average

The world of technical and statistical analysis of stocks and options is massive and complex. There are many folks who study much more than I and have dozens of computer algorithms running in unison trying to figure out the market’s next move. It does not have to be that difficult.

Yesterday on CNBC, I must have heard the word “moving average” mentioned at least 20 times in a matter of two hours. Specifically, experts were referring to the 200-day exponential moving average (EMA) of several stocks, but one, Apple, was very popular.

Apple was the stock du jour and was on everyone’s radar because it fell below the 200-day moving average of about $316. Once this happened, the stock quickly dropped another $5, stabilized and closed right at $315.32 (the 200 EMA is $315.88, according to freestockcharts.com).

There are two major moving averages that traders use to determine if a stock or index is in a bullish or bearish trend. The 200-day EMA can be a major support or resistance level for a stock.

Some investors keep it ultra-simple; they buy a stock once it gets solidly above the 200-day EMA and sell it once it falls below it.

The 50-Day Moving Average

The 50-day moving average is more volatile but can provide a stronger early warning of a change in a trend and can also help identify the end of a trend.

Some traders will wait for the 50 to cross above the 200 as an entry signal, then wait for it to cross back below for confirmation that the trend is over and it’s time to sell.

If the trader has a good profit on his hands, he may sell simply when the price of a stock closes below the 200-day moving average.

Let me show you an example…

Below is a daily chart of Apple going back to January 2009. The yellow line is the 50-day EMA and the red line is the 200-day EMA.

The last time Apple was below its 200-day EMA was in April of 2009; the stock was trading at $111. Soon after that, the 50 EMA crossed above the 200 EMA — a signal to buy.

Since then the stock has never closed below its 200-day SMA… until yesterday. The trade has worked out, but now may be the time to look for an exit in Apple — at least until it gets back above that 200-day EMA.

Apple moving average chart
View Larger Chart

(Sign up for Smart Investing Daily and let me and fellow editor Sara Nunnally simplify the market for you with our easy-to-understand articles.)

Apple’s Misery Has Company

Unfortunately, this has become a common theme in the marketplace. I ran a scan of the equity markets to find how many stocks had fallen below their 50- and 200-day moving averages. I also searched for stocks that have seen their 50-day moving averages cross below the 200-day.

It’s not pretty. Here are the numbers…

Out of all the 6,798 publicly traded companies in the U.S. (data courtesy of finviz.com):

  • (73%) or 4,929 stocks are below their 50-day moving averages
  • (47%) or 3,180 stocks are below their 200-day moving averages
  • (31%) or 2,099 stocks have 50-day moving averages below their 200-day moving averages

Remember, this is an extremely broad measurement. When I narrowed the search down to the S&P 500 stocks, I found the numbers were slightly lower, but still relatively high considering we are supposedly climbing out of a recession.

Many stocks are not that far away from falling below one of these major moving averages and if they do, sharp sell-offs can often follow.

Know what your stock’s charts look like and where the major averages are. It can only help you!

The Invisible Hand

What concerns me most is technical analysis has a very strong following and can influence the equity markets in big ways.

Algorithms that run on big computers at powerful hedge funds and trading firms around the world pay close attention to these common moving averages. If a stock breaks out above or below an average, it can trigger thousands of buy or sell orders and can have a dramatic effect on prices.

I have seen it with my own eyes and have many friends in the business who rely heavily on technical analysis to make their money. It’s a serious game, and if many of these stocks fall just a bit further, it could trigger more selling.

Look at how Apple sold off yesterday on NO news and in a bullish market. Do you think it was coincidence? I don’t think so…

Whether or not you believe in looking at the charts, you would be a fool not to. At least learn the basics so you can spot any potential support or resistance points for your investments.

P.S. This kind of mathematical analysis is the backbone of my WaveStrength system. I recently put together an in-depth report on the subject that shows how you can use these techniques to give your portfolio a double-digit boost.

Follow the link to get your hands on my recent report.

Article brought to you by Taipan Publishing Group. Additional valuable content can be syndicated via our News RSS feed. Republish without charge. Required: Author attribution, links back to original content or www.taipanpublishinggroup.com.

{jtagstpg} {authorstpg}

Other Related Sources:

  • Black Swan Event: Will the S&P 500 Drop 40%?
  • Are SPY Options Signaling a Market Rally?
  • 50-Day Moving Average and Sell in May
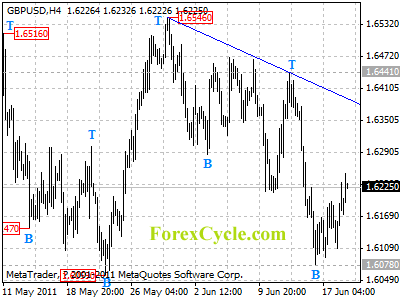
  • GBPUSD rebounded from 1.6078

    Being contained by 1.6059 support, GBPUSD rebounded from 1.6078, and formed a cycle bottom on 4-hour chart. Range trading between 1.6078 and 1.6250 is expected in a couple of days. Key resistance is at downtrend line from 1.6546 to 1.6441, as long as the trend line resistance holds, one more fall to re-test 1.6059 support is still possible. However, a clear break above the trend line will indicate that the fall from 1.6546 had completed at 1.6078 already, then another rise towards 1.6745 previous high could be seen.

    gbpusd

    Daily Forex Analysis