Bank of Uganda Ups Rate 400bps to 20.00%

The Bank of Uganda hiked its new monetary policy interest rate (the central bank rate [CBR]) by 400 basis points to 20.00% from 16.00% previously.  The Bank also raised the rediscount rate to 25.00% and the Bank Rate to 26.00%, by the same margin.  Bank of Uganda Governor, Emmanuel Tumusiime-Mutebile, said: “This should be seen as a clear signal to bring inflation under control,” signalling a hard-line against Uganda’s double digit inflation; “However, should the upside risk to inflation continue in the months ahead, then monetary policy will be tightened further.”

Previously the Ugandan central bank increased its interest rate by 200bps to 16.00% in September, after hiking 100bps at its August meeting, and previously setting the new central bank rate at 13.00% at its June meeting.  The Bank only recently began using the 7-day interbank rate to influence inflation, also commencing official targeting inflation; the Bank previously announced an inflation target of 7%, and noted it has a 5% core inflation target in its September press release.  

Uganda reported annual headline inflation of 28.3% in September, up from 21.4% in August, 18.8% in July, 18.7% in June this year, 16% in May, and 14.1% in April, while core inflation was 27.5% in September.  
Uganda reported annual GDP growth of 6.3% in the fiscal year to June, compared to 5.5% in the same period last year.  

The Ugandan shilling (UGX) has depreciated by about 23% against the US dollar so far this year; the USDUGX exchange rate last traded around 2,865, near the highest (2,885) on record (against a low of 1570 in 2008).

Why the Fed’s Actions Make Perfect Sense

By MoneyMorning.com.au

–Due to special circumstances, I’ve moved my normal Wednesday S&P analysis to Thursday. Look for it tomorrow.

–In the meantime, I’ve recorded a short video answering some basic questions about my trading, my background, and what I’ve done to make Slipstream Trader more useful for you. You can see the full explanation here.

–In today’s Money Morning you’ll find the transcript of an interview I did last week with Kris Sayce before he went on holiday. I’ll show you why you need more than just charts to be a good trader and when I expect stocks to be cheap again. Enjoy!

Kris Sayce (KS): You’ve been bearish on this market for the past two years. And I know from talking to you, you knew the recent market action was coming. At any point over that time have you ever thought, “Hang on, maybe I’m wrong and the economy will be just fine”?

Murray Dawes (MD): The whole basis of my trading methodology is structured around the fact that I may be wrong. No one knows the future. Once you accept this fact you can build a strategy that manages the truth that markets can do anything and everything.

Having said that, my macro-economic view has been based on observing the market for nearly 20 years. My views are based on Austrian economic theory so I have felt very confident that the Keynesian solutions had a used-by date. The correlation between Fed manipulation of interest rates and money printing in recent years and the movements in equity markets is undeniable when you have been watching markets for so long.

It has been fairly obvious that the fiscal pump priming and money printing has been the major cause of the rally from the lows in 2009. It was only a matter of time until the music stopped. The difficulty, as always in trading, is figuring out when to start attacking the market from the short side.

In Slipstream Trader we had a few false starts but have ended up catching a great bulk of the sell-off.

KS: How important has the actions of the U.S. Federal Reserve and Dr. Ben S. Bernanke been to your analysis these past two years?

MD: It is imperative that any trader – other than scalpers – have a good understanding of the workings of the US Fed. They have the power to change the rules of the game. The US dollar is the world’s reserve currency and they have the power to create as many of them as they like. They also have power over the price of money via interest rates.

If you don’t understand their ultimate motivations you are flying in the dark. I have devoted a lot of time to understating the history of the US Fed and… beyond that… the history of central banking.

Once you understand there is a partnership between governments and central banks that goes back hundreds of years you are no longer surprised by their actions and can even start to predict what they will do.

There is no doubt that the US Fed is motivated purely by their desire to protect the banking system. Everything else is secondary. Their actions of the past few years, when analysed from this point of view, make perfect sense.

By printing money they have done nothing other than help to recapitalise the banking system. Cheap money has been used by the banks to cover up huge losses and to speculate on commodities and equities worldwide via the carry trade.

Surging commodities have lowered the average person’s disposable income via surging food and energy prices. Businesses have had their margins crunched by rising input costs and low end demand. Printing money just steals from savers and gives to the banks.

The whole thing is rotten to the core and would have you scratching your head if you didn’t understand what their true motivations are.

KS: I’ve met and spoken to hundreds of technical analysts over the past 10 years, but none of them have a trading style that comes anywhere near replicating yours. How long did it take you to develop your trading approach? And is it something you’re still fine-tuning?

MD: The markets are constantly changing so you always have to be open to learning new things and adjusting your approach. The cornerstone of my trading approach was created from my years on the Sydney Futures Exchange trading floor. It was an invaluable experience spending years in the trading pits watching every tick.

You get an intimate sense of the emotion running through the crowd as prices move. Moments of calm twist into mayhem at the drop of a hat and then return to calm.

My theories on the structure of price action grew from this period and as the years passed by I have strengthened my views about the universal patterns that occur across all markets. I am still constantly amazed by the market’s ability to wrong foot you, but I feel confident that I have the ability to survive in any market conditions even if I end up treading water for months at a time.

My main motto is survival, because the market will always end up giving you great opportunities if you are patient.

KS: Are you a perma-bear or do you think one day you’ll look at the market and say, “Wow, this is a bargain!”

MD: I have to admit that I have suffered from the condition of perma-bearness in the past. Having a strong point of view can be damaging in the markets because you end up filtering all market information through your world view. In the end, you can miss important signals or leave money on the table because you are so stubborn about your view.

These days I have a set of rules based on short, intermediate and long-term trend indicators that keep me in the flow of the markets. When my indicators align with my macro view then I will attack the market aggressively. If they don’t, then I either tread carefully or trade with the prevailing market trend regardless of my bearish view.

The market has just trended up in a straight line for two years from 2009 to 2011. If you were stubborn with your bearish view you would have missed out on great gains and possibly have blown yourself up.

I am sure there will come a day when I will say that the market is a bargain. It will probably be when the Dow/gold ratio is close to one as it was near the lows of past bear markets. Does that mean Dow 5000/gold $5000? Probably but who knows.

All I know is that this market is being held up by government intervention alone. Eventually the market will always go where it needs to go regardless of what the politicians want.

KS: Most of the technical analysts I’ve met only look at charts. In fact, some of them don’t even care what the company is or does. But you use fundamental analysis with your technical trading. Why is that important to you?

MD: The market is an intricate game of chess. I think the more you understand about the way it functions the better able you are to react and take advantage of opportunities.

I want to buy cheap companies like anyone else but I have seen cheap companies become cheaper and cheaper over a long period of time. I would prefer to use technical analysis to give me great risk/reward entry points where I know very quickly if I am wrong. Then I am not tying up capital in dud trades that cause me stress.

I am either in the money quickly, in which case I can take part profits and turn the trade into a free option. Or I am out with a small loss.

If I focus on buying or selling short companies that I believe are very under or overvalued then my profit potential is increased dramatically. That’s because I can use my money management system to give me low-risk entry points into stocks that may eventually rise by multiples while also managing my downside risk.

I think it just makes perfect sense to combine fundamental and technical analysis when you are trading stocks for larger moves than can be achieved in a day or two.

Also, as I said above, it is necessary to understand the workings of the US Fed, for example, so that you can react and predict what they will do. If you ignore their power you will eventually be blindsided by their actions.

KS: Thanks Murray!

MD: My pleasure. Enjoy the beach!

Murray Dawes
Money Morning Australia

Publisher’s note: Murray began his career on the Sydney Futures Exchange trading floor in 1993 with Swiss Banking Corporation (SBC). After leaving SBC Murray continued his career in broking at Bankers Trust Australia. Then in 2001 Murray moved to Melbourne to work as a hedge fund trader for one of Australia’s wealthiest families. In 2003 he was ready to set up his own firm providing the same proprietary technical trading system to some of Australia’s boutique hedge funds. Now Murray heads up the Slipstream Trader service which provides members with specific buy and sell alerts on Australian stocks. To trial Murray’s service for 90 days, with no obligation, go here.


Why the Fed’s Actions Make Perfect Sense

Mr Market: 42 Minutes to Gainesville

By MoneyMorning.com.au

Last night’s market action in the US just goes to show why it’s so important right now for you to base your investment decisions on sound principles.

Dow Jones Rallies from 10442 to 10,808 in 42 Minutes

Dow Jones Rallies from 10442 to 10,808 in 42 Minutes
Click here to enlarge

Source: Google Finance


The Dow Jones Industrials fell more than 200 points in the first hour after the open. At 3:18 pm it was still down 212 points. It finished the day up 152 points from the open… a 364-point turnaround.

And why did the markets rally?

On a rumour. A report in the Financial Times that EU commissioner for economic affairs, Olli Rehn said…

‘Capital positions of European banks must be reinforced to provide additional safety margins and thus reduce uncertainty… This should be regarded as an integral part of the EU’s comprehensive strategy to restore confidence and overcome the crisis.’

Capital positions must be reinforced? This should be regarded as integral? So nothing happened. The FT said ‘jump’ and Mr Market said, ‘how high?’ And investors piled into stocks, like JP Morgan Chase [NYSE:JPM], which rallied 12% in the last half hour of trade.

It’s almost impossible to trade a rumour-driven market like this. It just rises and falls with the headlines. Yet, somehow, the New York Stock Exchange volatility index fell 10.25% last night.

Luckily, it’s always possible for you to find sound businesses trading at a discount to value – whether we’re in the depths of a depression of the height of a bull market.

If you use rational judgment to arrive at a company’s intrinsic value you can make profitable investment decisions in any market.

Mr Market will offer to buy or sell your shares for a different price each day. But his offer is not based on a rational appraisal of a business’s value. It is based on emotion. Most people don’t realise this and take the offer at face value.

But value investors know Mr Market’s offers change daily. And they only have a passing resemblance to a company’s true value – especially in a market distorted by past and expected future monetary interventions.
These distortions are the cause of the current volatility. This type of environment is not likely to end anytime soon. But you must not let it take advantage of you. Consider these quotes from the author of The Intelligent Investor, Ben Graham:

‘The true investor scarcely ever is forced to sell his shares, and at all other times he is free to disregard the current price quotation. He need pay attention to it and act upon it only to the extent that it suits his book, and no more.’

‘Thus the investor who permits himself to be stampeded or unduly worried by unjustified market declines in his holdings is perversely transforming his basic advantage into a basic disadvantage. That man would be better off if his stocks had no market quotation at all, for he would then be spared the mental anguish caused him by other persons’ mistakes of judgement.’

This was first written in 1949, when the stock market was a male dominated world – hence the references to ‘him’ and ‘his’.

When it comes to central bank intervention, one of the biggest impacts is on ‘liquidity’. But that is no reason to run out and speculate the stock prices will move higher.

‘…what this liquidity really means is, first, that the investor has the benefit of the stock market’s daily and changing appraisal of his holdings, for whatever that appraisal may be worth, and, second, that the investor is able to increase or decrease his investment at the market’s daily figure – if he chooses. Thus the existence of a quoted market gives the investor certain options that he does not have if his security is unquoted. But it does not impose the current quotation on an investor who prefers to take his idea of value from some other source.’

To sum up:

‘Basically, price fluctuations have only one significant meaning for the true investor. They provide him with an opportunity to buy wisely when prices fall sharply and to sell wisely when they advance a great deal. At other times he will do better if he forgets about the stock market and pays attention to his dividend returns and to the operating results of his companies.’

Greg Canavan
Money Morning Australia

Publisher’s note: Greg Canavan is the foremost authority for retail investors on value investing in Australia. He’s the former head of Australasian Research for a major asset-management group and a regular guest on CNBC, Sky Business’s ‘The Perrett Report’ and Lateline Business. Greg shares his insight, ideas and investment recommendations with readers of his Sound Money. Sound Investments newsletter… to find out more information on Greg’s letter, go here.


Mr Market: 42 Minutes to Gainesville

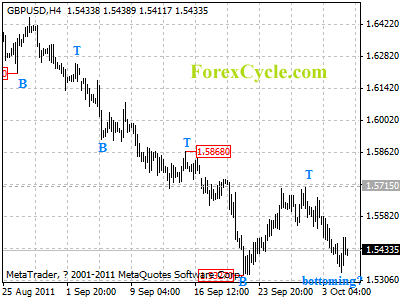
GBPUSD rebounded from 1.5341

Being contained by 1.5327 support, GBPUSD rebounded from 1.5341, suggesting that a cycle bottom is being formed on 4-hour chart. Further rally would likely be seen in a couple of days, and target would be at 1.5800 zone. On the downside, another fall to re-test 1.5327 key support is still possible, a breakdown below this level could signal resumption of the longer term downtrend from 1.6617.

gbpusd

Daily Forex Analysis

Is the S&P 500 on the Verge of a Rally

JW Jones – www.OptionsTradingSignals.com

Only 5 short months ago the S&P 500 was trading at the 2011 highs around the 1,370 price level on the S&P 500 Index. Since then, the price action has devastated investors and traders alike. As of the close on Monday, the S&P 500 had worked over 270 handles lower in 5 months. The price action since September 27th has been a bloodbath.

It is true that the S&P 500 could be carving out a double bottom on the daily chart, but I am of the opinion that there may be more work to do to the downside. We are oversold on the daily and weekly price charts, but I have yet to see the kind of panic level selling that typically precedes a price reversal. The chart below illustrates the number of stocks that are currently trading above the key 50 period moving average:

Learn Option Trading

While most market participants are concerned about a trap door that causes prices to cascade lower, I am concerned that at some point news will come out that could rip the bears’ faces off. The majority of retail investors are running for cover. The sentiment levels are decidedly bearish and the last thing most traders are looking for is a rally. The contrarian trader in me cannot deny that a rally would do a lot of damage in the near future, but Mr. Market needs to suck in a few more bears in order to do the most harm.

One sound bite out of Europe could alter the price action almost instantly in favor of the bulls. The ECB could suddenly cut interest rates or announce that Eurobonds are going to be made available. Either two headlines or a combination of both headlines would most likely drive prices significantly higher.

After the nasty downside probe today, there are layers of buy stops above current price levels. If price worked high enough, the stops would be triggered and an all out rally could play out. Anything coming out of the Eurozone that appears to be either stimulative or that appears to push an ultimatum out on the time spectrum will be viewed as positive.

Often news and price action play out together at key support/resistance levels and it would make sense that some form of announcement will be made when the S&P 500 price is sitting right at a long term support level. As can be seen from the weekly chart of the S&P 500 Index ($SPX) below, the 1,008 – 1,050 price level is of critical importance.

The primary support levels I am watching on the S&P 500 if it continues lower are the 1,080 price level which should act as short term support. If that level breaks the 1,050 area will become a major support level that bulls will likely defend fervently. Additional long term support will come in around 1,008. I would be shocked to see the S&P 500 push through both the 1,050 and the 1,008 price level on the first attempt, but stranger things have happened.

If price works down to the 1,008 – 1,050 support zone it would not be shocking to see a strong reversal higher. With the recent carnage we have seen in the S&P 500, I find it hard to believe that we could see another 10 – 15% more downside before a reversal plays out. The 1,008 – 1,050 price zone seems ripe for a test, but one other scenario would be a test of the 1,080 support zone that fails intraday and by the close is regained. The chart below illustrates the two most probable scenarios:

How to Trade Options

Financial markets do not offer a sure thing, however it is without question that bulls will aggressively defend the 1,008 – 1,050 price level on the S&P 500. If that level fails, the price action is going to get far worse and an all out crash could be underway. For now, I am of the opinion we are within 7% – 8% of an intermediate term bottom which could produce a strong multi-month rally into the holiday season.

As always anything could happen, but traders need to keep their eye on both sides of the price action. A rally would do a lot of damage to the bears as well as the under-invested retail traders and investors. Ultimately the price action is in the hands of Mr. Market, but it is a well known fact that Mr. Market likes to trap traders and inflict pain on as many market participants as possible. A forthcoming rally  would offer yet another opportunity for a lot of traders to eat another slice of humble pie.

Subscribers of OTS have pocketed more than 150% return in the past two months. If you’d like to stay ahead of the market using My Low Risk Option Strategies and Trades check out OTS at http://www.optionstradingsignals.com/specials/index.php and take advantage of our free occasional trade ideas or a 66% coupon to sign up for daily market analysis, videos and Option Trades each week.

JW Jones – www.OptionsTradingSignals.com

This material should not be considered investment advice. J.W. Jones is not a registered investment advisor. Under no circumstances should any content from this article or the OptionsTradingSignals.com website be used or interpreted as a recommendation to buy or sell any type of security or commodity contract. This material is not a solicitation for a trading approach to financial markets. Any investment decisions must in all cases be made by the reader or by his or her registered investment advisor. This information is for educational purposes only.


Swedish Central Bank to Open the Books

Source: ForexYard

printprofile

In following with the trend of a more open and transparent central bank, the Riksbank will begin to publish macroeconomic indicators on its website.

Two new inflationary readings will be released, along with resource utilization of and wage estimates. While some of the data is collected and published by others (Eurostat and Statistics Sweden), any new data and source providers are a step in the right direction for openness of the Swedish central bank, especially for those who trade the Swedish krona (SEK) for forex macro.

The trend of increased transparency from the world’s central banks was helped when Federal Reserve Chairman Ben Bernanke held his first press conference in April, a format that has been long implemented by the European Central Bank. Currently the Riskbank does not hold press conferences, only releasing meeting minutes from the Executive Board Monetary Policy meetings.

Read more forex trading news on our forex blog.

Forex Market Analysis provided by ForexYard.

© 2006 by FxYard Ltd

Disclaimer: Trading Foreign Exchange carries a high level of risk and may not be suitable for all investors. There is a possibility that you could sustain a loss of all of your investment and therefore you should not invest money that you cannot afford to lose. You should be aware of all the risks associated with Foreign Exchange trading.

Available Now! Forex Summary and Forecast – 2010/2011

Source: ForexYard

printprofile

We entered the year 2011 amid a flurry of global reevaluations. Many investors were inquiring about the stability of Europe amid the bailout of Ireland all while the Korean peninsula began to intensify its militant rhetoric and posturing. On the other side of the globe, US President Barack Obama had recently agreed to an extension and expansion of the Republican-favored tax cuts, sparking speculation about the recovery of the American economy over the long run.

If you were looking for a report which would summarize these events, and provide a framework for forecasting the coming year’s economic progress based on their impact, then we have what you’re looking for!

Our Chief Market Analyst, Greg Holden, recently undertook the task of compiling as much fundamental data as possible to explain what happened in 2010 in order to give his renowned 2011 economic forecast.

In this edition of ForexYard’s In-Depth Analysis, Mr. Holden covers the sharp price swings among the major currencies last year, particularly the EUR, USD and GBP. He also analyzed the rise of the Swiss franc (CHF) as a global safe-haven away from even the US dollar.

Minor commentary was added regarding the Korean escalation and China’s recent expansionary moves, but what is most useful is the concluding segment of each chapter and sub-chapter, providing valued insight into what investors may expect as 2011 gets underway.

Don’t miss out on this unique opportunity to learn from the best in the business. Download a copy of our In-Depth Analysis today and better prepare yourself for a year of lucrative profits in the forex market.

Forex Market Analysis provided by ForexYard.

© 2006 by FxYard Ltd

Disclaimer: Trading Foreign Exchange carries a high level of risk and may not be suitable for all investors. There is a possibility that you could sustain a loss of all of your investment and therefore you should not invest money that you cannot afford to lose. You should be aware of all the risks associated with Foreign Exchange trading.

EUR/USD – Could We Predict The Bullish Move?

Source: ForexYard

printprofile

On January 10, after the EUR/USD pair saw a third failed attempt to fall below the 1.2870 support level, a bullish correction took place, and the pair gained about 580 pips within four trading days. Is it possible to predict such turn of events? Let’s try to answer this using technical analysis.

First, please observe the EUR/USD 4-hour chart below; this will be the main tool we’ll work with in this article.

Now, let’s look for all the signs that could have driven us to suspect that a bullish reversal is about to take place.

• As written on the opening paragraph, the bullish correction only took place after the pair saw several failed attempts to fall below the 1.2870 level. When a currency pair sees such a strong support level – traders must question whether the market actually desires to see the pair traded below this level. It is no coincidence that the pair’s bearish move is blocked over and over again at the exact same level.

• Look at the Slow Stochastic indicator. First, a bullish cross was completed below the 20-line. This often means that a bullish correction might be impending. In addition, no less than three additional bullish crosses took place afterwards, all within a very short period of time. The first bullish cross has signaled that a bullish move might take place, the other bullish crosses that followed have signaled that the market is reluctant to let the pair resume to a down-trend.

• The MACD is probably the easiest to analyze. A bullish cross at the bottom of the section is very likely to predict a bullish reversal. As you can see, the MACD has never switched its indication, and continues to provide bullish signals.

The Relative Strength Index (RSI) has provided two significant bullish signals. First, it rose above the 30-line, reaching out of what is referred to as the over-sold area. When the RSI crosses the 30-line and continues to point up, it usually mean that the currency pair will follow its lead. The second signal was given once the RSI failed to fall below the 70-line. If the RSI would have fallen below this level, it should have warned us that the bullish move might have reached its end. However, once the RSI reversed its direction, and once again pointed upwards – it signaled that there is still significant bullish pressure on the pair.

• The timing of the bullish correction could have been predicted using the Bollinger Bands. When the Bollinger Bands are tightening, it’s a clear signal that a sharp movement is likely to take place. Considering all the bullish signals written above, traders could have suspected that the Bollinger Bands are signaling that the bullish correction will take place soon.

• Last but not least – sophisticated traders could have noticed that a double top pattern has begun forming on the chart. Once the pair crossed the 1.3020 resistance level, the beginning of the pattern could have been observed by traders, and once the pair crossed the 1.3200 resistance level – traders could have seen it as a signal that the pattern will be completed, meaning that the pair will reach the 1.3450 level.

EUR USD

Forex Market Analysis provided by ForexYard.

© 2006 by FxYard Ltd

Disclaimer: Trading Foreign Exchange carries a high level of risk and may not be suitable for all investors. There is a possibility that you could sustain a loss of all of your investment and therefore you should not invest money that you cannot afford to lose. You should be aware of all the risks associated with Foreign Exchange trading.

Fan Likes `High-Quality’ Bond Issuers, Dividend Stocks

Oct. 4 (Bloomberg) — Fan Cheuk Wan, head of Asia-Pacific research at Credit Suisse Private Banking, talks about the outlook for the global economy, financial markets and her investment strategy. Fan speaks with Susan Li, Rishaad Salamat and John Dawson on Bloomberg Television’s “Asia Edge.” (Source: Bloomberg)