How to create a MT4 Trailing Stop EA

By Warren Seah

The launch of the MT4 platform for forex trading has made trading so much easier and accurate. Because of the MT4 trading platform and its accompanying MT4 Expert Advisor function, a trader’s job is made much easier as certain trading procedures can now be automated with mechanisms like MT4 EA. The degree of trading system flexibility has now risen as the mq4 language of MT4 can be used fashion out additional automated strategies. The consequence of this is that a trader would have time for other tasks like finding better trading strategies instead of just observing the market all of the time.

A number of advantages are attached to having one’s own MT4 trailing-stop EA. It helps to automate most of the tasks that would, otherwise, have been done manually. MT4 trailing stop EA assists a forex trader in the perfect execution of his trading strategy, and makes it possible for a trader to verify the workability of his trading strategy by doing back-testing against historical charts. It also helps him to think rationally when making trading decisions rather than to rely on emotions for decision making. There are more advantages of MT4 trailing-stop than the ones stipulated earlier. The MT4 Expert Advisor puts a trader in a position where he would be able to learn the essentials and develop appropriate trading strategies fitting for automation purposes.

When it comes to discussions about forex trade management and exit strategies, most retail traders do not take long to lose interest in such discussions. This is how MT4 expert advisors comes into the picture to solve the problems through automation. But a trader would still need to put in a minimal effort to fashion out his MT4 stop loss EA that would take care of all other things; entering and exiting forex trades at appropriate times. It would, however, cost some money to create the MT4 EA if the trader does not have any knowledge of programming. But MT4 stop loss is well worth paying for because of its usefulness. As some people would say, you have to invest a little money to make more money.

Traders’ communities provide another cheaper means of putting together a trade management EA. From these online communities, a trader can get expert views that they could use to put together a viable MT4 trailing-stop EA. Through these communities, retail traders would find it pretty easy to have their own MT4 trailing-stop EA developed and also make a little money by sharing with other traders in the community. You can easily learn from the experience of traders who are using stop loss in their forex strategy and seek their opinion on which exit strategy is best to use in the current market.

About the Author

Warren Seah

What if you just couldn’t trade forex effectively with a day time job?

I know how hard it can be to trade forex manually, but if you want to really be successfully trading your own unique manual system, you need to learn a single method that works amazingly well.

This method is simple to pick up and it works like an automated trade exit tool. Yes, you can now select the forex exit strategy and the tool will manage your trade and exit with profit. You can read how to do it in my free report here: Trailing Stop

Don’t give up hope, it’s NOT impossible. Mt4 Trailing Stop will expand your trading capabilities to greater trading success learn more by clicking the link.
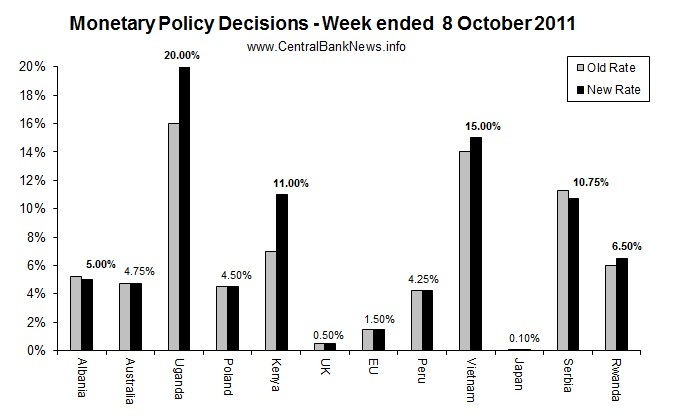
Monetary Policy Week in Review – 8 October 2011

The past week in monetary policy saw 12 central banks reviewing monetary policy settings, with 6 adjusting interest rates. Those that changed interest rates were: Albania -25bps to 5.00%, Uganda +400bps to 20.00%, Kenya +400bps to 11.00%, Vietnam +100bps to 15.00%, Serbia -50bps to 10.75%, and Rwanda +50bps to 6.50%. Those that held rates unchanged were: Australia 4.75%, Poland 4.50%, UK 0.50%, EU 1.50%, Peru 4.25%, and Japan 0.10%. Also making news in monetary policy was the announcement from the Bank of England that it would add a further GBP 75 billion to its Asset Purchase Program (quantitative easing). Similarly the ECB announced a set of liquidity and asset buying measures in its monetary policy announcement.

Monetary Policy Week in Review

So it was a reasonably eventful week; of those cutting rates, it was basically countries with a close connection to the Eurozone; which is under severe pressure due to the sovereign debt crisis and rising risks of recession. Meanwhile those hiking rates were basically emerging African (and Asian) economies, which are relatively less connected to the EU quagmire and more exposed to the impact of still relatively high commodity prices and still strong domestic demand. Elsewhere the decision to stay put or implement other measures was driven by uncertainty surrounding global financial market volatility and economic outlook uncertainty.


Following are some of the key quotes of the week from the monetary policy setters:

  • Bank of England (held rate at 0.50%, expanded asset purchase program GBP 75B): “The pace of global expansion has slackened, especially in the United Kingdom’s main export markets. Vulnerabilities associated with the indebtedness of some euro-area sovereigns and banks have resulted in severe strains in bank funding markets and financial markets more generally. These tensions in the world economy threaten the UK recovery.”
  • Central Bank of Kenya (increased rate 400bps to 11.00%): The CBK “will revise the CBR further if inflation and exchange rate volatility do not abate.” also noting: “inflationary pressure has continued to increase and both the weakening of the shilling and its volatility poses additional threats.”
  • Bank of Uganda (increased rate 400bps to 20.00%): “This should be seen as a clear signal to bring inflation under control,” signalling a hard-line against Uganda’s double digit inflation; “However, should the upside risk to inflation continue in the months ahead, then monetary policy will be tightened further.”
  • National Bank of Serbia (dropped rate -50bps to 10.75%): “The Executive Board expects that inflation will continue to decline and that it will enter the target tolerance band in the first half of the next year. The future path of the key policy rate will depend on the achievement of projected inflation, and on the materialisation of risks, primarily those stemming from the international environment and fiscal policy at home.”
  • National Bank of Rwanda (increased rate 50bps to 6.50%): “the real economic growth in Rwanda is likely to exceed the 7 percent initially projected for the year 2011.  It is expected to reach 8.8 percent whereas the inflation forecast is at 8.2 percent by end December 2011.  Considering these projections, the Central Bank finds it appropriate to review its policy rate in order to keep the monetary aggregates at optimal levels to limit inflation pressures while continuing to support economic growth.”
  • Bank of Albania (dropped rate -25bps to 5.00%): “This serves the achievement of the inflation’s objective in middle-term periods and at the same time it offers the necessary monetary conditions to stimulate economic activities in the country. I believe that this measure will be transmitted at the defined level,”
  • Bank of Japan (held rate at 0-0.10%): “Japan’s economic activity has continued picking up.  Production and exports have continued to increase, although their paces have moderated after going through the recovery phase immediately following the quake-induced plunge… business fixed investment has been increasing moderately, and private consumption has been picking up on the whole.”  


Looking at the central bank calendar, next week is set to be a relatively quieter week with just 3 banks scheduled to meet. Also keep an eye out for the US FOMC (Federal Open Market Committee) meeting minutes from its 20 September meeting, likewise the Bank of Japan will also be releasing monetary policy meeting minutes this week.

  • IDR – Indonesia (Bank Indonesia) expected to hold at  on the 11th of Oct
  • KRW – South Korea (Bank of Korea) expected to hold at  on the 13th of Oct
  • MXN – Mexico (Banco de Mexico) expected to hold at on the 14th of Oct

Are Central Bankers Destroying Your Wealth?

By MoneyMorning.com.au

Whrrrrrrrr!

That is the sound of the printing press being turned up to full speed.

Yep, those central bankers are at it again.

The Bank of England (BoE), announced on Thursday night they would increase their quantitative easing program by £75 billion (AUD $118.8 billion), to £275 billion (AUD$435.8 billion).

According to The Age, ‘The policy announcements came one day after official data showed the British economy had flat lined over the past nine months and that the 2008-09 recession was worse than previously thought with a peak-to-trough contraction of 7.1%, rather than the previous estimate of 6.4%.’

Adding to the bad news, between April and June this year the British economy grew just 0.1%.

After the lousy gross domestic product growth report, newspapers like the Guardian anticipated additional money printing from the central bank. But no one expected it to be this size. ‘[The size] … was probably a bit more than anticipated,’ Peter Dixon, an analyst at Commerzbank AG, said.

In an interview with BBC television, BoE governor, Mervyn King said:

The news from the rest of the world in the past few months has been very poor. The world economy has slowed, America has slowed, China has slowed, and of course particularly the European economy has slowed. That’s affecting our ability to engineer a recovery here so we took action today.

That’s part of the problem.

Central bankers, like Mervyn King, are convinced they can fix the economy.

Yet, for all their interfering, bigger problems will be created.

More Money Printed – Higher Inflation


‘Experts claim that while QE can help to kick-start an economy, it also threatens to fuel inflation, which in the long run can actually hinder growth,’ wrote The Age.

Right now, England is looking at an inflation rate of 4.5%. Well above the BoE’s target rate of 2%.

But printing money isn’t a solution. It’s a band aid for a flesh wound.

Economist Chris Williamson from Markit said this strategy from the BoE is ‘…not without risk. Printing more money is inflationary and high prices are already one of the factors hurting household and subduing economic growth.’

In fact, Simon Smith, chief economist at FxPro, sees inflation reaching over 5% in the UK within a few months.

Upon this news, what did the market do?

The FTSE added a massive 3.71%.

‘Welcome to the confused and panicked trading days of late 2011.’ Greg Canavan of Sound Money Sound Investments says.

‘Global markets continue to jump at shadows.’

And in this case, the English market received a temporary boost from 75 billion quid.

The rally will be short lived. All the money printing won’t jumpstart the UK economy into growth.

As Greg wrote to his subscribers on Wednesday, ‘Just as the bear looks to be sinking his claws in, a hope-based rally comes from nowhere.’

By throwing some more money at the problem, all the BoE achieved was a quick jolt to the UK market.

Or so it thinks.

Yet, the 189-point climb just shows how sensitive the market is to news. In one trading day, the market has proven just how volatile it is.

As an Aussie investor, this isn’t good news for your portfolio.

Editor of Slipstream Trader, Murray Dawes has traded volatile markets before. But this one is a little different. ‘…the news flow is creating havoc out there’, says Murray in his latest video. You can find his weekly videos on his You Tube channel.

Murray has a long-term bearish view for the market, but warns listeners of a knee jerk reaction to any of the news that comes through.

As an Aussie investor, the news cycle isn’t good news for your portfolio.

Don’t Be Caught in the Market Panic


‘Hope isn’t a strategy,’ Greg told his readers in. ‘You just don’t know which string they’re [central banks] going to pull at the moment.’

Understanding how central banking policies interfere with the market, Greg has been warning his readers to hold cash and buy stocks when the opportunity arises. He encourages subscribers to take advantage of market panics:

While I’m bearish, I still think the market is cheap enough to buy selectively. There are some very good companies trading at good prices. In a market like this, everyone focuses on price, not value. So in the short term, prices can definitely go down from here because many investors are not thinking rationally.

‘Remember no one – and I mean no one – can pick the bottom. The best strategy is to buy on the panic down days. Why? You can be sure that the person is selling out of fear.’

Rather than be part of the panic, it’s time to look at ways to invest as soundly as possible.

Shae.


Are Central Bankers Destroying Your Wealth?

What’s The Biggest Mistake Most Investors Make?

By MoneyMorning.com.au

You might be one of those investors who’s been wondering whether now is a good time to look for cheap stocks. At a time like this – with the stock market breaking below 3840 this morning – it’s important to understand the difference between the intrinsic value and the price of a company.

This is something most investors simply can’t do.

When you estimate intrinsic value you’re estimating what a company’s really worth. It’s different to its share price, which is based on Mr Market’s emotional judgement – not rooted in sound knowledge of a company’s financial position or business fundamentals.

But that’s not to say the share price isn’t useful. It is. Because it gives you the chance to buy a company when it’s trading below its real value and sell it when it’s trading at a premium.

Put simply, price is what you pay and value is what you receive.

A stock’s price is based on the market’s assessment of its value. More often than not, this assessment is distorted by the prevailing sentiment – either too much optimism or pessimism. This means price and value often differ wildly.

And when you’re under the influence of sentiment, it can lead you to either buy a company well in excess of its value, or sell below its value. That is, fear and greed can lead you into making the wrong decisions at exactly the wrong time.

One tool I use in Sound Money. Sound Investments to help you see past the sentiment and assess whether a company is undervalued by the market is the price-to-book (P/B) ratio.

This is simply a way of calculating the value of the company’s assets against its share price.

For example, Lynas Corporation [ASX: LYC] is a rare earths miner. Today it’s trading at 93 cents. But back in April it was selling for $2.60 a share – the stock price has dropped 61%! What happened?

The volatility in the market hasn’t helped. But JP Morgan’s downgrade of fellow rare earths miner Molycorp [NYSE: MCP] was the real catalyst for the price fall. It started a big ball of negative sentiment rolling. Bankers, traders and retail investors began bailing out of rare earths stocks. They short sold the sector. All on the back of negative sentiment – the fundamentals for the rare earths market hadn’t changed. China still controls more than 95% of the rare earths market. Making matters worse, China is expected to offer a paltry 30% of its 93,800 tonnes of rare earths to the export market. And rare earth demand is tipped to reach 185,000 tonnes in four years.

But the power of this negative sentiment sparked by JP Morgan’s re-rating of Molycorp pushed the share price of Lynas deeper into the red. Even though the average price for Lynas’s assets – its rare earths – was up 31% in the third quarter!

Here’s the thing. Using the price-to-book value, you can see through the market sentiment and get a clearer picture of the company’s asset value.
Lynas has a P/B value of 2.98.

Now, for the value investor, a company with a P/B of less than one tells you one of two things. Firstly, it could be that the market feels the asset value is inflated. Or secondly, the company has a lousy return on its assets.

The higher a company’s profitability, the higher the P/B value will be. And at 2.98 Lynas is sitting pretty.

This is why I focus on profitable companies.

Over time, it’s a much lower risk way of building wealth than trying to chase the market up or bail out on the way down.

A company’s true value has nothing to do with sentiment. If you understand this and have the right temperament, you’re well on the way to becoming a very successful investor.

Greg Canavan
Money Morning Australia

Publisher’s note: Greg Canavan is the foremost authority for retail investors on value investing in Australia. He’s the former head of Australasian Research for a major asset-management group and a regular guest on CNBC, Sky Business’s ‘The Perrett Report’ and Lateline Business. Greg shares his insight, ideas and investment recommendations with readers of his Sound Money. Sound Investments newsletter… to find out more information on Greg’s letter, go here.


What’s The Biggest Mistake Most Investors Make?

Day Trading Using the Forex charting software

By Warren Seah

The foreign exchange market, or Forex market for short, attracts thousands of new investors every year. Forex is the largest trading market in the world and the numbers aren’t even close. While the United States Stock Market does $10 billion dollars in trading volume everyday and commodities check in at $300 billion a day, the currency trading that takes place on the Forex market crushes them all at $1.8 trillion dollars per day.

While these numbers make currency trading on the Forex market tempting for many beginning investors, new traders should proceed with caution. Even experienced traders who have enjoyed success in the stock market or commodities market will fail at trading currencies if they don’t take the time to study and train the Forex This means even a successful trader will need to go back to basics when dealing with the currency market for the first time, and one of the most important basic lessons a new trader can learn is the difference between fundamental analysis and technical analysis.

The Forex charting software is a powerful tool for day traders and an invaluable learning device for beginners. Its reliable indications of momentum signal to traders when to buy and sell particular stocks throughout the day, Iogically reinforcing trading decisions that could otherwise be lost to the heat of the moment. This software is effective in gauging contrarian strategies and trending strategies alike.

The forex charting software does a simple measurement of price momentum used in technical analysis and day trading strategies The popular software compares upward and downward movements over a certain period, usually measured over 14 days. It performs calculations which are generally more reliable than simple momentum measurements that can be distorted by openings that differ greatly from a stock’s previous close. The metric oscillates in value between 0 and 100, indicating that a stock is technically overbought or oversold when it passes fixed levels .These signals can then be used to indicate when to buy or sell a stock while day trading.

Day trading strategies using the forex charting software vary based on the conditions of the market as a whole. In oscillating markets, markets that are ranging up and down regularly, the overbought and oversold indicators are commonly set at values of 70 and 30, respectively. When the charting tool passes these values for particular stocks, traders should begin monitoring them. When the tool passes these values again in the opposite direction, relative strength suggests a shift in the trend, signalling a buy when a stock is oversold and a short when a stock is overbought. The charting software can be effectively used in contrarian trading strategies as well as trend trading strategies, where traders focus on a single currency pair.

About the Author

Warren Seah

What if you just couldn’t trade forex effectively with a day time job?

I know how hard it can be to trade forex manually, but if you want to really be successfully trading your own unique manual system, you need to learn a single method that works amazingly well.

This method is simple to pick up and it works like an automated trade exit tool. Yes, you can now select the forex exit strategy and the tool will manage your trade and exit with profit. You can read how to do it in my free report here: Technical Analysis Trading

Don’t give up hope, it’s NOT impossible. Forex Charting Software will expand your trading capabilities to greater trading success learn more by clicking the link.

Zandi Finds `Relief’ in Jobs Report, 40% Recession Risk

Oct. 7 (Bloomberg) — Mark Zandi, chief economist at Moody’s Analytics Inc., and Marc Chandler, global head of currency strategy at Brown Brothers Harriman & Co., talk about the U.S. employment report for September, the U.S. economy and dollar, and the European sovereign-debt crisis. U.S. payrolls rose by 103,000 after a 57,000 gain in August, the Labor Department said today. Zandi and Chandler speak with Tom Keene on Bloomberg Television’s “Surveillance Midday.” (Source: Bloomberg)

Understanding Fibonacci – Learn to apply Fibonacci Ratios to calculate price targets

Learn to apply Fibonacci ratios to calculate price targets in stocks

By Elliott Wave International

The Fibonacci ratio can be an invaluable tool for calculating price retracements and projections in your analysis and trading. This excerpt from The Best Technical Indicators for Successful Trading explains the origins of the Fibonacci sequence and how you can apply it to the markets.

You can read the entire Fibonacci section — plus 7 more lessons on how to use technical indicators to improve your trading for FREE — see below.

Leonardo Fibonacci da Pisa was a thirteenth-century mathematician who posed a question: How many pairs of rabbits placed in an enclosed area can be produced in a single year from one pair of rabbits, if each gives birth to a new pair each month starting with the second month? The answer: 144.

The genius of this simple little question is not found in the answer, but in the pattern of numbers that leads to the answer: 1, 1, 2, 3, 5, 8, 13, 21, 34, 55, 89, and 144. This sequence of numbers represents the propagation of rabbits during the 12-month period and is referred to as the Fibonacci sequence.

The ratio between consecutive numbers in this set approaches the popular .618 and 1.618, the Fibonacci ratio and its inverse. (Relating non-consecutive numbers in the set yields other popular ratios – .146, .236, .382, .618, 1.000, 1.618, 2.618, 4.236, 6.854….)

…In addition to recognizing that the stock market undulates in repetitive patterns, R. N. Elliott also realized the importance of the Fibonacci ratio. In Elliott’s final book, Nature’s Law, he specifically referred to the Fibonacci sequence as the mathematical basis for the Wave Principle. Thanks to his discoveries, we use the Fibonacci ratio in calculating wave retracements and projections today.

How to Identify Fibonacci Retracements
The primary Fibonacci ratios that I use in identifying wave retracements are .236, .382, .500, .618 and .786. Some of you might say that .500 and .786 are not Fibonacci ratios; well, it’s all in the math. If you divide the second month of Leonardo’s rabbit example by the third month, the answer is .500, 1 divided by 2; .786 is simply the square root of .618.

There are many different Fibonacci ratios used to determine retracement levels. The most common are .382 and .618. However, .472, .764 and .707 are also popular choices. The decision to use a certain level is a personal choice. What you continue to use will be determined by the markets.

…It’s worth noting that Fibonacci retracements can be used on any time frame to identify potential reversal points. An important aspect to remember is that a Fibonacci retracement of a previous wave on a weekly chart is more significant than what you would find on a 60-minute chart.

See charts that show the application of Fibonacci ratios, plus 7 other lessons on technical indicators, by accessing your free report now.


Learn the Best Technical Indicators for Successful TradingIn this free report, you will learn the tools of the trade directly from the analysts at Elliott Wave International. Using both video lessons and reports, they teach you how to incorporate technical indicators into your analysis to improve your trading decisions.You will learn:

  • How to employ Fibonacci ratios to calculate possible turning points.
  • How to interpret technical indicators such as Moving Average Convergence/Divergence — MACD.
  • How to exploit trendlines to uncover trading opportunities when stock charting.
  • Technical patterns that can alert you to major moves, and how to know if it�s a legitimate pattern.

And more — 8 lessons in all!

Get your Technical Indicators report now>>

This article was syndicated by Elliott Wave International and was originally published under the headline Understanding Fibonacci. EWI is the world’s largest market forecasting firm. Its staff of full-time analysts led by Chartered Market Technician Robert Prechter provides 24-hour-a-day market analysis to institutional and private investors around the world.

Rwanda Central Bank Lifts Rate 50bps to 6.50%

The National Bank of Rwanda raised its key repo rate 50bps to 6.50% from 6.00% previously, with the interbank interest rate corridor changing to 4.50-8.50% and the discount rate now 10.50%.  Bank Governor, Claver Gatete, said: “the real economic growth in Rwanda is likely to exceed the 7 percent initially projected for the year 2011.  It is expected to reach 8.8 percent whereas the inflation forecast is at 8.2 percent by end December 2011.  Considering these projections, the Central Bank finds it appropriate to review its policy rate in order to keep the monetary aggregates at optimal levels to limit inflation pressures while continuing to support economic growth.”

At its August meeting the Bank also held the key monetary policy interest rate unchanged at 6.00%, meanwhile the bank last reduced the interest rate 100bps to 6.00% in November last year.  Rwanda has seen inflation pick up to 7.5% in August, compared to 5.82% in June, and just 1.09% in January this year.  

According to IMF data Rwanda saw annual GDP growth of 5.39% during 2010, meanwhile the IMF recently scaled down its growth estimate for Rwanda to 7% for 2011, from a previous forecast of 7.5%.  The Bank said that Rwanda has recorded broad money supply growth of 18% in the year to August, compared to a target of 16% for 2011.  The Rwandan Franc (RWF) last traded around 600 against the US dollar.

National Bank of Serbia Cuts a Further 50bps to 10.75%

The National Bank of Serbia cut its 2-week repo rate by another 50 basis points to 10.75% from 11.25% previously.  The Bank said: “The Executive Board expects that inflation will continue to decline and that it will enter the target tolerance band in the first half of the next year. The future path of the key policy rate will depend on the achievement of projected inflation, and on the materialisation of risks, primarily those stemming from the international environment and fiscal policy at home.”

The Bank also cut the rate 50bps in September, after pausing in August, while previously the Bank reduced the 2-week repo rate by 25 basis points to 11.75% at its July meeting, and cutting the rate 50 basis points at its June meeting to 12.00%.  Serbia reported inflation of 10.5% in August, compared to 12.1% in July, 12.7% in June, 13.4% in May, 14.7% in April, and above the bank’s inflation target range of 3-6%.  


The IMF is forecasting 2011 GDP growth in Serbia of 2%, and 3% in 2012.  The Bank next meets on the 11th of November.  The Serbian Dinar (RSD) last traded around 75.78 against the US dollar.