China Buying its Way to Shale Technology

China Buying its Way to Shale Technology

by Justin Dove, Investment U Research
Friday, October 14, 2011

Sinopec’s (NYSE: SHI) move to purchase Calgary-based Daylight Energy (OTC: DAYYF.PK) and its 300,000 acres of oil and gas-rich land for $2.2 billion certainly wasn’t the first Canadian acquisition by a Chinese oil and gas company – and it won’t be the last.

According to Bloomberg, Beijing-based Sinopec and CNOOC Ltd. (NYSE: CEO) are “among Chinese companies that have bought almost $30 billion of Canadian assets in the past five years.” This is not only to meet rising energy demands in the world’s fastest-growing major economy, but also to gain access to shale drilling methods.

“China has coal bed methane and shale gas resources domestically, so there has been some anticipation in the market that they would want to get some technology partnership in North America so that they could gain an ability to exploit their domestic resources,” Barclays’ Capital’s Michael Zenker told the Vancouver Sun.

China’s Interest Shifts to Shale Gas

Most of the early acquisitions centered on access to Canada’s vast oil sands reserves, which low estimates tab at 178 billion barrels of oil. Sinopec and CNOOC have also invested heavily in Enbridge Energy’s (NYSE: EEP) proposed Northern Gateway pipeline that will connect the Alberta oil sands with the West Coast and ultimately Asia.

However, the most recent acquisitions, such as Daylight Energy, have displayed a shift of interest in shale gas exposure.

According to EIA estimates, China holds 1,275 trillion cubic feet (tcf) of recoverable shale gas. That compares to 862 tcf of recoverable gas in the United States, where shale plays have been all the rage with investors.

Bloomberg reports that China “aims to triple the use of gas to about 10 percent of energy consumption by 2020 to cut its reliance on more polluting coal and oil.”

Lofty Goals for China Shale Production

In 2007, China became a net importer of natural gas for the first time in almost two decades.

Then in early 2010, the Ministry of Land Resources announced a goal of producing 530 to 1,000 Bcf/y of shale gas. That proposed production is likely to account for eight to 12 percent of the country’s total natural gas by 2020.

Thus far, China has been mostly unwilling to allow foreign companies access to its shale reserves. Currently Royal Dutch Shell is the only company in the region. In June, China National Petroleum agreed to a joint venture with Shell to seek guidance after it took nearly 11 months to set up its first shale well.

Additionally, Bloomberg reported that Chevron Corp. (NYSE: CVX), BP Plc. (NYSE: BP) and Statoil ASA (NYSE: STO) are among international oil and gas companies that have been negotiating to form joint ventures to tap shale- gas assets in China.

But to reach the lofty expectations China has set forth, it will have to speed up its technological advances in shale drilling. The best way to accomplish that will be through acquisitions of companies with the technology and know-how to access its vast shale deposits.

While the country has been hesitant to go after U.S. companies for political reasons, it seems to view Canadian companies as fair game.

China Energy’s Possible  Canadian Takeover Targets

Among rumored takeover targets for Chinese energy companies are the following:

  • Birchcliff Energy (OTC: BIREF.PK) – Birchcliff has a market cap of $1.64 billion, but its current P/E of nearly 400 is astronomical. It apparently put itself on the block for sale last week.
  • Celtic Exploration. (OTC: CEXJF.PK) – Celtic is a Calgary-based company holding land all over Alberta. It has a market cap of $2.3 billion. Among Celtic’s properties is 94,240 net acres in the Montney shale play and 84,269 net acres in the Duvernay shale play.
  • Talisman Energy (NYSE: TLM) – Talisman would come at a higher price to Chinese companies, with a market cap of $12.58 billion. It also doesn’t look like much of a bargain, selling at a 108.58 P/E ratio. The Calgary-based company does have operations spanning the globe, however, including multiple operations in Southeast Asia with close proximity to China.
  • Encana Corp. (NYSE: ECA) – Encana is the largest of the rumored companies with a $14.63 billion market cap, but it’s relatively cheap compared to its peers with a P/E of 20.27. It’s one of North America’s largest natural gas producers and the largest independent natural gas producer in Canada. In June, a proposed joint venture between Encana and PetroChina Ltd. (NYSE: PTR) worth $5.4 billion fell through. The company may currently be attractive as a takeover target considering its relative bargain price.

China definitely has its sights set on increasing its natural gas consumption to cut down high pollution. It also seems determined to increase its own domestic production.

Because of its hesitation to allow foreign companies access to its reserves, it’s likely that China will continue its buying spree in Canada.

Considering Sinopec paid a 120-percent premium for Daylight Energy, it may be in investors’ best interests to stay tuned to rumors regarding takeovers in the region.

Good investing,

Justin Dove

Article by Investment U

Jones Says Australian Bond Yields `Relatively High’

Oct. 14 (Bloomberg) — Russell Jones, global head of fixed-income strategy at Westpac Banking Corp., talks about global bond markets. Jones also discusses Europe’s sovereign debt crisis. He speaks with Susan Li and Rishaad Salamat on Bloomberg Television’s “Asia Edge.” (Source: Bloomberg)

Gold “Building a Base above $1650”, BRICS Ponder Giving More to IMF to Assist “Behind the Curve” Europe

London Gold Market Report
from Ben Traynor
BullionVault
Friday 14 October, 08:00 EDT

WHOLESALE prices for gold bullion climbed to $1679 an ounce Friday morning London time – 0.7% down on Wednesday’s high for the week – before easing back, as industrial commodities rallied and stocks edged up, while government bond prices fell.

Silver bullion climbed to $32.31 per ounce – 3.6% up on last week’s close – before it too fell back.

“Quiet market today in terms of flow,” says one gold bullion dealer in Hong Kong.

“Gold for the moment continues to base build above the $1650 level,” adds Swiss precious metals refiner MKS.

“It remains underpinned by strong seasonal physical demand and retail investment interest. In the short-term however, the metal still has to overcome resistance above the $1685 mark before more bullish sentiment manifests itself.”

Heading towards the weekend, gold bullion looked set for a 2.1% weekly gain by lunchtime in London. This would be the biggest weekly since the week ended 2 September – although six weeks ago an ounce of gold bullion cost over 10% more than it does today.

Economic policymakers from the world’s largest economies are considering expanding the size of the International Monetary Fund – possibly through contributions from emerging market countries – to prepare it for future crises, news agency Bloomberg reported Friday.

Christine Lagarde, IMF managing director, warned last month that the $390 billion at the Fund’s disposal may not be enough to meet all future loan requests.

The emerging market BRICS economies – Brazil, Russia, India, China and South Africa – are reported to be in favor of contributing, according to newswire Reuters.

Last month saw speculation that China was preparing to buy significant sums of distressed Eurozone sovereign debt, following a meeting between Chinese officials and Italy’s finance minister Giulio Tremonti.

However, “if emerging economies and the BRICS are called upon to contribute, we can do it via the International Monetary Fund,” Reuters quoted one anonymous source this morning.

“India is open to it, China and Brazil are also okay with the idea as well.”

“Emerging markets, in particular China, may feel the pressure at this point to make some gestures to help the West,” reckons Credit Agricole strategist Dariusz Kowalczyk in Hong Kong.

“They do not want to invest too much given that the West’s problems are of its own making, and if they help, they want to do so in a way that brings them benefits and recognition.”

“The very idea that capital-rich Europe needs help from capital-poor BRIC nations to fund itself verges on the absurd,” says Michael Pettis, finance professor at Peking University’s Guanghua School of Management.

“European governments are unable to fund themselves not because Europe needs foreign capital. It has plenty. They are unable to fund themselves because they have unsustainable amounts of debt, a rigid currency system that will not allow them to adjust and grow, and the concomitant lack of credibility.”

Europe’s leaders have been “behind the curve” for the last few years, South Africa’s finance minister Pravin Gordhan said in a speech today ahead of the G20 meeting.

“We would be looking forward for assurances from our European colleagues that by the time the summit of the G20 takes place [on 3-4 November] we will have a clear message that will create confidence that Europe is dealing with its issues.”

Gordhan added that neither the IMF nor the €440 billion European Financial Stability Facility would have adequate resources were the debt crisis to spread further, and that South African assistance “all depends on how the EFSF is leveraged”.

Elsewhere in Europe, ratings agency Standard & Poor’s has downgraded Spain’s debt from AA to AA-.

“All advanced economies are being x-rayed by the present crisis,” says outgoing European Central Bank president Jean-Claude Trichet in an interview in today’s Financial Times.

“It’s true for all of us – for Japan, for the US, for Europeans.”

German banks meantime are preparing to lose up to 60% on their holdings of Greek bonds, according to a Bloomberg report that cites unnamed sources. Luxembourg’s prime minister Jean-Claude Juncker, who chairs the Eurogroup of single currency finance ministers, said earlier this week that Greek debt losses could be even higher than this.

Gold bullion will be “increasingly used as the line of defense against negative market outcomes,” says a note from UBS, citing “ongoing global macroeconomic disappointments” and “the inevitability of further negative turns in the European sovereign debt crisis”.

Ben Traynor
BullionVault

Gold value calculator   |   Buy gold online at live prices

Editor of Gold News, the analysis and investment research site from world-leading gold ownership service BullionVault, Ben Traynor was formerly editor of the Fleet Street Letter, the UK’s longest-running investment letter. A Cambridge economics graduate, he is a professional writer and editor with a specialist interest in monetary economics.

(c) BullionVault 2011

Please Note: This article is to inform your thinking, not lead it. Only you can decide the best place for your money, and any decision you make will put your money at risk. Information or data included here may have already been overtaken by events – and must be verified elsewhere – should you choose to act on it.

Offshore Wind Power: Happening in Spite of Congressional Gridlock

Offshore Wind Power: Happening in Spite of Congressional Gridlock

by David Fessler, Investment U Senior Analyst
Thursday, October 13, 2011

All this week, I’m attending the American Wind Energy Association (AWEA)’s Offshore Wind Power 2011 Conference in Baltimore, Maryland. I’m a big advocate of wind power in general, and offshore wind in particular.

The keynote speaker for the Conference was Ken Salazar, the U.S. Secretary of the Interior. He’s a big proponent of offshore wind, and during his speech he praised the industry and state government leaders who’re taking the initiative to advance the cause of offshore wind here in the United States.

I got the chance to ask him a question during the press conference at the end of his address. More on that later. Let’s first take a look at the current state of alternative energy in light of the recent Solyndra debacle…

Is Alternative Energy Sustainable?

Solyndra’s failure raises a big question on everyone’s minds here when it comes to alternative energy like solar and wind. Is it “sustainable?” That is, can it pay for itself in the long run?

Onshore wind power made some inroads here in the United States, with about 42.4 GW currently installed. But while offshore wind power is non-existent here, it’s a different story elsewhere.

Head overseas, particularly to European countries, and you’ll find offshore wind well established, indeed thriving, and growing by leaps and bounds.

Why the big difference? A big part of the resistance, particularly to onshore wind, has been good old NIMBY-ism: “Not in My Back Yard.”

The big problem with onshore wind is actually getting the power from where it’s produced (remotely populated Midwestern states) to the densely populated coastal areas of the United States.

Unlike natural gas pipeline permitting, getting a new transmission line permitted can be a decade-long process, involving hundreds of permits from every municipality the line passes through. Sort of like watching a Bonsai tree grow.

Offshore Wind: Solving the Problems Plaguing Onshore Wind

Offshore wind promises to solve both the NIMBY-ism problem and the transmission issues. You see, the Atlantic Continental Shelf, where water is generally less than 100 feet deep, extends out nearly 100 miles off most of the Atlantic coast of the United States.

Than means huge, offshore wind turbines can not only be situated out of sight of anyone on shore, but the transmission lines can be located in federal waters, which start 20 miles offshore.

That will make the permitting process for turbines relatively simple. But the big advantage is that transmission line placement will be far easier. On shore, that same line permitting process involves every municipality it passes through. It can take a decade or more to get all permits in order.

Newly developed underwater high-voltage lines and substations will take the place of their onshore counterparts, tying individual turbines together. Less than a dozen shore connection points will bring vast amounts of power onshore.

They’ll provide much needed additional base load capacity (the wind blows offshore nearly all the time) to East Coast power providers.

An Embarrassment of Offshore Wind Riches

So how much power are we talking about? According to a report released by the Department of Energy’s National Renewable Energy Laboratory, the United States maxes out at 4,150.3 GW of offshore generating capacity.

Roughly 31 percent, or 1,300 GW, of that is off the East Coast states.

To put that in perspective, in 2008, U.S. electricity generating capacity from all sources barely topped 1,000 GW. So the wind power off the East Coast could power the entire country four times over.

At the post-keynote press conference, I asked Ken Salazar, the U.S. Secretary of the Interior, “To what extent will the lack of a national energy policy and the inability of our Congress to address that issue affect a lot of the projects you spoke of earlier this evening?”

His answer was, “David, that’s why I think we are at a crossroads. We need long-term Congressional support for the policies we’ve put in place. [This will] allow wind industry executives to make the long-term forecasts and capital commitments necessary to advance these projects. So there’s a lot Congress can do to help us move forward.”

It all gets back to Congress, and their lack of attention to our nation’s energy needs. I’ll have additional interviews coming your way in the days and weeks ahead from wind industry executives I’m interviewing at this show.

It will give us all a clearer picture as to the state of the offshore wind industry, and more importantly, where we should be focusing our investment dollars. Stay tuned.

Good investing,

David Fessler

Article by Investment U

The Bond King Does an About Face

By The Sizemore Letter

Outside of Fed Chairman Ben Bernanke, Pimco founder and Co-CIO Bill Gross is the most influential man in the global bond market.  When he speaks, investors listen.

It’s not for nothing that he is called the Bond King.  His firm manages over $1 trillion in assets, and his flagship fund—the Pimco Total Return Fund (PTTRX)—is the largest mutual fund in the world.  Yet despite the fund’s size and high profile (both of which make investing more difficult), Gross ranks in the top 1% of all bond funds in his category for the past 15 years.  According to Morningstar, the Total Return Fund has generated annualized returns of 7.2 percent over that period.  Not bad for a collection of boring, old bonds.

Gross has had a rough go of it in 2011, however. (See Even the Greats Make Mistakes, Part II).  The Bond King swung big with a much-hyped short of U.S. Treasuries…and struck out.

As a result, Gross has vastly underperformed the competition year to date.  The Total Return Fund has seen gains of just 1.9 percent, while the passive Barclays US aggregate bond index has enjoyed Gross-like returns of 6.7 percent.  Gross ranks in the 91st percentile this year.  This means that out of 100 bond fund managers, only 9 performed worse.  Ouch.

Even an investing demigod like Gross can have a bad trade.  But what separates a truly great investor like Gross  from the rest of the pack is his ability to dust himself off and jump back in.  He doesn’t let a bad trade—and, in his case, the bad press that comes with it—shake his confidence.  He simply adapts to the new reality and moves on.

So what is the Bond King buying today?

Mortgages.  Lots of mortgages.  And he’s even borrowing money to do it.

According to Reuters,   Gross went on a mortgage buying spree in September, raising the Total Return fund’s allocation to mortgage-backed securities to 38 percent in the belief that the Fed’s Operation Twist will boost their prices.  In the process, he increased the leverage of the fund from 9 percent to 19 percent.  When Mr. Gross bets, he bets big.

The move represents an abrupt U-turn for the Bond King.  His main rationale for shorting Treasuries earlier this year was his belief that long-term rates were too low and that they’d be rising once “QE2” was wound down.  But in aggressively buying long-duration mortgage bonds—and in using leverage to do it—Gross clearly believes that low long-term rates are here to stay for a while.

The Fed’s recent commitment to Operation Twist is certainly one reason for Gross’s bullishness towards long-dated bonds.  But looking at the bigger picture, lower rates are consistent with what Gross and his colleague Mohamed El-Erian have dubbed the New Normal—a prolonged period of sluggish growth and higher than usual unemployment.

In his October investment commentary, Gross identifies three “structural roadblocks” that should help keep growth muted and inflation low for the foreseeable future:

  1. The deflationary effects of globalization (Gross ties this to a populist argument about wage growth).
  2. The deflationary effects of technology
  3. Aging demographics that favor savings over consumption

If Gross is correct about inflation being benign—and I believe that he is—then investors should make income a major focus of their portfolios.

You could go the route of Gross and buy long-duration bonds.  But a better option might be to load up your portfolio with high-dividend paying stocks.  Most importantly, make sure that the stocks you pick have a history of growing or at least maintaining their dividends during even the most difficult economic conditions.  If a company can raise its dividend in a year like 2008, it’s likely to survive anything.

A few contenders for your portfolio:

StockTickerDividend Yield
Johnson & Johnson$JNJ

3.6%

Microsoft$MSFT

3.0%

Intel$INTC

3.7%

Altria$MO

5.9%

All but Microsoft (NYSE: $MSFT) currently yield more than the 30-year Treasury—which yields 3.15 percent at time of writing—and Microsoft is awfully close.  It should also be added that all of these companies have long histories of raising their dividends, whereas bond payments are fixed.

Whether you buy high-dividend stocks or follow Mr. Gross’s lead and buy long-dated bonds, make sure that you’re getting paid.  As the market action of 2011 has proven, capital gains can be elusive, but dividends allow you to realize real returns every quarter.   And in an environment of low inflation—or even mild deflation—those dividend checks will go a long way.

If you liked this article by Sizemore Insights, you’d probably enjoy The Sizemore Investment Letter, our premium members-only newsletter. Click here for more information.

US Data Set to Dominate Friday’s Market

By ForexYard

With an unusually intense news day ahead, traders are anxiously awaiting the large string of reports out of the US which should clear up the picture somewhat in regards to inflation, retail sales, and consumer confidence. The Federal Budget Balance will also be published, though its impact is not expected to be as high as the retail sales reports. Traders should look towards another bullish day on the dollar should news disappoint.

Economic News

USD – USD Bullish as Retail Sales Expected to Disappoint

The US dollar (USD) was seen trading mildly bullish Thursday ahead of retail sales reports out of the United States where many are expecting disappointment many investors seem to be anticipating. A sudden wave of risk aversion seems to have helped the greenback surge this week and data so far has only reinforced this momentum.

Additionally pessimistic data was released from several other economies as well. Switzerland inflation at the producer level appears to be in decline, industrial production across the euro zone and in Japan is stagnating, and the Australian housing market is contracting. The only optimistic piece of data out yesterday was the employment reports from Great Britain which saw, not necessarily job growth, but a not-as-bad-as-expected rate of unemployment growth.

With another unusually intense news day ahead, traders are anxiously awaiting the large string of reports out of the US which should clear up the picture somewhat in regards to inflation, manufacturing, and consumer confidence. The Federal Budget Balance will also be published, though its impact is not expected to be as high as the retail sales reports. Traders should look towards another bullish day on the dollar should news disappoint.

CHF – CHF in Steep Decline as Interest Rate Decision Approaches

The direction of the Swiss franc (CHF) has been sharply pressured into one of distinct bearishness among investors as the Swiss National Bank (SNB) rate decision approaches. Against the US dollar (USD) the franc has actually been trending mildly flat despite the greenback’s bullish moves against its other currency rivals. But the Swissie has seen some setbacks brought about by poor regional fundamentals and a general atmosphere of risk flight, particularly following the SNB’s move to peg the CHF to the value of the EUR at 1.20.

A mood of deep pessimism is growing in regards to the investment in Europe at the moment. Market bears still seem to be gnawing on the EUR’s strength, sapping its value as its peripheral members struggle with bond auctions and other financial woes. Switzerland was formerly in a position to capitalize on the flight to safety, but saw its exporting capability deeply gouged by an unremitting currency appreciation. The SNB move to peg the currency has so far done its job by keeping the CHF’s rise in check.

Sentiment in Switzerland appears to have turned negative this week as well, with many analysts and economists expecting moves towards safety by traders following the SNB’s rate statements. An attitude of dovishness has gained traction and investors are worried that a continuation of low rates, coupled with the possibility of a rate reduction in Europe in 2012, could diminish currency values as we get deeper into the third quarter.

AUD – Australian Reports Expected to be Positive on AUD

The Australian dollar (AUD) is expected to be propped up this week as market reports show mild expansion across the boards. Piling atop recent reports on Australia’s slowly expanding housing sector, recent publications of Australian consumer and business confidence is starting to show a somewhat disturbing contraction striking several sectors of Australia’s economy, as well as its psyche.

Expectations for these recent reports have been for modest growth, and in some instance, at best, zero movement. The week’s reporting has so far led many investors to pull away from the Australian dollar (AUD) in recent trading, but many are expecting a rebound. National data on housing and employment has also driven many investors away from the once-burgeoning AUD. This data, combined with dismal housing starts figures and building approvals reports, has so far dragged the Aussie lower and looks to continue doing so this week.

Oil – Crude Oil Sees Minor Uptick as Inventories Grow

Crude Oil prices gained mild support Wednesday as sentiment appeared to favor an uptick brought about by a mild uptick in US stockpiles. The weekly report revealed yesterday that the US has added roughly 1.3 million barrels to its reserves. This news has so far countered the notion of a sinking price of oil brought about by higher USD values and pushed oil into a bullish posture from supply shortfall speculations.

An expected dip in oil values due to this week’s risk sensitive environment, which saw the greenback climbing sharply, has so far not affected the price of physical assets in any clearly visible way. The stockpile report out Wednesday surprised many investors who had priced in a far milder decline in reserves. With this sentiment grabbing hold among many traders, oil prices could see resurgence above $90 a barrel in the near future.

Technical News

EUR/USD

A sharp decline in the value of pair and EUR/USD has put in serious technical damage when it closed below its long term uptrend from May 2010. Both weekly and monthly stochastics are falling as the pair undergoes a sharp correction. Support comes in at a range of 1.3400-25 from the February low and the 50% Fibonacci retracement from the bullish move that took the pair from the May 2010 low to the May 2011 high. The 61% retracement at 1.3040 is a significant mile marker while long term players may be focused on the January pivot of 1.2875. To the upside the July low of 1.3835 is the initial resistance, followed by the previously trend line which could prove to be resistive as often occurs with broken trend lines and this level is found at 1.3990.

GBP/USD

Three weeks of declines and cable has broken below its long term rising trend line from the May 2010 low. The pivot at 1.5780 is a significant support level which coincides with a 38% Fibonacci retracement from the May 2010 to April 2011 move. Below here the GBP/USD has support at the October lows/early January highs of 1.5650 followed by December pivot at 1.5350. Initial resistance may be found at 1.6080 followed by 1.6375 and the late August high of 1.6450.

USD/JPY

The yen has been range bound between its all-time low of 75.94 and 78.85 to the upside. Price action in the crosses has been much more volatile. Daily, weekly, and monthly stochastics are mixed and the next major resistance level is found at the post intervention high of 80.20 followed by the long term trend line from the June 2007 high which comes in at 81.00. A lack of support on the daily chart makes it difficult to predict a downside target but the big round number of 75 stands out.

USD/CHF

Last week the pair surged higher by almost 13% on the back of the SNB protective floor at 1.20 for the EUR/CHF. The USD/CHF continues to move higher and is now testing its falling trend line from November 2010 which comes in at 0.8890. This level has additional importance as it coincides with the 68% Fibonacci retracement from the November 2010 high to the August low. Both weekly and monthly stochastics are rising and with a break here the pair could extend its gains to the resistance at 0.8945 from the April 1st high. Support comes in at 0.8545 and 0.8250.

The Wild Card

S&P 500

The S&P 500 has been consolidating since its sharp decline in August and price action has formed a triangle chart pattern from the August 21st low that measures a potential move of 100 points. Forex traders can be prepared for a breakout in either direction though the current trend is to the downside. Initial support is found at 1,130 followed by the early August low of 1076. A break here could open the door to the August 2010 low of 1,037. To the upside resistance is located at the upper boundary of the triangle at 1,183 followed by the August high of 1,229 as well as 1,247 from the 61% Fibonacci retracement off of the July high.

Forex Market Analysis provided by ForexYard.

© 2006 by FxYard Ltd

Disclaimer: Trading Foreign Exchange carries a high level of risk and may not be suitable for all investors. There is a possibility that you could sustain a loss of all of your investment and therefore you should not invest money that you cannot afford to lose. You should be aware of all the risks associated with Foreign Exchange trading.

Monetary Authority of Singapore Eases Policy

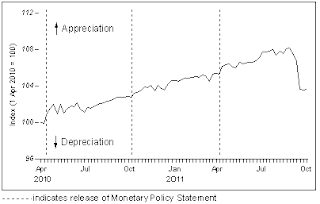
The Monetary Authority of Singapore eased monetary policy settings.  The MAS said: “Given the stresses and fragility in the advanced economies, the prospects for growth in Singapore’s major trading partners have deteriorated.  With the slowdown in demand, growth in the Singapore economy could fall below its potential rate of 3-5%.  Thus, core inflation should ease next year, although headline inflation could stay elevated in the near term reflecting the higher imputed rental cost of owner-occupied housing.  MAS will continue with the policy of a modest and gradual appreciation of the S$NEER policy band in the period ahead.  However, given the expected moderation in core inflation, the slope of the policy band will be reduced, with no change to the width of the band and the level at which it is centred.”

The Monetary Authority of Singapore moved to tighten monetary policy settings at its previous biannual monetary policy meeting in April, when it said it would “re-centre the exchange rate policy band upwards”.  The Singaporean economy contracted -6.5% q/q in the June quarter (27.2% in the March quarter), bringing year on year GDP growth to 0.9% (9.3% in March).  The Ministry of Trade and Industry said Singapore’s economy is expected to grow by 5-6% in 2011.


Singapore reported headline inflation of 5.6% in July-August, compared to 4.7% in Q2 2011, while core inflation was 2.2% in Q2.  The MAS said core inflation is likely to ease from an estimated 2.3% in Q4 to 1.5% by the end of 2012.  The Singapore Dollar (SGD) has gained about 1% against the US dollar so far this year, while the USDSGD exchange rate last traded around 1.27.

Central Bank of Egypt Keeps Monetary Policy Unchanged

The Central Bank of Egypt held its overnight deposit rate unchanged at 8.25%, the overnight lending rate at 9.75%.  The Bank said: “the slowdown in economic growth should limit upside risks to the inflation outlook. Given the balance of risks on the inflation and GDP outlooks and the increased uncertainty at this juncture, the MPC judges that the current key CBE rates are appropriate.”  On the inflation outlook the bank noted: “The probability of a rebound in international food prices is less likely now in light of recent global developments, nonetheless supply shortages in certain food commodities on the back of bad harvests could pose an upside risk to the inflation outlook.”

Previously the Bank also maintained its interest rates unchanged when it announced policy settings in August this year.  Egypt reported annual consumer price inflation of 8.21% in September, 8.49% in August, 10.4% in July, compared to 11.8% in June, 11.9% in May, and down from 12.1% in April.  The toll of the revolution was seen as Egypt’s gross national product contracted by 4.2% year-on-year in the third quarter of the 2011/2012 fiscal year and investment fell 26% due to uncertainty arising from the political upheaval.


Real GDP expanded by 0.4% in Q4 2010/2011, bringing full year GDP growth to 1.8% vs 5.1% in the 2009/2010 year.  The Egyptian pound (EGP) has weakened about 3% against the US dollar so far this year, while the USDEGP exchange rate last traded around 5.97

www.CentralBankNews.info

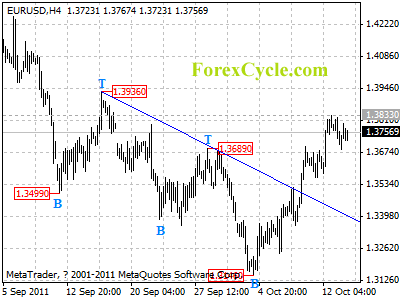
EURUSD remains in uptrend from 1.3146

EURUSD remains in uptrend from 1.3146, the pullback from 1.3833 is treated as consolidation of uptrend. Support is now at 1.3650, as long as this level holds, uptrend could be expected to resume, and another rise to 1.3950 area is still possible after consolidation. However, a breakdown below 1.3650 support could indicate that a cycle top has been formed at 1.3833 on 4-hour chart, and the rise from 1.3146 has completed.

eurusd