Housing Market Predictions

By MoneyMorning.com.au

If you’re a long-time reader of Money Morning you’ll know we made some housing market predictions about the Australian housing market crash. Did we get it right? Yes… and no.

We said it would crash. And in some states it already has – Queensland and Western Australia. In other states, such as South Australian and Tasmania, prices are moving lower (or “soft” as the spruikers like to put it).

Even in Victoria and New South Wales the gains have stopped and prices are falling. According to RPData, Melbourne house prices are down 4.4% over the past year. And as we see it, further falls are on the way.

That much we got right. What we didn’t get right was the timing. Our housing market predictions said prices would drop in 2009 and 2010. But they didn’t really start to hit the fan until the end of 2010 – remember that Queensland house prices started to slump before the floods.

So arguably you could have ignored our housing market predictions in 2008 and 2009 and made some good gains. Trouble is, by the time house prices started to drop in 2010 it was too late to benefit from the gains.

For most, paper profits went up in smoke.

But only now is the mainstream catching up. Today’s the Age reports, “House prices at risk from Europe crisis”. Again, nice advice… but where was the advice two years ago when it could have prevented over-leveraged first time buyers from making a terrible mistake.

It’s the same with stock market predictions. We’ve warned since the market started to rally in 2008 that the gains were illusory. It was all based on stimulus and false hopes.

Cheers.
Kris.

P.S. To find out where you can find the kind of small-cap stocks that could magnify your gains even in this market, click here now…

Related Articles

Totally Standard Hyper-Inflation

Is There Any Upside for Gold Investors?

The Gold Bubble and China

What a 2,300 Year-Old Coin Reveals About Gold

Gold Investing Far From a Bubble

From the Archives…

The Onward March of the State
2011-11-11 – Kris Sayce

Lose a Shirt, But Gain a Wardrobe
2011-11-10 – Kris Sayce

Neither a Borrower Nor a Seller Be…
2011-11-09 – Kris Sayce

Roman or Zimbabwean
2011-11-08 – Kris Sayce

Lighting a Match to Inflation
2011-11-07 – Kris Sayce

For editorial enquiries and feedback, email [email protected]


Housing Market Predictions

Stock Market Predictions

By MoneyMorning.com.au

“This has potential to be significantly worse than the Lehman Brothers collapse and the subprime crisis because now we are talking about nation states. If you have a situation like you had today, where markets had effectively frozen, then it doesn’t matter how good your name is, you are not going to be able to access markets. As of today, no banks could access these markets.” – Sir Ralph Norris, CEO, Commonwealth Bank of Australia

It would have been nice if Sir Ralph had warned us about this three years ago with a more timely stock market prediction.

It’s not as though no-one saw this coming.

In 2008 we warned you nothing good would come of government and central bank intervention. But the establishment and mainstream thought they knew better. They insisted everything governments and central banks were doing was necessary.

We got the stock market prediction right. The mainstream got it wrong.

Getting it Right… and Wrong

Tonight your editor is speaking at the Daily Reckoning Doomers’ Ball in Melbourne.

The theme of our speech is about making market predictions and having an investment back-up plan (something most mainstream investors don’t have).

We argue that making stock market predictions on the future is a crucial part of being an active – and successful – investor. But the most important part of market predictions is you don’t have to be 100% right.

In fact, as I’ll show tonight, you can be right and wrong… and still come out way ahead.

Let’s give you an example…

Playing Along With the Crowd

We advised our Australian Small-Cap Investigator subscribers to play along… buy into the rally. But when the boom started to peter out in late 2009 we advised readers to start cutting back.

As the chart below shows, it was good advice:

Stock Market

Source: CMC Markets Stockbroking

Today the stock market is back to mid-2009 levels. Most investors have made no gains in over two years!

Since mid-2009 most investors will have been better off holding cash than owning shares.

However, that doesn’t mean you should sell everything. Because as the six-month period from mid-2010 shows, even in a bear market you’ll still get bull market rallies.

That’s why it makes sense to have some exposure to the stock market. The key to good stock market predictions is to pick stocks that will give you the best bang for your buck if the market goes higher.

Put it this way. If you’ve only got 10-15% of your portfolio in blue-chip growth stocks, you won’t get much of a bang. The stocks will need to rise significantly to make it worth your while.

But, if you use small-cap stocks you can afford to invest less of your cash in stocks and keep more in safe assets (cash, term deposits, etc.). And because small-cap stocks tend to move higher quicker during a market recovery you’ll get plenty of bang for your buck.

We know that for a fact because our stock market predictions helped us play along during 2008-2009 and again from mid-2010.

But that’s in the past. What about today?

Nothing Left in the Arsenal… Or is There?

Well, we’ll be honest. We’re glad Sir Ralph Norris belatedly agrees with our view that the world economy is in a bunch of trouble. But unlike 2008, 2009 and 2010 it’s much harder to see where the positive news will come from.

After all, what more can governments and central banks do to fool the market into thinking they’ve got a magic bullet? They’ve tried everything – stimulus, money printing, bond buying, bailouts… none of it has worked… exactly as our stock market predictions said it wouldn’t.

However, as we say, even though we’re bearish we haven’t completely given up on the stock market. We’ve seen the extent to which governments and central bankers will go to manipulate the economy.

…Just like our own government tried to do with the Australian property market. You’ll find our housing market predictions weren’t that far off either.

But right now we can’t see that they’ve got anything left in their arsenal to artificially boost the market. Of course, that doesn’t mean they won’t try.

That’s why holding a small exposure to volatile (and high risk) stocks is a great way to potentially magnify your returns. Because with the stock market as it is, you should only have a small amount of your capital at risk.

Cheers.
Kris.

P.S. To find out where you can find the kind of small-cap stocks that could magnify your gains even in this market, click here now…

Related Articles

Totally Standard Hyper-Inflation

Is There Any Upside for Gold Investors?

The Gold Bubble and China

What a 2,300 Year-Old Coin Reveals About Gold

Gold Investing Far From a Bubble

From the Archives…

The Onward March of the State
2011-11-11 – Kris Sayce

Lose a Shirt, But Gain a Wardrobe
2011-11-10 – Kris Sayce

Neither a Borrower Nor a Seller Be…
2011-11-09 – Kris Sayce

Roman or Zimbabwean
2011-11-08 – Kris Sayce

Lighting a Match to Inflation
2011-11-07 – Kris Sayce

For editorial enquiries and feedback, email [email protected]


Stock Market Predictions

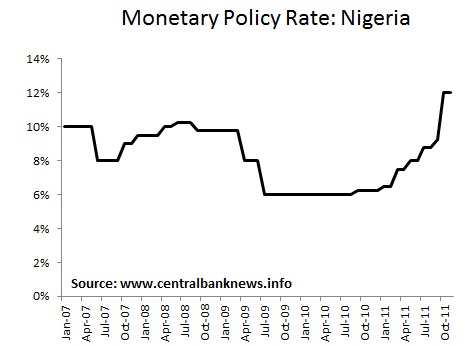
Central Bank of Nigeria Holds Rate at 12.00%

The Central Bank of Nigeria held its monetary policy interest rate unchanged at 12.00%.  The Bank also held the cash reserve ratio at 8%.  Bank Governor, Lamido Sanusi, said: “These decisions have helped in controlling pressures on the general price level and in maintaining a relatively stable equilibrium in the foreign exchange markets. Where this equilibrium is disturbed by external factors, the ability to respond rapidly has succeeded in quickly restoring stability.”


Previously the Nigerian central bank raised the the monetary policy rateby 275 basis points to 12.00% at its October meeting, after increasing by 50 basis points in September rate 75 basis points in July, and increasing it by 50 basis points at its May meeting this year.  Nigeria reported annual headline inflation of 10.5% in October, compared to 9.3% in August, down from 9.4% in July, 10.2% in June, 12.4% in May, 11.3% in April, and 12.8% in March, and just above the Bank’s inflation target of 10%.  

The Nigerian government doubled the minimum wage to 18,000 Naira recently.  Nigeria reported annual GDP growth of 7.72% in the June quarter, after growing 7.43% in the March quarter, while the Bank is forecasting 2011 growth of 7.8%.  
Nigeria’s currency, the naira (NGN), has weakened about 4% against the US dollar so far this year, the USDNGN exchange rate last traded around 159.5.

Investment: Destination India

India is a country with huge manpower that is equipped with enormous skills and this is one reason for investing in India and evident in the growing number of foreign companies and overseas investors. Despite this and the fact that Indian economy belongs to one of the most conspicuous economies around the world, there has been a sharp fall in economic growth that was earlier projected to grow rapidly at least in the long run. The performance or behavior of the Indian economy has particularly fallen in the short to medium term.

During the period of last five years that refers to the time exactly before the recession and the global financial crisis the economic growth was around seven percent on a yearly basis. Due to this strong and impressive growth, investing in India seemed to be a favorable prospect for the overseas companies and we have witnessed the arrival of several foreign companies in this country. The IT and service sector industries have provided an impetus to the economic growth and according to the financial analysts, within a very short time India will join the frontrunner and powerful economies of the world.

During the passage of time, foreign direct investment has emerged as one of the most significant and inalienable aspect of the Indian residents who are settled in foreign countries or NRI’s. On the basis of a survey called World Investment Prospects Survey conducted for 2010 to 2012, India is also one of the most preferred destinations of foreign direct investment. This survey was conducted by United Nations Conference on Trade and Development. In addition to this, another survey conducted by one of the big four firms Ernst and Young, the country has ranked fourth as far as foreign investing is concerned and it is referred to as European Attractiveness Survey.

The growth of foreign investment in India has increased three folds with a variety of business prospects and potential that is available in this country.

However, at the same time, there is an increased need for a guideline on strategic investments so that the foreign investors keep pouring in. In other words, to have a better orientation of foreign investments and to maintain the flow of foreign investors, it is possible to get the expert’s guidance in the Government website that is referred to as OIFC.

According to the opinion of several people, the success of India with foreign investments and economic growth has been showing all along though the journey was not always pleasant as there has been an equal amount of delay during this process. Whether the high growth forecasts for the economy helps to provide a boost to the Indian economy or otherwise cannot be predicted immediately. With the country has opening doors to the foreign and domestic investors, the risks of investing in a developing economy should be reduced to a large extent.

About the Author

Harjeet is an Indian – born mass-market novelist, who covers the world internet related topics . He writes columns and articles for various websites and internet journals in the domain of Investing in India and Investment options.

Egypt Central Bank Hikes Rate 100bps to 9.25%

The Central Bank of Egypt increased its overnight deposit rate by 100 basis points to 9.25% from 8.25%, and the overnight lending rate by 50 basis points to 10.25% and 7-day repo to 9.75%.  The Bank said: “In its meeting held on November 24, 2011, the Monetary Policy Committee (MPC) decided to raise the overnight deposit rate by 100 bps to 9.25 percent while raising the overnight lending rate and the 7-day repo by 50 bps to 10.25 percent and 9.75 percent, respectively. The discount rate was also raised by 100 bps to 9.5 percent.”


Previously the Bank maintained its interest rates unchanged when it announced policy settings in October this year.  Egypt reported annual consumer price inflation of 8.21% in September, 8.49% in August, 10.4% in July, compared to 11.8% in June, 11.9% in May, and down from 12.1% in April.  The toll of the revolution was seen as Egypt’s gross national product contracted by 4.2% year-on-year in the third quarter of the 2011/2012 fiscal year and investment fell 26% due to uncertainty arising from the political upheaval.

Real GDP expanded by 0.4% in Q4 2010/2011, bringing full year GDP growth to 1.8% vs 5.1% in the 2009/2010 year.  The Egyptian pound (EGP) has weakened about 3% against the US dollar so far this year, while the USDEGP exchange rate last traded around 6.00

Gold & Silver “Need Dollar to Weaken” as Debt Downgrades Strike Portugal & Egypt, Threaten US and Japan

London Gold Market Report
from Adrian Ash
BullionVault
Thurs 24 Nov., 08:55 EST

The WHOLESALE-MARKET gold price briefly crept back above $1700 per ounce once again on Thursday morning in London, rising faster in Sterling and Euros as they slipped back versus the Dollar on the forex  market.

With New York shut for Thanksgiving, Japan’s Nikkei index fell to its lowest level since April 2009, but European stock markets bounced hard from this week’s 6% drop.

Germany’s Dax index remained 10% lower from the start of November, however.

“[The gold price] has been propped up by physical demand,” says the commodities team at Standard Bank in London, “as buyers see current prices as particularly lucrative, while silver has been riding on gold’s coat tails.

“For any significant move upward in precious metals, we’d need to see the Dollar weaken,”

Thursday lunchtime saw the gold price in Euros trade 2.2% higher for the month-to-date.

Silver prices pushed back above $32 per ounce in London trade.

Following Wednesday’s poor auction of new German debt, 10-year German yields meantime traded above UK gilt yields for the first time in 30 months, with 10-year British debt offering new buyers just 2.2% annual return.

Consumer price inflation in the UK slipped from 5.2% per year to 5.0% in October according to official data.

German consumer-price inflation ticked up to 2.9%.

“We do not want Eurobonds, because we do not want German interest rates to rise dramatically,” Germany’s minister for economic affairs Philipp Rösler in a speech to the Bundestag this morning.

“There is urgency. We will talk about [ECB intervention] today in Strasbourg,” said French foreign minister Alain Juppé to France Inter radio this morning, ahead of a meeting between French and Italian prime ministers Nicholas Sarkozy and German chancellor Angela Merkel.

The Irish government meantime asked its political-union partners to share the cost of its €63 billion ($84bn) banking bail-out of late 2008, saying that Ireland has “borne a disproportionate share of protecting the European banking system.

“Where you have reckless borrowing you have reckless lending,” said finance minister Michael Noonan.

Last week Noonan expressed “disappointment” that details of Ireland’s 2012 budget had been sent to the German Bundestag six weeks before Dublin’s parliament will see them, to comply with German laws regarding spending such as Berlin’s share of the €85bn bail-out of the Irish state.

Portugal’s credit status was today downgraded to “junk” by the Fitch ratings agency, as a general strike over Lisbon’s budget cuts closed public services and transport.

Moody’s warned on US debt, saying that if Congress reduces the size of budget cuts for 2012, it “could have negative rating implications”, while Standard & Poor’s Tokyo director said Japan is moving “closer to a downgrade” because its “finances are getting worse and worse every day, every second.”

Citing its latest political turmoil, S&P analysts also cut Egypt’s debt rating for the second time in five weeks.

Cairo today paid a record 14.4% on 6-month loans totaling $362 million – barely half the sum it had sought from investors.

Crude oil prices meantime pushed higher from a two-week low, but agricultural commodities fell sharply.

Base metals rallied from a 5-week low, led by copper after Barclays Capital raised its 2011 deficit forecast by 10% to 536,000 tonnes, matching the demand-supply gap estimated Tuesday by BofA Merrill Lynch.

The Indonesia Tin Association today asked exporting giant PT Timah to suspend all shipments “to support global prices” reports Bloomberg.

“[This week’s] slump in the gold price is mainly US Dollar-driven,” says a note from analysts at Commerzbank in Luxembourg.

“Gold calculated in Euros has been able to rise.”

“For now,” says the latest technical analysis of the Dollar gold price from Scotia Mocatta in New York, “we continue to hold onto our medium-term bullish outlook.”

“Immediate upside targets are the 55-day moving average at 1723.82 and the 1753.07 October peak.”

Adrian Ash
BullionVault

Gold price chart, no delay   |   Buy gold online at live prices

Formerly City correspondent for The Daily Reckoning in London and head of editorial at the UK’s leading financial advisory for private investors, Adrian Ash is head of research at BullionVault – winner of the Queen’s Award for Enterprise Innovation, 2009 and now backed by the World Gold Council market-development and research body – where you can buy gold today vaulted in Zurich on $3 spreads and 0.8% dealing fees.

(c) BullionVault 2011

Please Note: This article is to inform your thinking, not lead it. Only you can decide the best place for your money, and any decision you make will put your money at risk. Information or data included here may have already been overtaken by events – and must be verified elsewhere – should you choose to act on it.

The Best Trade You Can Make in November

The Best Trade You Can Make in November

by Alexander Green, Investment U Chief Investment Strategist
Thursday, November 24, 2011: Issue #1650

In December 1996, I sold some shares of Best Buy (NYSE: BBY) to offset gains elsewhere in my portfolio.

I still consider it the most boneheaded investment move I ever made. A year later, the stock was up more than five-fold. A few years further on, it was up more than thirty-fold.

The worst part is that I didn’t dislike the business prospects for Best Buy at the time. Quite the contrary, in fact. I sold it only because I had substantial capital gains and was cleaning out my portfolio to offset them.

I don’t always do that any more. And you shouldn’t necessarily, either. Despite what your tax advisor may tell you, you should never sell an investment for tax reasons alone. Nor do you have to.

Here’s why…

The IRS allows you to offset realized gains with realized losses each calendar year. If you do, however, you must wait at least 30 days before buying the same shares back. (Otherwise you run afoul of the wash-sale rule.)

Offsetting gains at the end of the year is often a sensible move. Most stocks aren’t appreciably higher 30 days later. And if you still like them, you can buy them back then.

There is a risk, however, and it’s called the January effect. The first month of the year is traditionally a strong one for the market. A lot of pension and IRA money gets invested early each year. Plus, there’s often a rebound from the tax-loss selling that goes on each December.

If a stock you own soars in January, there’s a natural reluctance to buy it back. The temptation is to wait until it comes back down. But what if it doesn’t? You’ve taken a limited loss but sold an investment with unlimited upside potential.

There’s a way around this problem, however. And you can take advantage of it – but only if you’re willing to move this week.

In late November each year, I look at my entire portfolio for any companies that are trading below my entry price but NOT near my trailing stops. If I still like a stock, I often make the decision to double down on it for 30 days.

Why? Because I can sell the original shares at the end of December for a tax loss. And if the stock rallies in January, it’s not a problem. After all, thanks to my purchase in November, I own the same number of shares as I bought originally.

What if you don’t have the cash to double down on your position? Use margin. Again, I’m recommending this only for a 30-day period. Your margin interest charge will be minimal.

The risk, of course, is that your shares will be worth less in late December and you will have a paper loss on the second purchase.

However, just the opposite may happen. Remember, the January effect is often preceded by the Santa Claus rally, the tendency of the stock market to do well in the second half of December. As a result, you could end up with a smaller loss in your original shares and a paper gain on your second purchase.

(The Santa Claus rally is never certain, of course, and another reason why you should only add to those companies whose earnings prospects remain strong.)

Bear in mind, when selling for tax purposes, the IRS requires that you buy those identical shares AT LEAST 30 days before you sell the others. So if you want to use this strategy for 2011, you must act this week.

If we have the traditional mid-December to early February rally, you’ll thank me. And then perhaps again on April 15.

Good investing,

Alexander Green

Article by Investment U

An Argument for QE3

By ForexYard

The argument for the Fed to begin another round of quantitative easing (QE3) is beginning to form.

Economic News

USD – Why the Fed will Start QE3

The release of the Fed’s meeting minutes from their previous FOMC meeting on November 2nd show that “A few members indicated that they believed the economic outlook might warrant additional policy accommodation,” The meeting minutes also noted that any announcement would be more effective in a future communications initiative.

Past comments from Fed Chairman Ben Bernanke have been supportive of additional monetary policy moves. On September 29th in Cleveland, Ohio, Bernanke said, “If inflation itself falls too low or inflation expectations fall too low, that would be something we’d have to respond to because we don’t want deflation.” Given last week’s headline CPI that showed a -0.1% contraction in m/m inflation during October it appears that inflation pressures have already begun to decline in the US economy. It is also important to note the downward revision to Q3 GDP to 2.0% from 2.5% and a stubborn unemployment rate stuck at 9.0%.

With the European debt crisis appearing to intensify, it is possible then that Bernanke and the Fed will act to support the US economy with another round of quantitative easing (QE3) which in all likelihood will be a negative for the USD.

EUR – Weak German Bund Auction Sinks EUR

The EUR came under renewed selling pressure following one of the worst German bund auctions. The powerhouse of the EU economy failed to sell the full EUR 6 bn of new 10-year bunds that were offered to the market. Investors were quick to sell the EUR after the disappointing auction and the currency slipped to its lowest level in 6-weeks.

Prior to the failed bund auction the EUR was pressured by weak PMI numbers which continue to show a deterioration of European fundamentals. The EU flash PMI was under the 50 boom/bust level for the third consecutive month with the manufacturing survey falling to 46.4. The services sector was slightly better at 47.8 but still far below the 50 level.

The weak PMI surveys support the theory of a euro zone economy that is slipping into recession just as the European debt crisis is coming to a head. Investors will likely remain bearish on the 17-nation currency with most traders eyeing the October low at 1.3145. The 1.3580 level from the top of this week’s consolidation pattern will likely cap any short-term rally.

AUD – Weak Chinese PMI Hurts AUD

Yesterday’s release of the Chinese PMI manufacturing survey showed a sharp drop in the November numbers, falling to 48 from 51 to a 32 month low and far below the 50 boom/bust level. The disappointing data release is another sign of the cooling Chinese economy.

The weak survey numbers have put pressure on the AUD which is off sharply versus the USD. The potential restructuring of the Dexia bailout and a disappointing German bund auction did little to support the high yielding Australian dollar. With the USD continuing to strengthen and the situation in Europe intensifying the October low of 0.9385 looks more vulnerable. A decisive breach below the Q3 low of 0.9700 will support additional AUD selling.

Crude Oil – Crude Oil Declining in Risk Off Environment

Spot crude oil prices continue to struggle after peaking in mid-November. The commodity has been unable to regain its footing after peaking at $103 on improved US economic data and tensions in the Middle East. With an intensification of the European debt crisis and PMI surveys that show slowing economies in both Europe and China it will be difficult for the crude oil prices to bounce back. The approaching US holiday will keep volumes light and an absence of economic data may have crude oil trading within a range between $103 and $94.

Technical News

EUR/USD

There is a bullish wedge pattern that has formed on the EUR/USD daily chart. The falling resistance line is off of the October high and the support line falls off the November 1st low. Resistance is found at 1.3615. A break here and the EUR/USD could test the November highs near 1.3850. Should the pair continue its trend lower the pair could encounter support at the rising trend line from the January 2010 and October 2011 lows at 1.3270. Traders may be eyeing the October low of 1.3145 followed by a deeper move to the 2011 low of 1.2875.

GBP/USD

After breaking lower from the late October-mid November consolidation pattern the GBP/USD rose back to the previous support line at 1.5850 only to turn lower once again. This is a textbook retracement to a previously known support that has now turned into resistance. Support may be found at the October 18th low of 1.5630 followed by the October low of 1.5270. Resistance comes in at the top of the previous consolidation pattern at 1.6075.

USD/JPY

The slow decline of the USD/JPY back to its all-time low at 79.60 continues while the charts show very little support to prevent the move. Any attempt to bid the pair higher may encounter selling pressure at the November 15th high of 77.50 followed by the long term downtrend from the June 2007 high which comes in at 79.10.

USD/CHF

The rally from the late October low continues to gain steam as the pair approaches the October high of 0.9310. Both weekly and monthly stochastics continue to move higher. A break of 0.9310 will expose the 20-month moving average at 0.9450 followed by the February high of 0.9770. Support is off of the November 3rd low of 0.8760 which coincides with the 100-day moving average. While perhaps a bit extreme the pair may eventually target the falling trend line off of the 2003, 2008, and 2010 highs which comes in at 1.1200.

The Wild Card

EUR/CAD

A false breakout from the post October 25th consolidation pattern has sent the pair lower after the EUR/CAD made three failed attempts to close above the top of the chart pattern at 1.4030. With daily stochastics beginning to turn over the pair could test the bottom support of the consolidation pattern which comes in at 1.3730 off of the October and November lows. Forex traders should note that a move above the October high of 1.4170 would indicate bullish sentiment.

Forex Market Analysis provided by ForexYard.

© 2006 by FxYard Ltd

Disclaimer: Trading Foreign Exchange carries a high level of risk and may not be suitable for all investors. There is a possibility that you could sustain a loss of all of your investment and therefore you should not invest money that you cannot afford to lose. You should be aware of all the risks associated with Foreign Exchange trading.