Dec. 2 (Bloomberg) — Stryker McGuire, senior editor of Bloomberg Markets, talks about the magazine’s annual survey of economists, which ranks London-based Standard Chartered Plc as the No. 1 firm in the world for economic forecasting. McGuire speaks with Francine Lacqua on Bloomberg Television’s “Countdown.”
Forex CT 2-12-11 Video News Update
Video courtesy of ForexCT – A leading Australian forex broker, liscensed by the Australian Securities & Investments Commission, offers the MetaTrader4 and PROfit Platform to retail traders. Other services include Segregated Accounts, Trading workshops, Tutorials, and Commodities trading.
Staying Skeptical of Todays Non-Farm Payrolls Report
Today’s non-farm payrolls report is expected to show improvement in US employment data as many economists have upped their forecasts following the strong ADP report. However, traders may want to remain skeptical as US unemployment is still at uncomfortably high levels.
Economic News
USD – Staying Skeptical of Todays Non-Farm Payrolls Report
Over the past few weeks there is a noticeable trend of better US economic data. Just this week we’ve had strong consumer confidence numbers, a large increase in pending home sales, as well as yesterday’s ISM manufacturing PMI survey. While these factors all point to increased momentum for US growth the employment situation remains tepid at best. The unemployment rate remains stubbornly high at 9.0% and yesterday’s weekly unemployment claims rose to 402K, the highest level in more than a month.
This week’s ADP non-farm numbers may also give a false sense of security leading up to today’s NFP report from the Labor department. Despite the solid unemployment numbers on Wednesday from the private payrolls provider, the ADP report does not have a particularly good history of predicting the government’s official data. Therefore, we remain skeptical of any solid recovery in the US employment picture which would likely be a negative for market sentiment and a positive for the USD.
EUR/USD support is found at 1.3270 at the upper line of the bearish wedge followed by the October low of 1.3145. Resistance is 1.3610 from the November 18th high.
EUR – Draghi Suggests Greater EU Integration
In a speech yesterday ECB President Mario Draghi suggested closer fiscal integration is necessary for the euro zone, “We might be asked whether a new fiscal compact would be enough to stabilize markets and how a credible longer-term vision can be helpful in the short-term. Our answer is that it is definitely the most important element to start restoring credibility… Other elements might follow, but the sequencing matters.” The statement by Draghi is significant as it suggests the ECB may commit itself to aiding distressed euro zone countries once the proper fiscal checks and balances are implemented. The ECB has always maintained the position that the European debt crisis is fiscal crisis and not a monetary crisis. Should the ECB step in with its full firepower to support the likes of Greece, Italy, Spain, and Portugal, this will be a catalyst for the EUR. Today German PM Angela Merkel will deliver a speech to the Germany parliament outlining potential steps to further integrate Europe with budget coordination. Could this be the first step towards a more integrated Europe and a stronger EUR?
CHF – Negative Interest Rate Rumor Fuels CHF Weakness
The EUR/CHF was on a rollercoaster ride yesterday as the CHF weakened versus both the USD and the EUR. The trigger for the CHF moves were rumors of the Swiss government debating a negative interest rate to help weaken the currency. Recent economic data in Switzerland has been on the weak side with GDP coming in at only 0.2% in Q3 and the KOF economic barometer falling to 0.35 from 0.75. Market expectations are for additional moves by the SNB to weaken the franc as the threat of deflation continues to weigh on the Swiss economy. This could take the form of raising the floor of the EUR/CHF to 1.25 from 1.20. The EUR/CHF has resistance at October 19th high of 1.2470 with support at its 200-day moving average at 1.2225.
Wheat – Wheat Prices Underperform
Wheat prices have begun to recover from their November lows but the commodity continues to underperform. In light of the strong equity gains on Wednesday this could be considered bearish price action as we would expect wheat prices to rise much further as market sentiment improves. Currently wheat prices are locked in a long term downtrend with support at the November low of $571 and resistance at the November 1st low of $611.
Technical News
EUR/USD
The EUR closed last week below the psychologically important 1.35 level and a close below it on the monthly chart will carry an even greater significance. Both monthly and weekly stochastics continue to fall and a break of 1.3210 will likely test the October low of 1.3145. Below here at 1.3040 there is the 61% Fibonacci retracement of the move from June 2010 to May2011 though this may only prove to be a mile marker in the new downtrend for the pair. Support is located at the January low of 1.2870. The November 18th high of 1.3610 stands out as resistance.
GBP/USD
Falling monthly and weekly stochastics may have the GBP/USD testing the October low of 1.5270 as the pair is pulling within striking distance of its long term uptrend from the 2009 low which comes in at 1.5050. Any move higher will likely encounter heavy selling from the July pivot at 1.5780.
USD/JPY
The downtrend for the USD/JPY remains firmly intact and only a break above 78.95 from the falling trend line from the 2007 high may reverse the pair’s bearish technical sentiment. A break above this line may have the pair testing the most recent post-intervention high of 79.50, a level that coincides with the pair’s 200-day moving average. To the downside the November 18th low of 76.55 is the initial support, followed by the all-time low of 75.56.
USD/CHF
The USD/CHF is testing its October high at 0.9310 and a break here will likely open the door to the pair’s 20-month moving average at 0.9460 and the February high of 0.9775. Initial support is located at the November 18th low of 0.9080 with a deeper move perhaps taking the pair to the November low of 0.8760.
The Wild Card
S&P 500
The stock index found resistance at 1,250 which is not only a big psychological number but the value also comes in at the resistance line off the October and November highs. Forex traders should note that a failure to break higher here and the index could turn lower to its first support level at 1,208 from the November 1st low. A continuation of the move higher and the next resistance is the October high of 1,288.
Forex Market Analysis provided by ForexYard.
© 2006 by FxYard Ltd
Disclaimer: Trading Foreign Exchange carries a high level of risk and may not be suitable for all investors. There is a possibility that you could sustain a loss of all of your investment and therefore you should not invest money that you cannot afford to lose. You should be aware of all the risks associated with Foreign Exchange trading.
Central Bank of Kenya Hikes Rate 150bps to 18.00%
The Central Bank of Kenya upped its benchmark lending rate by 150 basis points to 18.00% from 16.50% previously, and held the Cash Reserve Ratio at 5.25%. The central bank Governor, Njuguna Ndung’u, said: “The Committee noted that although supply shocks continued to drive domestic prices upwards, demand driven inflation pressures arising from the growth of private sector credit continued to persist. In addition, it was noted that there were exchange rate risks emanating from uncertainty in the global financial markets due to the debt crisis in the eurozone. In order to address these risks, the Committee considered it necessary to further tighten the monetary policy stance at the margin.”
At its previous meeting the CBK increased the interest rate by 550bps to 16.50% and raised the Cash Reserve Ratio by 50bps to 5.25%. That move followed a 400bp increase of the interest rate to 11.00% at its October meeting, after raising 75bps in September, and previously increasing, and subsequently decreasing the discount window rate by 75 basis points to 6.25%. The Kenyan central bank last increased the benchmark lending rate by 25 basis points in May this year.
Kenya experienced annual headline inflation of 19.72% in November, up from 18.91% in October, 17.3% in September, 16.7% in August, up from 15.5% in July, and up sharply from 9.19% in March this year, according to inflation data from the Kenya National Bureau of Statistics. The Central Bank of Kenya has an inflation target of 5 percent.
Kenya reported seasonally adjusted GDP growth of -4.6% in Q2, compared to +2% in Q1. A Kenyan Ministry of Finance official noted that Kenya is expected to record economic growth around 5-5.5% this year, and 6% next year.
The Kenyan Shilling (KES) has weakened about 11% against the US dollar so far this year (having weakened by as much as 31%); meanwhile the USDKES exchange rate last traded around 89.95
Kenya experienced annual headline inflation of 19.72% in November, up from 18.91% in October, 17.3% in September, 16.7% in August, up from 15.5% in July, and up sharply from 9.19% in March this year, according to inflation data from the Kenya National Bureau of Statistics. The Central Bank of Kenya has an inflation target of 5 percent.
Kenya reported seasonally adjusted GDP growth of -4.6% in Q2, compared to +2% in Q1. A Kenyan Ministry of Finance official noted that Kenya is expected to record economic growth around 5-5.5% this year, and 6% next year.
The Kenyan Shilling (KES) has weakened about 11% against the US dollar so far this year (having weakened by as much as 31%); meanwhile the USDKES exchange rate last traded around 89.95

How to Profit from Silver with the Inevitable Return to Sound Money
By MoneyMorning.com.au
$203 Silver
Our old pal, Diggers & Drillers editor, Dr. Alex Cowie likes gold… but he likes silver more.
In fact, he’s got his sights set on silver clocking up a 525% gain in the next eight years. If you think that’s a crazy number, it’s actually one of the more conservative medium term forecasts we’ve seen!
If he’s right, that would take the silver price to USD$203 an ounce… more than six-times the current price of USD$32.72… or an annual growth rate of around 65.6% per year. Try getting that from stocks.
So, how does the Doc back up his claim?
Well, part of it is contained in one of the most remarkable charts we saw at the Daily Reckoning Doomers’ Ball last Friday. He also included it in his latest issue of Diggers & Drillers:

Sources: Silver Institute, Diggers & Drillers
As the Doc wrote in his latest double issue:
“For years, industrial users of silver dominated the market. They used it for a wide variety of applications, like solar panels, electronics, photography as well as jewellery.
“But after big cracks started to appear in the financial system in 2007, the silver market started changing. Investors began muscling in to secure a bigger chunk of the market. In 2007 investors accounted for just 6% of silver demand. By last year this had increased fivefold with investors accounting for 29% of demand.”
Compare that to the latest numbers from the World Gold Council (WGC). The WGC notes that right now, industrial and dental use accounts for just 11.4% of gold demand. Jewellery accounts for 50.4%. And the rest – 38.1% – is used in investments.
By that metric, silver still has a way to go to catch up with gold. But once it gets there, we doubt the investor demand will fall back.
A Bumpy Ride for a 525% Gain
Of course, it’s important to remember (and the Doc admits this), silver’s journey from $32.72 to $203 won’t be a straight line. There will be plenty of bumps along the way.
As we see it, the silver price will react in the same way as every other asset that has burned investors. It will take a while for the disappointment to wear off, and then before you know it… whoosh; it’ll be out of sight.
Look at the five-year silver price chart:

While there are plenty of investors who bought between $10-$20. There are many more who bought between $30 and $50.
And the longer the silver price trades in the current range ($30-$35), the more disappointed they’ll become.
But it’s not all bad news. In fact, it’s great news if you’re looking to build up a position in silver over the coming years. Because you’re likely to get plenty of opportunities to buy at a cheap price as disappointed sellers keep the price down.
Quite how long it will take before this is worked out of the silver price is anyone’s guess. But we wouldn’t be surprised if prices stayed around this level for another year or more.
But longer term, the case for silver makes at least as much sense as the case for gold. For one reason: throughout history silver was used as everyday money – the U.K. pound sterling is so-called because it was measured in silver.
Ultimately, we’ll see a return to sound money. And odds are investors will use silver as a way to bet on that outcome. And as usually happens when investors bet on something, they go too far.
Mainstream Calls for More Money Printing
But the more we see events like this week’s central bank bailout, and commentators such as Bell Potter’s Charlie Aitken telling Peter Switzer in an interview…
“The only thing that can happen is the ECB will print money… don’t you want some inflation, some growth… of course you want the ECB to intervene. Look at [what] the Bank of England has done in England. They’ve stabilised the U.K. economy – stabilised – by money printing. What’s the Fed done in America? Huge scale money printing…”
…the more we’re convinced governments and central banks will intervene for years to come. That won’t be good news for most people as inflation eats away at their hard-earned savings.
But if you own gold you can expect to at least maintain your standard of living.
And if you also own a small amount of price-volatile silver, you should expect to improve your standard of living as we edge closer to (and the market bets on) the inevitable return to sound money.
Cheers.
Kris.
P.S. Dr. Cowie recently devoted an entire issue of Diggers & Drillers to the buying and storing of physical precious metals (including silver). If you’d like to find out how to buy and hold gold and silver… plus receive the Doc’s resource stock tips, be sure to check out the details here…
Related Articles
Why the Fed’s Actions Make Perfect Sense
Swiss National Bank Intervenes…
Bailouts Still Boosting the Market
Was This Just Another Rigged Market?
From the Archives…
Stock Market Predictions
2011-11-25 – Kris Sayce
Stocks on the Australian Market Today – Three Things You Need to Know
2011-11-24 – Shae Smith
The Gospel of Gold and Silver
2011-11-23 – Kris Sayce
China’s Bubble Will Pop in 2012
2011-11-22 – Greg Canavan
ASX Stock Market Winners, Losers and the Newly Dumped
2011-11-21 – Aaron Tyrrell
For editorial enquiries and feedback, email [email protected]
How to Profit from Silver with the Inevitable Return to Sound Money
Why Gold Should Become Your ‘Stay Rich’ Asset
By MoneyMorning.com.au
We’ve written many times about the gold price.
Long term, our view is the price of gold will go much higher.
Whether it goes as high as $35,000 or $50,000 an ounce claimed by the experts at the Gold Symposium is another story.
And as we’ve warned, if it does reach that height, it’s unlikely gold owners will be clinking glasses of Krug champagne on their luxury yacht in Monaco.
Simply because we don’t look at gold as a get rich asset. It’s more of a stay rich, stay reasonably well off… or at the extreme, it’s a poverty-prevention asset.
The main reason to hold gold is to protect your savings against covert government and central banking theft (inflation). Something they’ve successfully done for the past 40 years.
Convincing everyone that prices are going up rather than what’s really happening – central banks devaluing your money.
That’s why we don’t suggest you put all your assets in gold. Because if you’re like most people, rather than maintain your standard of living, you’d prefer to improve it.
One way of doing that is with a different precious metal. One that we believe is undervalued and worth a small exposure in your portfolio (say 5-10%).
And a good way to find out more about this precious metal is by reading what Diggers and Drillers Editor, Dr Alex Cowie has to say …about silver.
Cheers.
Kris.
Related Articles
Why the Fed’s Actions Make Perfect Sense
Swiss National Bank Intervenes…
Bailouts Still Boosting the Market
Was This Just Another Rigged Market?
From the Archives…
Stock Market Predictions
2011-11-25 – Kris Sayce
Stocks on the Australian Market Today – Three Things You Need to Know
2011-11-24 – Shae Smith
The Gospel of Gold and Silver
2011-11-23 – Kris Sayce
China’s Bubble Will Pop in 2012
2011-11-22 – Greg Canavan
ASX Stock Market Winners, Losers and the Newly Dumped
2011-11-21 – Aaron Tyrrell
For editorial enquiries and feedback, email [email protected]
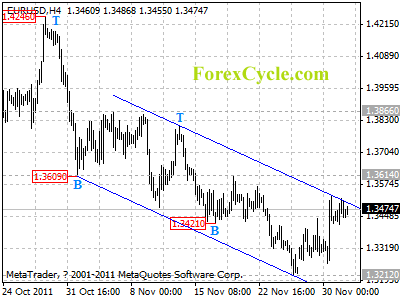
EURUSD is testing channel resistance
EURUSD is testing the resistance of the price channel on 4-hour chart. As long as the channel resistance holds, the price action from 1.3212 could be treated as consolidation of downtrend from 1.4246, and one more fall towards 1.3146 (Oct 4 low) is still possible. On the upside, a clear break above the upper line of the channel will indicate that the downward movement from 1.4246 had completed at 1.3212 already, then the following upward move could bring price back to 1.3900 zone.
Investing in Home Depot (NYSE: HD)
Investing in Home Depot (NYSE: HD)
If You Can’t Buy or Sell It: Fix It
by Jason Jenkins, Investment U Research
Friday, December 02, 2011
Tuesday on CNBC’s “Closing Bell”, Maria Bartiromo had a little Q&A with Senior Equity Research Analyst Alan Rifkin of Barclays Capital and Homebuilder Analyst Buck Horne of Raymond James called “Taking Stock in Housing.”
As you can expect, it wasn’t the cheeriest of conversations…
There was the usual talk of too many foreclosures in the pipeline, a glut of vacant homes on the market, Baby Boomers downsizing and the inability of younger generations to come up with the means in order to buy a home in this new housing/mortgage environment due to strict credit and capital guidelines.
But as a good moderator should, Bartiromo pressed the issue for hidden gems – or whether there was anything in the sector that deserved our investment attention. On the homebuilder front, there’s a phenomenon called the “Hope Trade,” where annually from the middle of November to Super Bowl Sunday there’s an uptick with major homebuilders.
However, those industry fundamentals are absolutely horrible after the NFL football season and in the foreseeable future.
A Gem in a Rough Market
What was more interesting is the current trend to fix what you got because you can’t trade up. And this is where Home Depot (NYSE: HD) comes in. We need to look at how they boosted profitability in a bad housing market.
According to an interview with Home Depot Chief Financial Officer Carol Tome, consumers continue to spend money to maintain their homes, lifting same-store sales of transactions over $900 by 3.6 percent, including increases in more discretionary categories such as kitchen cabinets.
“We see the core repair projects remain strong,” Tome said. “We do see some movement in big-ticket items.”
A Strong Third Quarter
Two weeks ago, when the Atlanta-based company announced its third-quarter numbers, it raised its full-year earnings outlook to $2.38 a share from $2.34 a share and increased its dividend by 16 percent to $0.29 a share. Dividend increases are good right now.
Last quarter’s net income rose to $934 million, or $0.60 a share, from $834 million, or 51 cents, a year earlier. Sales rose 4.4 percent to $17.3 billion. Comparable-store sales rose 4.2 percent, including a 3.8-percent increase in the United States.
Analysts, on average, had estimated Home Depot would earn $0.59 cents a share on sales of $17.1 billion, according to FactSet. Same-store sales topped the 2.9 percent gain analysts surveyed by Retail Metrics expected.
Tome went on to say later in that same interview, “We are gaining share,” adding that there are still pockets of “extraordinary housing weakness” in the west. “Our growth is tied to the general economic growth. We grew faster than GDP. A lot of it is because we are taking share.”
Going forward, why like Home Depot?
Here are two major reasons:
- Last week, Fitch upgraded its rating on Home Depot to an A- due to its solid operating momentum, strong free cash flow and public commitment that it’ll maintain its current financial leverage.
- Home Depot’s 3Q results left its smaller archrival Lowe’s (NYSE: LOW) in the dust. Lowes reported a 44-percent drop in third-quarter profit with a 0.7-percent same-store-sales increase and there is fear its fourth-quarter outlook may fall short of analysts’ estimates.
A three-percent dividend yield doesn’t hurt, either. It may be smart to keep an eye on “The Depot.”
Good Investing,
Jason Jenkins
Article by Investment U
Stocks, Commodities, Forex & Financial Market Afternoon Technical Update
Try MarketClub for 30 Days for just $8.95 – Click Here!
Weinberg Says Oil May Reach $150 if Iran Blocks Exports
Dec. 1 (Bloomberg) — Eugen Weinberg, head of commodities research at Commerzbank AG, talks about diplomatic relations between the European Union and Iran, and its impact on oil trade. He speaks from Frankfurt with Maryam Nemazee on Bloomberg Television’s “The Pulse.” (Source: Bloomberg)
