Video courtesy of ForexCT – A leading Australian forex broker, liscensed by the Australian Securities & Investments Commission, offers the MetaTrader4 and PROfit Platform to retail traders. Other services include Segregated Accounts, Trading workshops, Tutorials, and Commodities trading.
Central Bank Meetings Galore
By ForexYard
Central bankers and politicians were the drivers of the FX markets last week and this will likely continue this week. There are 9 central bank meetings on the economic calendar with the most important being the ECB who could cut rates by at least 25 bp.
Economic News
USD – Central Bank Meetings Galore
Central banks have stepped in to fill the void left by politicians on both sides of the Atlantic. Congress was unable to come to an agreement to lower the US deficit. European politicians have so far failed to contain the 2-year old European debt crisis. Thus central bankers have taken it upon themselves to support financial markets. The move by the leading central bankers to increase liquidity through discounted currency swaps helped to support financial markets where the politicians have failed.
This week there are nine central bank meetings. The Fed will meet next week on December 13th. The market tone this past week was much more positive than throughout most of the month of November and may continue into the new week. This would likely lead to additional USD declines.
With the exception of Friday’s trade balance and consumer sentiment survey the US lacks major data releases this week. This will leave markets to be pushed and pulled by news reports and market rumors which make for a difficult trading environment. That being said, there is no substitute for strict risk management.
EUR – ECB Highlights Week Full of Central Bank Meetings
Central bankers and politicians were the drivers of the FX markets last week and this will likely continue this week. There are nine central bank meetings on the economic calendar with the most important being the ECB who could cut rates by at least 25 bp. Given the recent comments by Draghi there appears to be a shift in the ECB policy as the bank recognizes the risk of deflation creeping into the euro zone economy. This comes from the expectations of a slowdown in growth as signaled by the downward trend of European PMI surveys. In response the ECB may lower interest rates by 25 bp for the second consecutive month. There is also a talk of a possible 50 bp rate cut but this may be an exaggeration. Additional liquidity measures could be be opened by the ECB to improve access to funding for European banks. The world’s central banks took this step last Wednesday with the discounted swap lines.
Draghi has also suggested the ECB may be more open to assisting European nations who have come under funding pressures. In a speech last week Draghi said that a commitment by EU politicians to adhere to, “Stricter budget discipline and binding their economies more closely is definitely the most important element to start restoring credibility. Other elements might follow, but the sequencing matters.” Should the ECB begin to feel that EU governments are taking concrete steps the ECB could unleash its “bazooka” to help stem the debt crisis.
AUD – RBA Expected to Cut Interest Rates
Consensus expectations are for the Reserve Bank of Australia to lower interest rates on Tuesday by 25 bp for the second consecutive month. This comes on the heels of a data which showed a -10.7% contraction in building approvals and below consensus retail sales numbers. The Australian economy is slowing and this will likely be confirmed on Wednesday with the release of Q3 GDP. Data coming out of China is also worrying as the HSBC Purchasing Manager’s Index fell to a 32-month low of 47.7 in the month of November from 51 in October.
Looking at the AUD the commodity currency continues to move higher off of its October lows with the improved market sentiment but the gains may have pushed too far with the AUD/USD rising over 6.5% last week. The pair has resistance at 1.0330 from the November 14th high. There is additional resistance at the November 3rd high of 1.0450 followed by 1.0610 from the downward sloping trend line off of the July and October highs. Forex traders may notice that the daily stochastics are beginning to roll over. Support is found at 1.0050 at the 20-day moving average.
Corn – Unreliable Government Crop Reports
An article in Monday’s Wall Street Journal shows how unreliable the recent government harvest reports have become. According to the WSJ the US Department of Agriculture monthly forecasts have been less than accurate over the past two years, the most inaccurate in the past 15-years. The government’s stockpile report has also come under criticism. The stockpile report shows the amounts of corn which is placed in storage facilities and silos. When the government reports are released they can create large price swings in the commodities markets as the release of the data is considered high impact news. Both hedgers and speculators have begun to question the accuracy of the government’s reports as their recent releases have triggered markets’ circuit breakers on corn prices over the past 3 years according to the WSJ. Corn prices are currently trading near their recent lows at 584.58. The commodity has support at 581.60 and 571.60 with resistance at 631.00.
Technical News
EUR/USD
The weekly chart shows the pair is trading in a symmetrical triangle pattern with the resistance line falling from the May high and support line rising from the yearly low. The first support from this chart pattern comes in this week at 1.3200. A break here will likely open the door to not only the October low of 1.3145 but also1.3050 from the 61.8% Fibonacci retracement of the bullish move spanning 2010 to 2011. The January low of 1.2875 could contain the near-term price action. To the upside the November 18th high of 1.3610 is the initial resistance followed by the mid-November consolidation at 1.3860 where the 100-day moving average also lies. The top of the triangle pattern would likely contain any move higher near 1.4230-1.2350.
GBP/USD
Last week cable found resistance at 1.5780, a level that has proven to be resistive in the past. Additional resistance is found at the October high of 1.6165. Monthly and weekly stochastics continue to move lower and as such the November low of 1.5435 is the initial support followed by the October low of 1.5270. The last bastion of support for the GBP/USD is found off of the rising trend line from the 2009 and 2010 lows which comes in at 1.0590.
USD/JPY
The USD/JPY is encroaching on its long term trend line off of the 2007 high and comes in at 78.70. A break above this level is needed to confirm the recent price appreciation. Both weekly and monthly stochastics are moving higher so traders may look for additional resistance at 79.50 from the post intervention high. The 200-day moving average is also lurking just below this price. Should the pair fail at the long-term trend line the congestion between 77.50-77.60 may prove to be supportive while the all-time low near 75.60 stands out as the last support.
USD/CHF
As weekly stochasttics have already turned lower the monthly stochastics are beginning to roll over. This is occurring after the pair looks to have failed to break above the 0.9330 resistance level. As such the pair has support at last week’s low of 0.9065 followed by the November low of 0.8760 and the October low of 0.8565. A break above the 0.9330 resistance could spur gains towards this year’s high of 0.9780.
The Wild Card
AUD/USD
The AUD has run into resistance at 1.0330. There is a lot of resistance at this level as this price coincides with a previous resistance from the November 14th high as well as the 100-day moving average which comes in at 1.0300. Forex traders may notice that the daily stochastics are beginning to roll over. Support is found at 1.0050 at the 20-day moving average.
Forex Market Analysis provided by ForexYard.
© 2006 by FxYard Ltd
Disclaimer: Trading Foreign Exchange carries a high level of risk and may not be suitable for all investors. There is a possibility that you could sustain a loss of all of your investment and therefore you should not invest money that you cannot afford to lose. You should be aware of all the risks associated with Foreign Exchange trading.
Santa Claus: A Market Rally Not Worth the Risk
By MoneyMorning.com.au
Small-cap investors: take note! (And other investors, listen up too…)
As Slipstream Trader, Murray Dawes, pointed out last week, Santa Claus is coming to town. Or more specifically (and useful) for you as an investor, the annual Santa Claus market rally looks like it has arrived.
Last week’s market action was huge.
The S&P/ASX 200 index surged from 3,984.3 on Monday to close at 4,288.0 on Friday.
That’s a 7.6% gain in five days.
It was the biggest one-week gain since… just two months ago in October. Between 5 and 11 October the index gained 9.2%.
And that was the biggest gain since… just four months ago in August. Between 9 and 15 August the index gained 7.4%.
The question for investors now is: will the Santa Claus factor make this market rally more sustainable than the last two?
Because each time, following these swift rallies, the market slumped.
Why?
Because of all the bad news – U.S. debt problems, European debt problems, Chinese economic slowdown, and so on. Each of those events dragged the market lower.
Clearly what the policymakers would like is a constant stream of good news.
And maybe they’ve found the solution…
ECB to IMF to Spain and Italy
“The IMF [International Monetary Fund] has confirmed that it could raise new funds for onlending from Europe, amid speculation that the European Central Bank might provide money to the Fund that could be used to help Italy and Spain.”
As we understand it, the European Central Bank (ECB) isn’t allowed to lend money directly to European governments.
So, the Europeans need a plan.
A clever and sinister way round this problem is to hand cash to the IMF… on the condition the IMF hand the cash to Italy and Spain. Or any other European nation in the lurch.
That way the ECB can buy government bonds and national governments can keep spending. If the market stops buying government bonds, no problem, the ECB will give more money to the IMF… to give to European governments.
If the ECB, European Union and IMF get away with this scam, it could keep Europe off the front pages for weeks. Of course, it won’t mean the problem has gone away… just that it’s hiding.
But in the short term that will be forgotten about as the Santa Claus rally helps drive the market higher.
You can see how it worked last Christmas:

Source: Google Finance
The market rally started in late November… built momentum through January… before topping out in February. After that, apart from a brief market rally after the Japanese tsunami and earthquake, it was pretty much downhill for the market.
In fact, from the post-tsunami peak to the August low, the market fell 24.3%. That’s not fair, markets should only ever go up…
Santa’s Track Record
So even here in Australia, bureaucrats are doing all they can to fiddle with the market. To try and stop stock prices falling. Tomorrow the Reserve Bank of Australia (RBA) meets for the last time before it breaks until the February 2012 meeting.
Will it cut or raise rates? Or just leave them alone?
Who knows?
But whatever, odds are the market has moved into the happy zone. Whatever the RBA does, the happy market will probably look on the plus side… and doubtless send the market higher.
So, does that mean you should jump into the market and ride the Santa Claus rally?
Well, if this was a bull market, then yes. The Santa Claus rally worked a treat every Christmas from 2003 to 2006. But since then… it’s not so good. The market made a small rally in late 2007 before collapsing in the new year.
The same in 2008. Again in 2009. And as we say, even last Christmas the market rally was short lived.
In other words, the Santa Claus rally track record ain’t that hot.
So, rather than putting faith in the big red fella to make you a few bucks, we suggest sticking to what you know. European bureaucrats have shown they’re experts in papering over cracks without actually fixing anything.
And as long as they – and other bureaucrats – keep trying to cover up the real problem, the real problem will keep showing through.
For that reason our strategy stays the same: cash, gold, blue-chip dividend paying stocks… and an exposure to volatile small-cap stocks.
That way, if the rally is sustained, you should still make a bunch of cash but without putting all your savings on the line if the market rally doesn’t hold up.
Cheers.
Kris.
Related Articles
Why the Fed’s Actions Make Perfect Sense
Swiss National Bank Intervenes…
Bailouts Still Boosting the Market
Was This Just Another Rigged Market?
From the Archives…
How to Profit from the Inevitable Return to Sound Money
2011-12-02 – Kris Sayce
Two Reasons the Market Should Have Fallen…
2011-12-01 – Shae Smith
Ditch Your Investor Pride to Avoid an Investing Fall
2011-11-30 – Kris Sayce
How to Play a Volatile Market for Profit
2011-11-29 – Kris Sayce
No Thanks to Central Banks
2011-11-28 – Kris Sayce
For editorial enquiries and feedback, email [email protected]
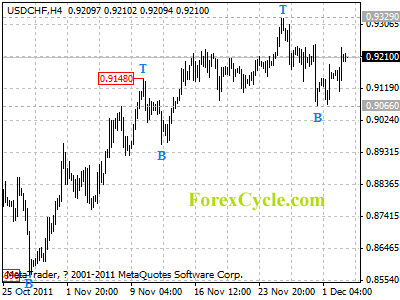
USDCHF has formed a cycle bottom at 0.9066
USDCHF has formed a cycle bottom at 0.9066 on 4-hour chart. Range trading between 0.9066 and 0.9329 would likely be seen in a couple of days. Resistance is at 0.9329, a break above this level will signal resumption of uptrend from 0.8569, then further rise towards 1.0000 could be seen. Key support is now at 0.9066, only break below this level could indicate that the rise from 0.8569 is complete.
Kiwi outlook – 05 December
Early to mid last week saw a very bullish market with the kiwi gaining against the Dollar. Thursday and Friday’s price action showed momentum finally slowing down with small movement. The market did however form a bearish Hikkake pattern at the end of the week suggesting the early bulls could lose control to the bears in the coming days.
A look at the chart below shows the mentioned Hikkake pattern. The pattern is strengthened as it is showing a clear rejection of a strong S&R level sitting at 0.7800.

The Hikkake is again strengthened by a 50% swing retracement. A look at the chart below and we can see the market last week retraced 50% of its most recent down swing. The Hikkake pattern is formed just below this 50% which happens to sit just 50pips above our identified S&R level at 0.7800.

With the strong technical resistance sitting at 0.7800 and the 50% swing retracement its possible we may see the market continue its bearish momentum seen for much of the latter part of this year. Last weekend the Kiwi opened with a gap which as of yet has not been filled. Shorting the pair down towards the 0.7500 area (the Gap) could prove to be a profitable trade in the coming days/week.

If You Want to Globalize, Here’s How to Do It
Written by Sara Nunnally, Editor, Inside Investing Daily, insideinvestingdaily.com
When Australia cut its key interest rate in early last month, it sent ripples through the global economy. Now is your time to take advantage of the opportunities set in motion.
Australia is one of my favorite “go to” markets for investors who want to “globalize” their portfolio. It’s a safe and stable economy with a lot of potential. But better yet… it is largely removed from the debt worries plaguing the U.S. and European markets.
But with problems this big, it’s hard not to get sucked into the turmoil.
In November… Australia cut its interest rates.
That might not sound like big news… Major economies around the world have been slashing rates for the past four years. But this is different. Australia was the first developed economy to raise its interest rates after the global financial crisis in 2008 and 2009.
And it continued to raise rates through November 2010, when it made its last move, bumping rates from 4.5% to 4.75%.
But on Nov. 1, Australia trimmed rates back to 4.5%. It was the first cut in two and a half years.

The reason? Europe’s debt crisis was affecting trade with Asia. Bloomberg reported that China and South Korea were exporting less because of European and U.S. economic woes.
And China is a huge market for Australia.
For a numbers geek like me, this is my bread and butter — especially since it deals with big-picture, global impact data. This is the kind of stuff — the undercurrent — that helps me see the big trends in the international market.
But you’re probably wondering why you should care. I have two words for you: resource and opportunity.
What this rate cut means for investors is this: more exports for Australian companies and more profits for their bottom line.
The resource sector is strong in Australia.
In fact, Australia is going through a mining boom. In late October, BIS Shrapnel said in its report “Mining in Australia 2011 to 2026” that investment in Australian mining could reach $85.7 billion by 2015 or 2016.
This year the estimated investment figures top out at only $48.5 billion, meaning the industry could see growth of nearly 20% a year for the next four years.
But some analysts think much of that growth will happen next year. And this cut in interest rate will be sure to fuel a lot more projects.
When interest rates are cut, the value of the underlying currency drops. After the announcement on November 1, the Australian dollar fell 0.4% overnight. That might not sound like much, but when you’re talking about millions of dollars’ worth of exports, this difference can add up quickly.
For example, if a buyer wanted to buy $1 million in iron ore, he would pay $4,000 less after rates were cut.
No wonder 80% of the investment capital in Australia’s resource projects comes from outside the country. Everyone wants a piece of this pie.
Australia isn’t the only fish in the pond, though… Indonesia, Turkey, Brazil and a host of other export countries are all trying to bolster exports. Australia’s rate cuts could be justified by needing to stay competitive in the resources sector.
The growth expectations and stable government and economy make Australia very attractive.
And the best opportunities may just be in the smaller companies — those where $4,000 makes a big difference. The junior mining sector will be a big place for investors over the next three or four years.
That $85.7 billion isn’t just going to go to the big guys.
JUMEX, or junior mining and exploration companies, can move quickly. Take a look at this chart over the past two years.

This is Independence Group (IGO:ASX). It is a nickel producer with the Long Nickel Mine in Kambalda, Western Australia. It also owns stakes in six joint ventures across Australia. Plus, it is exploring in five 100%-owned mines.
The company’s looking for gold and base metals… and prospects are good.
I like IGO because it’s actually producing something, so it has a cash flow. In fact, the company’s nickel production exceeded expectations for the third quarter (ending Sept. 30). IGO also has made some strategic acquisitions that have bought it stakes in other joint ventures.
These points are key for any investor looking to take a position in a junior mining company. A producing company is almost always safer (from an investment standpoint) than a small exploration company.
Reserve estimates for its exploration projects keep growing, too. Its Tropicana joint venture just boosted gold reserves from 5.56 million ounces to 6.61 million ounces. IGO’s stake is for 1.98 million ounces of those deposits.
At current market value, that’s $3.45 billion!
With a market cap of only $929 million, that’s a huge payday coming down the pipeline… and it’s just one of IGO’s projects in the hopper.
Australia is a hotbed of mining projects, and the interest rate haircut will make exporting cheaper. For junior mining companies, this is great news. Investors could have a field day.
Keep in mind, some of these junior miners are great takeover candidates, too.
If you’re looking to take advantage of the Australian mining boom and lower interest rates, now’s the time to do it. Small-cap companies could offer you a great advantage in this industry.
AUD/JPY Daily outlook – 05 December
Last week saw an actively bullish market with Wednesday in particular closing up 190pips. Thursday and Fridays price action remained flat compared to earlier in the week. Despite the strong bullish momentum we saw the market struggled to break and close above the both technical and psychological level of 80.00.
The last three days of the week generated a strong bearish Hikkake pattern showing a clear rejection of the 80.00 area suggesting last weeks bulls may be overcome by the bears in the coming week.

The Hikkake pattern and resistance are further strengthened by a 61.8% Fibonacci retracement & rejection. Notice below how the Hikkake has formed just below and almost touched perfectly the 61.8% Fib level.

With the strong resistance, the 61.8% Fib retracement and the bearish Hikkake pattern, price action at this time is suggesting we may see the market rejoin its bearish trend seen for much of 2011. It’s wise to take note of last weeks weekend gap, that as of yet, has not been closed. Should we see a fall in the coming days the area around 76.00 (the gap) could prove to be a good profit taking area.

CAD/JPY Daily outlook – 05 Dec
The CAD/JPY on Friday closed with a bearish pin bar rejecting the both technical and psychological level of 77.00 and the 61.8% Fibonacci retracement level from its most recent down swing.
The chart below shows the strength of the 77.00 area. It’s clear to see it has showing a strong relevance in this market in the past. We can see below Friday’s bearish pin bar fiercely rejecting this level.

The pin is not only rejecting the 77 but also a 61.8% Fibonacci retracement from its most recent down swing. The 61.8% sits just 28 pips above our technical level of 77 further strengthening upper resistance. It’s wise to take note of how the bearish pin bar touches the 61.8 almost perfectly.

With the charts showing strong upper resistance being supported by bearish price action we will be looking for shorting opportunities in the coming week with initial targets in mind at the 75.00 area which is the next obvious support.
Download Your Free Price Bars and Chart Patterns Trading eBook.
Sometimes understanding the most basic elements of a chart can improve your trading success. That’s why Elliott Wave International (EWI) created a new eBook, Learn to Identify High Probability Trading Opportunities Using Price Bars and Chart Patterns, by EWI Senior Analyst Jeffrey Kennedy. Find out how price bars and chart patterns can improve your trading success.
Download your free 14-page eBook today.
When you look at a price chart, what do you see? A bunch of ticks, some ups and downs, perhaps a pattern? Do you see the trend, support and resistance levels, and who’s in charge of the market — the bulls or the bears?
 Learn to spot these critical elements and more in Elliott Wave International’s free eBook, Learn to Identify High Probability Trading Opportunities Using Price Bars and Chart Patterns.
In this free 14-page eBook, EWI Senior Analyst Jeffrey Kennedy will teach you how to look at your charts and find critical support and resistance levels. Even more importantly, you’ll learn what these levels mean to your trading positions and stop levels.
You will learn how to look at the simplest part of the chart — the price bar — so that you can determine the next most likely market move.
Jeffrey pulls from over 15 years of experience analyzing and trading the markets, to teach you the very same techniques that helped him become a successful trader.
Learn how to identify trading opportunities using price bars and chart patterns.
Download your free 14-page eBook today. (Hurry — offer expires December 19!)
About the Publisher, Elliott Wave International
Founded in 1979 by Robert R. Prechter Jr., Elliott Wave International (EWI) is the world’s largest market forecasting firm. Its staff of full-time analysts provides 24-hour-a-day market analysis to institutional and private investors around the world.
Currencies: Forex Speculators bullish on Dollar last week. Sharply raise Euro bearish bets
By CountingPips.com
The latest Commitments of Traders (COT) report, released on Friday by the Commodity Futures Trading Commission (CFTC), showed that large futures speculators heavily increased their bullish bets in favor of the US dollar and pushed their bearish bets for the euro to the highest level since June 2010.
Non-commercial futures traders, usually hedge funds and large speculators, increased their total US dollar long positions to $18.04 billion on November 29th from a total long position of $12.11 billion on November 22nd, according to the CFTC COT data and calculations by Reuters which calculates the dollar positions against the euro, British pound, Japanese yen, Australian dollar, Canadian dollar and the Swiss franc.

EuroFX: Currency speculators continued to add to their short bets for the euro against the U.S. dollar for a third consecutive week as of November 29th. Euro short positions rose to a total of 104,302 net contracts from the previous week’s total of 85,068 net short contracts. Last week’s short position is a new low level for euro positions all year and the highest short level since June 8th of 2010 when euro short positions totaled 111,945.

The COT report is published every Friday by the Commodity Futures Trading Commission (CFTC) and shows futures positions as of the previous Tuesday. It can be a useful tool for traders to gauge investor sentiment and to look for potential changes in the direction of a currency or commodity. Each currency contract is a quote for that currency directly against the U.S. dollar, where as a net short amount of contracts means that more speculators are betting that currency to fall against the dollar and net long position expect that currency to rise versus the dollar. The graphs overlay the forex spot closing price of each Tuesday when COT trader positions are reported for each corresponding spot currency pair.
GBP: Currency speculators increased their bearish bets against the British pound sterling for third consecutive week as of November 29th. British pound positions fell to a total of 46,660 short positions following a total of 36,634 net short positions registered on November 22nd. The decline in British pound positions marked the lowest level since November 1st.

JPY: The Japanese yen net long speculative contracts dipped last week following three consecutive weeks of increases. Yen long positions fell to a total of 40,547 net long contracts reported on November 29th following a total of 43,180 net long contracts that were reported on November 22nd.

CHF: Swiss franc positions dropped for a third consecutive week and to a new low level all year against the dollar last week. Speculator positions for the Swiss currency futures edged down to a total of 9,327 net short contracts following a total of 5,870 net short contracts as of November 22nd. The Swiss currency has seen limited strength in Forex trading since the Swiss National Bank initiated a policy to stem the strength of their currency.

CAD: Canadian dollar positions edged lower for a fourth consecutive week as of November 29th. CAD net contracts decreased to a total of 26,869 net short contracts as of November 29th following a total of 22,144 short contracts reported on November 22nd. CAD positions are now at their lowest level of the year, surpassing the previous low that was reached on October 11th when net short positions fell to 24,913.

AUD: The Australian dollar long positions fell lower for the third consecutive week as of November 29th. Australian dollar positions declined to a total net amount of 12,542 long contracts following a total of 17,960 net long contracts reported as of November 22nd. The AUD speculative positions are now at their lowest level since October 11th when Aussie long positions total 10,753.

NZD: New Zealand dollar futures speculator positions fell sharply last week for a third consecutive week. NZD contracts declined to a total of 3,718 net long contracts as of November 29th following a total of 7,916 net long contracts registered on November 22nd. Last week’s decline brought New Zealand dollar positions to the lowest level since April 5th when positions equaled 2,695 long contracts.

MXN: Mexican peso contracts fell last week for a second consecutive week and to a new lowest level all year. Peso positions declined to a total of 36,240 net short speculative positions as of November 29th following a total of 31,582 short contracts that were reported on November 22nd.

COT Currency Data Summary as of November 29, 2011
Large Speculators Net Positions vs. the US Dollar
EUR -104302
GBP -46660
JPY +40547
CHF -9327
CAD -26869
AUD +12542
NZD +3718
MXN -36240
