ECB Cuts Rates but Disappoints Investors

Source: ForexYard

During yesterday’s press conference European Central Bank President Mario Draghi laid out 3-pillars for the “Fiscal Compact”. He also stressed the ECB will not use QE nor will it purchase unlimited amounts of European bonds. The EUR fell below the 1.33 level following the disappointing comments.

Economic News

USD – US Data Releases Go Unnoticed

All eyes are on Europe today with the European economic summit in Brussels. Yesterday US weekly unemployment claims were overshadowed by the ECB press conference. The data showed 381k new jobless claims were filed on expectations of 397k. Inventories for the month of November rose 1.6% on consensus forecasts of a 0.4%. This hints at reduced business spending in Q4 and potentially lower year end US GDP. The data was largely ignored in favor of events in Europe and this will likely be the case today as we will get US trade balance data and consumer sentiment.

The EUR/USD has resistance at 1.3440 from the 20-day moving average followed by 1.3550 off of last week’s high. Support comes in at the November low of 1.3210 followed by the October low of 1.3145.

EUR – ECB Cuts Rates but Disappoints Investors

The ECB lowered its key refinancing rate by 25 bp and introduced long term refinancing operations for banks to increase liquidity. During his press conference European Central Bank President Mario Draghi laid out 3-pillars for the “Fiscal Compact”. These three pillars consist of growth, rules on debt levels, and a stabilization mechanism. What Draghi didn’t announce was the ECB’s intention to cap sovereign bond yields, nor will the central bank be the last lender of last resort. Draghi stressed the final decisions are in the leaders’ hands. Investors were disappointed as well when Draghi said the ECB is not ready for quantitative easing.

Draghi has placed the ball back in the court of the European politicians who are meeting today in Brussels. Expectations are high for additional steps to integrate Europe and fund the debts of the fiscally strapped nations. However, given the gaps between Germany and other countries involved and yesterday’s disappointing ECB meeting market sentiment has been dampened.

The price action for the EUR/JPY shows the pair failed to overcome its 55-day moving average at 104.40 and is moving lower towards the 102.50 support from November 25th. A break here would open the door to the October low of 100.75.

GBP – BoE Leaves Rates, Bond Buying Unchanged

As expected the BoE left both the interest rate and its bond buying program unchanged. This means the market will not find out details of the past Monetary Policy Committee meeting until December 21st. In October the BoE unexpectedly increased the level of bond purchases to GBP 275 bn from 200 bn. Governor Mervyn King has already signaled the central bank’s willingness for additional bond buying as both the BoE and the government expect GDP fall. The most recent report from the Office of Budget Responsibility predicts GDP will be 0.7% in 2012.With the euro zone struggling to ward off both a debt crisis and a financial crisis this does not bode well for the UK which has the EU as its largest trading partner. As such sterling could come under additional selling pressure.

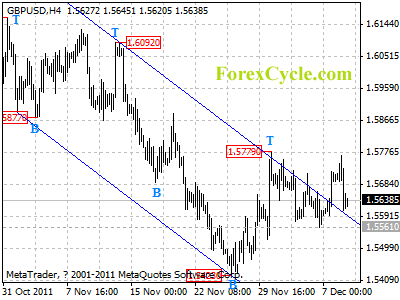
The GBP/USD failed at the 1.5780 resistance level but is still within its consolidation pattern from the past week and a half. A break of support from the December 6th low of 1.5560 would expose the November 25th low of 1.5420.

Silver – Silver Falls on European Woes

The price of spot silver fell in-line with the EUR yesterday as European Central Bank President Mario Draghi signaled the ECB would not come to the rescue of the indebted European nations. Higher yielding assets such as equities and the AUD all lost ground during Draghi’s speech which weighed on market sentiment. In response traders moved into the typical safe haven assets such as US Treasury bonds and the USD. However, there may be a silver lining to Draghi’s comments as the reduced ECB interest rate and increased liquidity measures may make access to cheap funding sources available for investments in metals such as gold and silver.

Spot silver has been trading in a triangle consolidation pattern from the November highs and lows. The commodity has resistance at the top of the pattern at $33.15 and at the bottom of the consolidation at $31.50. Forex traders should note that the chart pattern provides a measured move for $1.75 which could come in either direction.

Technical News

EUR/USD

The weekly chart shows the pair is trading in a symmetrical triangle pattern with the resistance line falling from the May high and support line rising from the yearly low. The first support from this chart pattern comes in this week at 1.3200. A break here will likely open the door to not only the October low of 1.3145 but also1.3050 from the 61.8% Fibonacci retracement of the bullish move spanning 2010 to 2011. The January low of 1.2875 could contain the near-term price action. To the upside the November 18th high of 1.3610 is the initial resistance followed by the mid-November consolidation at 1.3860 where the 100-day moving average also lies. The top of the triangle pattern would likely contain any move higher near 1.4230-1.2350.

GBP/USD

Last week cable found resistance at 1.5780, a level that has proven to be resistive in the past. Additional resistance is found at the October high of 1.6165. Monthly and weekly stochastics continue to move lower and as such the November low of 1.5435 is the initial support followed by the October low of 1.5270. The last bastion of support for the GBP/USD is found off of the rising trend line from the 2009 and 2010 lows which comes in at 1.0590.

USD/JPY

The USD/JPY is encroaching on its long term trend line off of the 2007 high and comes in at 78.70. A break above this level is needed to confirm the recent price appreciation. Both weekly and monthly stochastics are moving higher so traders may look for additional resistance at 79.50 from the post intervention high. The 200-day moving average is also lurking just below this price. Should the pair fail at the long-term trend line the congestion between 77.50-77.60 may prove to be supportive while the all-time low near 75.60 stands out as the last support.

USD/CHF

As weekly stochasttics have already turned lower the monthly stochastics are beginning to roll over. This is occurring after the pair looks to have failed to break above the 0.9330 resistance level. As such the pair has support at last week’s low of 0.9065 followed by the November low of 0.8760 and the October low of 0.8565. A break above the 0.9330 resistance could spur gains towards this year’s high of 0.9780.

The Wild Card

Silver

Spot silver has been trading in a triangle consolidation pattern from the November highs and lows. The commodity has resistance at the top of the pattern at $33.15 and at the bottom of the consolidation at $31.50. Forex traders should note that the chart pattern provides a measured move for $1.75 which could come in either direction.

Forex Market Analysis provided by ForexYard.

© 2006 by FxYard Ltd

Disclaimer: Trading Foreign Exchange carries a high level of risk and may not be suitable for all investors. There is a possibility that you could sustain a loss of all of your investment and therefore you should not invest money that you cannot afford to lose. You should be aware of all the risks associated with Foreign Exchange trading.


Bank of England Holds Bank Rate at 0.50%, APP at 275B

The Bank of England (BoE) maintained the Bank Rate at a record low stimulatory level of 0.50%, and continued with its Asset Purchase Program (Quantitative Easing) target of GBP 275 billion, after increasing it by 75 billion at its October meeting.  On its asset purchase program, the Bank said: “The Committee expects the announced programme to take another two months to complete. The scale of the programme will be kept under review.”

The Bank also announced the introduction of the Extended Collateral Term Repo (
ECTR) Facility.  The Bank said: “This Facility is designed to mitigate risks to financial stability arising from a market-wide shortage of short-term sterling liquidity” and added “there is currently no shortage of short-term sterling liquidity in the market.”

The Bank also held the official Bank Rate unchanged at 0.50% at its October meeting this year; the rate has remained on hold since March 2009, when the Bank reduced the interest rate by 50 basis points to 0.50%.  The United Kingdom reported annual consumer price inflation of 5.2% in September, 4.5% in August, and 4.4% in July, and still above the Bank’s inflation target of 2.00%.  


The UK saw quarterly GDP growth of 0.5% in Q3 this year (0.1% in Q2, 0.5% in Q1), while annual economic growth was reported at 0.5% (0.7% in Q2, 1.6% in Q1).  The British pound (GBP) is basically flat against the US dollar so far this year, while the USDGBP exchange rate last traded around 0.64.

GBPUSD failed to break above 1.5779 resistance

GBPUSD failed to break above 1.5779 resistance, and pulled back from 1.5768 yesterday, suggesting that lengthier sideways movement in a range between 1.5423 and 1.5779 is underway. Deeper decline to 1.5500 area to reach next cycle bottom is expected. Key resistance remains at 1.5779, only break above this level could trigger another rise towards 1.6500.

gbpusd

Forex Signals

The Light Bulb Moment for the Eurozone

EWI’s free EU debt report sheds some light on what’s in store

By Elliott Wave International

How many European bankers does it take to change a light bulb? That’s a joke in search of an answer, but EWI’s European analyst Brian Whitmer explained five months ago that the “light bulb moment” was coming — that’s the time when most people would clearly recognize the severity of the European debt crisis. He offered this spot-on analysis back in July 2011, before the larger world came to know recently how bad things really are in the eurozone.

This chart shows how markets in Greece, Ireland and Portugal have behaved over the past five years, including the bailouts. Whitmer says that the turmoil in Greece is due mostly to both social mood and Greek markets having plummeted for more than a year and a half, while the larger EU stock markets have levitated. Once they turn down, he forecasts that what you saw in Greece will be replayed in the eurozone.

To help his subscribers see the light and get the full picture, he compared EU member nations under financial scrutiny to those that are usually viewed as being safe — and showed that they weren’t as safe as most people thought.

Specifically, Whitmer warned that the debt per person in Greece looked eerily similar to the debt per person in highly regarded countries, such as Germany and France — and even to non-eurozone countries, such as the United Kingdom.

In 2010, Britain proposed a five-year, 25% budget reduction that affects nearly every area of the government. While it sounds like a drastic measure, it has played out differently during the past year. According to member of European Parliament Daniel Hannan, statistics show that not only is government spending and borrowing significantly higher than this time last year, but taxes, too, are way up. Whitmer notes that the budget cuts rely heavily on the future and lack near-term bite.

Why has the worst of Europe’s violence taken place on the streets of Athens rather than London? Athenians did not suddenly grow more violent in 2011. What has changed since 2007 is their stock market. Whitmer’s words of advice: “…should your country’s stock market begin to look like Greece’s, watch out. Trouble will be on the way.”

*****

European Financial Forecast Editor Brian Whitmer has covered Europe’s debt crisis since March 2010 — and his forecasts kept subscribers ahead of the downward spiral every step of the way. Read more of his analysis in our free report, “The European Debt Crisis and Your Investments.”

View your free report.


Free Report
The European Debt Crisis and Your Investments
Continue reading more articles like this one by Brian Whitmer in our European Debt Crisis report. This free report offers commentary from February 2010 through November 2011 that will help you to better understand what could be in store in the coming months and years.Download your free report now.

This article was syndicated by Elliott Wave International and was originally published under the headline The Light Bulb Moment for the Eurozone. EWI is the world’s largest market forecasting firm. Its staff of full-time analysts led by Chartered Market Technician Robert Prechter provides 24-hour-a-day market analysis to institutional and private investors around the world.

Avocet’s CEO Says Gold May Reach $2000 Before Year End

Dec. 8 (Bloomberg) — Avocet Mining Plc Chief Executive Officer Brett Richards discusses the outlook for gold prices. Avocet, which operates mines in West Africa, began trading on the London Stock Exchange’s main market today. Richards talks with Owen Thomas on Bloomberg Television’s “Countdown.”

The Importance of Being a Patient Trader

It pays to be patient –

The majority of traders are aware that in order to be profitable they must be patient. However few trulyunderstand the concept of patience. Being a patient trader is one of the most difficult skills to learn, but once mastered can greatly affect a traders overall profitability. Like most other aspects of trading, patience requires discipline.

An impatient trader will often experience inconsistency, frustration and erratic trading. Impatience can be detrimental to all elements of trading, especially a traders trading plan including their entries, stops and targets,

How impatience affects trading –

Below we’ll take a closer look at some of the ways an impatient trader can see their trading negatively affected.

Entry – Impatience often leads to ‘jumping the gun’ and entering a trade too early or late. The following example will better explain the detrimental affect impatience has on entering a trade: A trader’s analysis suggests the market is going to rise, however before that rise they expect a pull back. In anticipation of that pull back, the trader places a buy order at a lower price than the current market price. Unexpectedly the market shoots up. The trader then panics and his impatience forces an error in judgment. He then enters the market at a much higher price than he wanted. Unsurprisingly that ‘shoot up’ was short lived and the market did indeed pull back to his original entry. It then continues to rise and reaches his target price. The trader is left frustrated as he exited the market with less than he should have. By being impatient and not sticking to his trading plan he ultimately did not trade to his full potential.

Stops – Stop losses are another element that can be impaired by impatience. A trader may find themselves in a trade which has been in drawdown for some time. Although they have a stop loss in place which was determined by their analysis (that so far has not been reached), the market has been showing little movement which is leading to the trader becoming increasingly impatient. The trader decides to cut his losses as he has no patience to wait and see how this trade turns out. Unsurprisingly after he’s closed his trade for a loss, the market starts to move in his anticipated direction, finally reaching his target. The trader’s impatience with the trade forced an error in judgment resulting in a loss when he really should have had a win.

Targets – Similar to entries and stops, targets are often negatively affected by impatience. It’s not uncommon for an impatient trader to close a trade early. A trader may find themselves in a trade which is moving in their direction; however they lose patience with the ‘slow’ market and decide to close their trade early. Again unsurprisingly the market continues in their direction and reaches their original target. The traders is left frustrated as despite leaving the market with a win, they did not stick to their original plan and left the market with less than they should have.

As we can see above, impatience can affect many aspects of trading. Impatience can play havoc on a traders emotions leading them to make elementary mistakes and leaving the market frustrated.

Possibly the most costly mistakes impatience can lead to is over trading. It’s not uncommon to see traders recklessly overtrading, often feeling as though they are missing out on the ‘action’ if they’re not involved in a trade. A patient trader has the knowhow and experience to sit and wait for the market to tell them when to enter a trade and not do what most impatient traders do which is ‘go looking for a trade’. Patient traders wait for high probability set ups which are inline with their trading plan before entering the market, as they know overtrading is detrimental to their success.

Impatience can be harmful to a trader’s long term success. Many new and impatient traders have the mind set of ‘get rich quick’. Their lack of patience and dreams of quick money usually result in the same outcome; loss. Successful traders fully understand the importance of patience; they’re not looking for ‘quick money’ and have the discipline to adhere to their trading plans.

Patience can’t be taught overnight, however with discipline and honest expectations a trader can greatly improve their patience and profitability. A tip many impatient traders may find beneficial is to have their trading plans written on paper in black and white next to their work stations. A trading plan on paper next to the traders screen is much more beneficial than being stuck in their head somewhere where it can easily be disregarded or lost. When asked, most successful traders will say that without patience they would not be successful. Its clear to see that when trading it pays to be patient!

Article by vantage-fx.com

MetLife: A Gem in a Rough Sector

MetLife: A Gem in a Rough Sector

by Jason Jenkins, Investment U Research
Thursday, December 8, 2011

The financial services sector appears to be very scary right now. You have a populist movement in Occupy Wall Street that has brought class warfare into the media forefront. We also have mass uncertainty in the European banking industry due to sovereign debt dysfunction.

But this doesn’t mean that everything in that sector needs to be avoided like the plague.

Just like I’ve tried to do in the housing market, I was looking for plays that make sense in a “traditional” market but in our new reality have been beaten down. And after doing a little research, here’s the case I want to make for MetLife (NYSE: MET).

MetLife Revises Numbers

We’ve seen our share of natural disasters and bad economic news across the globe in 2011, for which MetLife had to bare. Going forward, MetLife now expects premiums, fees and revenue to jump from 31 to 33 percent this year. In dollar terms, revenue will go from $46.3 to $46.8 billion in 2011. For 2012, the company sees that revenue rising about five percent to $47.3 to $48.6 billion.

The company, whose shares rose 3.7 percent in premarket trading when this announcement was made last week, also expects to go back to regulators next month with a revised plan to return capital to shareholders, after its last proposal was blocked. I’ll talk about that a little later.

Growth in International Markets

The company is one the largest insurers in the United States but expects to get its future growth from its international operations – especially from the BRICs.

MetLife has gone through an internal reorganization recently under the leadership of new President, CEO and Chairman-Elect Steven Kandarian. After the acquisition of Alico in 2010, MetLife has established three business units to capitalize on geographic differences: America, EMEA (Europe, Middle East and Africa), and Asia.

The insurer recently reorganized its business units to acknowledge this shift, and it has started spending more aggressively on international branding.

A Revised Plan for the Fed

Because MetLife is a bank holding company, the Federal Reserve has the power to block the company’s capital plans. The Fed did this back in late October.

Kandarian has stated a new plan will be submitted to the Fed this January in hopes of a response by the end of March. They hope in the near future to sell its banking business and shed its holding company status.

What’s to Like About MetLife?

First of all, MetLife expects to have $6 billion to $7 billion in capital in 2012 for dividends and other actions. Analysts have said they expect MetLife to raise its dividend substantially and buy back at least $1 billion in stock.

We like dividends in this crazy market because you want to gain the best possible return for the lowest amount of risk. The buyback indicates that they feel the stock is undervalued. And if you look at MetLife’s tangible book value, it’s pretty undervalued compared to where it’s currently trading.

We can’t forget the 2010 acquisition of American Life Insurance Company (Alico) from AIG for $16.4 billion. This gave MetLife a market cap of $34 billion where Alico makes up almost half it’s the value. Alico operates in more than 50 countries and should contribute significantly to MetLife’s bottom line going forward.

Good Investing,

Jason Jenkins

Article by Investment U

Meddings Says StanChart Has Modeled for Euro Breakup

Dec. 8 (Bloomberg) — Richard Meddings, finance director at Standard Chartered Plc, talks about contingency planning for a potential euro-zone breakup and the bank’s outlook in Asia. He speaks from London with Maryam Nemazee on Bloomberg Television’s “The Pulse.” (Source: Bloomberg)

Mexico – Rising Natural Gas Superstate?

Americans looking south of the Rio Grande tend to forget, if they ever knew, that Mexico is, according to the U.S. Energy Information Administration, now America’s second largest source of imports. Of the United States’ total crude oil imports averaging 9,033 thousand barrels per day (tbpd), Mexico is the second largest source of imports, at 1,319 tbpd, exceeded only by Canada with 2,666 tbpd.

But now, Mexico’s future seems even brighter. According to U.S. Energy Information Administration Executive Director Maria van der Hoeven, Mexico’s significant untapped natural gas reserves, if properly developed, could eventually provide Mexico with energy independence.

On 29 November in Washington, presenting the most recent EIA report on Mexico van der Hoeven stated, “Mexico is sitting on very large natural gas fields that could allow it to end gas imports and could give it energy independence.

Van der Hoeven’s assertions are backed by Mexican Energy Secretary Jordy Herrera, who said, “With the shale gas potential and reserves, and the gas associated with crude, we should become a country with sufficient energy resources, both fossil and renewable, to achieve independence, and we could eventually export, all we need to do is make decisions in favor of the Mexican people. Developing gas production is urgent, the country cannot be subjected to the political times.” Herrera is salivating over official estimates, that developing Mexico’s shale natural gas industry could attract $7-10 billion in annual investment. According to Herrera, government officials have been working with state-owned oil giant Petroleos Mexicanos, or Pemex, to determine the size of the country’s natural gas fields and have contacted Congress to discuss the development of the country’s indigenous natural gas reserves.

And therein lies the rub.

To unleash this natural gas, according to the EIA, Mexico will have to utilize the process of hydraulic fracturing, or ‘fracking,” a controversial process of injecting water and chemicals deep underground to break up shale natural gas formations that has encountered rising resistance in the U.S because of its potential to pollute underground aquifers.

So, does Mexico need to go down the environmentally contentious fracking road?

Unclear – but a little ray of sunshine for alternative fuels was provided on 1 December, when the Inter-American Development Bank (IDB) approved a $70 million loan to Mexico to boost funding for renewable energies in electricity generation to reduce greenhouse gas emissions.

The loan, whose funds were provided from the IDB Clean Technology Fund, will be matched by financing from Mexico’s loan Nacional Financiera (NAFIN) development bank, along with an additional $70 million provided by an existing IDB conditional line of credit approved two years ago, for a total of at least $210 million.

The Clean Technology Fund IDB loan will be used for the construction of at least 10 renewable energy facilities, in particular wind power plants and small hydroelectric plants, increasing Mexico’s installed energy capacity from renewable sources, generating an estimated savings of greenhouse gas emissions of up to two million tons of CO2 annually.

Bereft of its platitudes and PR buzz, the discussion comes down to simple facts.

Does Mexico want the quick peso by developing its shale natural gas reserves as soon as possible, or is it willing to take a longer term approach to renewable energy? Given the immense fiscal reserves of its giant northern neighbor and its mastery of fracking technology, the answer might seem to be fairly clear cut, and one cannot discount the inevitable influence of corruption in advancing agendas.

According to the 2000 census, only 55 percent of Mexicans received drinking water of adequate quality. Given fracking potential to pollute aquifers, if might be time for Mexico city to forgo the quick peso and tell its remaining 45 percent to citizens to be a tad more patient while the government acquires more renewable energy grants.

Source: http://oilprice.com/Energy/Natural-Gas/Mexico-Rising-Natural-Gas-Superstate.html

By. John C.K. Daly of Oilprice.com