Will Investors Test the EUR/CHF Floor?

Source: ForexYard

Following the decision by the SNB to keep the EUR/CHF floor unchanged at 1.20, the CHF strengthened the most since September. As the European debt crisis comes to a head, perhaps this could be the time investors test the will of the SNB to hold the floor of the EUR/CHF.

Economic News

CHF – Will Investors Test the EUR/CHF Floor?

Following the decision by the SNB to keep the EUR/CHF floor unchanged at 1.20, the CHF strengthened the most since September. As we suspected, the SNB decided to take the more conservative approach and not make a move to raise the floor of the EUR/CHF to 1.25 or 1.30. The SNB will continue to enforce the 1.20 level and left interest rates unchanged near 0%. The Swiss central bank also noted slight growth in the global economy but an escalation of the European debt crisis threatens the economic outlook. Swiss inflation forecasts were downgraded and the bank projects deflation creeping into the Swiss economy. In 2012 the SNB expects the price level to fall by 0.3%.

There can be no doubt of the link between CHF strength and the European debt crisis. Expectations are building for a French downgrade from S&P following the disappointing EU summit. With Italian bonds once again testing the 7% yield threshold (it was only 1-month ago we were saying the threshold was 6%) it appears the European debt crisis is coming to a head. As the EUR continues to weaken and investors look for safe haven currencies this may be the time the market begins to test the resolve of the SNB to hold the EUR/CHF floor at 1.20. The first test may come at the pair’s 200-day moving average at 1.2200.

EUR – Increasing Expectations for a French Downgrade

The French appear set on managing expectations for an apparent downgrade of France’s AAA credit rating by S&P. Yesterday ECB member and Bank of France Governor Christian Noyer was quoted as saying a French downgrade, “Does not appear to me to be justified when considering economic fundamentals.” France is the second largest contributor to the EFSF and there could be knock-on effects of a French downgrade.

Yesterday’s European data was positive with better than expected PMI surveys for both the manufacturing and services sectors. In particular, Germany’s manufacturing PMI climbed to 52.7 from 50.3 as the engine of the European economy chugs on. The positive data is a welcomed event but additional PMI surveys for the remainder of Europe remained below the 50 boom/bust level. Thus the surveys should not shift market expectations which are for the euro zone economy to slip into a recession next year.

The EUR/USD goes into the last day of trading for the week with support at Wednesday’s low of 1.2945 followed by the 2011 low at 12870. Resistance is found at the November 20th high of 1.3260.

JPY – USD/JPY Moving Towards 4-year Trend Line

Yesterday’s manufacturing survey from Japan was not inspiring though the Chinese PMI was more encouraging. The Japanese Tankan survey came in weaker than expected at -4 on expectations of -2. The Chinese flash HSBC PMI climbed to 49 in the month of December from 47.7 in November. The survey was below the 50 boom/bust level for the 2nd month in a row but the improvement is encouraging.

Despite the negative Japanese data the USD/JPY appears to be taking its cues primarily from the movements of the USD. Yesterdays’ strong US Empire State Manufacturing Index and lower than expected weekly unemployment claims provided a pause in the bearish market sentiment and allowed for the USD to come off of its highs across the board.

Should the near-term trend of USD strength continue the USD/JPY could test the June 2007 trend line which comes in at 78.50. A break here will expose the post-intervention high of 79.50. To the downside the December 8th low of 77.15 may be supportive.

Gold – Look to the USD Index

Commodity prices all took a plunge on Wednesday with crude oil down 5% and gold plummeting almost $100. A tepid rebound was seen on Thursday but the retracements pale in comparison to the price declines.

There have been multiple theories for the decline in commodity prices floating around on the forex blogs, some ranging from bearish technicals, central bank selling, or a liquidation squeeze. We believe that a strong USD has been weighing on commodity prices. This trend of lower commodity prices could continue given the USD index (DXY) is now trading at its highest level of the year.

Technical News

EUR/USD

The 20-day moving average is now at 1.3420 and has served as a significant resistance level with the EUR/USD last closing above this line on November 3rd. While weekly stochastics are beginning to look oversold the monthly stochastics still have room to move lower. With the downtrend firmly entrenched the supports from the November low of 1.3260 and the October low of 1.3145 are within striking distance. A move higher may find willing sellers at the December high of 1.3550 and the November 18th high of 1.3610.

GBP/USD

Sterling has been caught in a range trading environment between the levels of 1.5780 and 1.5660 where the 55-day moving average is found. With daily and monthly stochastics moving lower the November and October lows of 1.5420 and 1.5270 look to be within reach. Resistance for the GBP/USD can be found at the November 18th high of 1.5890 followed by the falling trend line from the August high which comes in at 1.5925.

USD/JPY

The doji candlestick from December 8th stands out as the day’s low coincides with both the 55-day and the 100-day moving average. This may be the start of a base being formed for a test of the June 2007 trend line which comes in at 78.50. A break here will expose the post-intervention high of 79.50. To the downside the November 18th low of 76.55 is the last support prior to the pair’s all-time low at 75.56.

USD/CHF

The pair continues to struggle to overcome the 0.9330 resistance level despite multiple attempts to move higher. A concerted move higher may find resistance at the 20-month moving average of 0.9380 followed by this year’s high of 0.9780. The downside may be capped at the support of 0.9065 which coincides with the pair’s 55-day moving average. Additional support is located at the November low of 0.8760.

The Wild Card

USD/CAD

The daily stochastics for the USD/CAD are looking oversold as the pair approaches 1.0470 from the resistance line off of the October and November highs. Forex traders should note that a move lower in the pair could find support back at 1.0090 where the rising trend line from the July and December lows come into play. The 100-day moving average is also at 1.0080, a level that has proved to be supportive in October.

Forex Market Analysis provided by ForexYard.

© 2006 by FxYard Ltd

Disclaimer: Trading Foreign Exchange carries a high level of risk and may not be suitable for all investors. There is a possibility that you could sustain a loss of all of your investment and therefore you should not invest money that you cannot afford to lose. You should be aware of all the risks associated with Foreign Exchange trading.

 

Swiss National Bank Maintains Monetary, Currency Policy

The Swiss National Bank held its target for the 3-month franc LIBOR unchanged at 0-0.25 percent, and reaffirmed its commitment to the EURCHF 1.20 floor set on the 6th of September.  The Bank said it “will continue to enforce the minimum exchange rate of CHF 1.20 per euro with the utmost determination. It is prepared to buy foreign currency in unlimited quantities… Even at the current rate, the Swiss franc is still high and should continue to weaken over time. The SNB stands ready to take further measures at any time if  the economic outlook and the risk of deflation so require.”

The SNB intensified its 
currency measures over the past two months.  Switzerland reported annual consumer price inflation of -0.5% in November, down from 0.2% in August, compared to 0.50% in July, meanwhile, the Bank is forecasting inflation of 0.4% during 2011, while 2012 inflation is expected at -0.3% and 0.5% in 2013.  The Swiss economy grew 1.3% on an annual basis in the September quarter (2.3% in Q2 and 2.5% in Q1).  The Swiss franc (CHF) last traded around 1.22 against the Euro, and 0.94 against the US dollar.

What are the Commodities You Need to Place on Your Watch List for 2012?

By MoneyMorning.com.au

Diggers & Drillers editor, Dr Alex Cowie has just published a new presentation on where he sees the best investment opportunities for 2012.

As a follow up to the report, we cornered the Doc with some questions we had about the discoveries he’s made over the last 15 months… the bigger picture for commodities in the year ahead… and a few others to boot. Here’s what happened…

Money Weekend: Okay, straight up Alex. Why did you get told to “f*** off” by a copper mining executive?

Dr. Alex Cowie: I introduced myself at a conference and he told me to f*** off because I put a sell recommendation on his company. There’s not much good that can come from a conversation that starts like that. So I told him the conversation was over.

The share price of his company had fallen hard. I decided the time had come to take the loss and move on. This hadn’t pleased our friendly mining exec. But it was the right call – the stock has fallen much, much further since then.

The point is that I work for my readers. Not the mining companies.

My goal is to make money for readers. And if things aren’t going to plan, then I have to take the heat and make tough decisions. I can guarantee it’s no way to win a popularity contest. But the point is, it has saved readers from further losses time and time again.

I want to point out that I have a great deal of respect for the majority of the people in the mining sector. But there are a few rogues out there I can assure you, and I give them a wide berth. Most of them however are passionate, smart people who love their jobs. And getting on site or to conferences to meet them is the best part of my job.

MW: Right, it’s clear you prefer smaller sized companies at the riskier end of the ASX rather than safe blue-chips. Why is that? Wouldn’t it be best (and safer) for our readers to make money from the run-up in commodity prices just by buying BHP Billiton?

AC: Did you put the word ‘safe’ in the same sentence as ‘blue-chip’?

Have you seen Bluescope Steel [ASX:BSL] recently? That ‘safe blue-chip’ has lost 96% in the last 3 years. How about Energy Resources of Australia [ASX:ERA]? Down 95% in 2 years. APN New [ASX:APN] has wiped out 90%. That doesn’t sound safe to me.

As for BHP Billiton [ASX: BHP], investing in big mining companies is about as much fun as a root canal. Since the start of 2009, it’s gained 23%. Compare that to smaller iron stocks like Atlas [ASX:AGO], which has added 270%… or Flinders Mines [ASX:FMS] up 570% in the same timeframe.

The reason many fund managers invest in the blue-chips is because they have vast amounts of money to manage, the big stocks are the only ones large enough for them. Often they’re legally restricted to companies on the ASX200. With these stocks you can risk losing 30%, so you can have a crack at gaining 30%.

And take Australia’s biggest gold stock, Newcrest Mining [ASX: NSM]. Since April, it has fallen 22%. In the same time a South American gold explorer I tipped is up 66%.

Plus, there are around 800 small-cap mining stocks too small for the big players to touch. But this is a rich hunting ground for the everyday investor… if you’ve got some risk tolerance and patience. If you’re prepared to risk losing 30%, the stocks that do perform can often double or triple in price.

My job is to do filter out the duds and identify the stocks which have a real shot. First, I’m looking for companies exploring for, or producing, certain types of commodities. Then, I focus on the commodities that are set to keep rising in the next few years. But the list has gotten a lot shorter in the last six months. The chaos in Europe, a slowdown in China, and stagnating US economy are all making the fundamentals of many industrial commodities look very dodgy.

MW: Long time Money Morning readers know you’re a big fan of silver. And we know that’s a story you have your eye on for 2012. What other big resource trends do you see for the year ahead?

AC: I’ve got a few I’m watching this year. Palladium is a precious metal on my radar – a great deal of it comes from Russian stockpiles which are running out. This will cause a supply squeeze, and may trigger a price rally.

Potash and tungsten are other commodities I’ve backed since the start of the year. And I’m backing them again for 2012. They’re unlikely to be impacted by the global chaos as they’re too important to their end users. Potash is vital as a food fertiliser. And tungsten is used in military applications. Both commodities have risen steadily all year, and I don’t expect this to change.

Next year, I’ll focus more on changing geopolitical trends. China, in particular, is starting to throw its weight around. And the US is going head to head with it. We’ve had the currency war for years, now there’s a trade war stirring. This is a well-trodden path that leads to military brinkmanship. What we’re seeing has all the same signs as the lead up to the Cold War.

So, what I’ll ask next year is: What this means for Australia? And more specifically, what it means for the resources sector?

MW: You’ve closed out a number of winners ranging from 74% gains right up to 125%. But what about the losers? What’s your strategy for when a stock you recommend doesn’t perform as you expect?

AC: I always ask readers to decide their own sell level. Everyone has a different risk tolerance. For instance, you may say a 10% loss is as much as you can handle, so you decide in advance to sell if it falls that much.

Small-cap stocks can be notoriously volatile, meaning they can rise and fall wildly. If you’re used to seeing stocks move by 1 or 2%, it can be disconcerting when the price of a small-cap stock suddenly drops 20%. But this is exactly what can happen with many small-caps stocks that then go on to post gains of 100% or more.

I try to give stocks as much wiggle room as possible. However when a stock falls beyond an acceptable level, I email readers to let them know that it’s time to take the loss, recover their capital, and move on. I don’t publish this level, in order to encourage readers to choose their own risk level.

MW: Over the last year and a half you’ve hardly been in the office. You’ve been to countries like Botswana, Peru, Morocco, South Africa, Dominican Republic, the United States, Hong Kong… the list goes on. Not to mention just about every part of Australia. But what’s the real point in all this travel? Can’t you do all the research you need to from your desk here in Melbourne?

AC: In a word – No.

Put it this way. If you were internet dating, would you marry a person based on their internet profile alone? Ok. Bad example – plenty of people do that. But you get what I mean.

Staring at a screen can only get you so far. It’s my starting point to gather all the publically available information. But I back the people behind a project as much as the project itself. I spend a lot of time meeting with management. In fact, I’ve just caught up with two different companies just this morning [Friday]. I’ve had four coffees so far today – my hands are shaking!

I manage to get on site a great deal as well. What’s not to like about wandering around a wild part of Tasmania, Utah, Peru – wherever the project may be – and talking to interesting mining people? The real reason I go is to get the real story. Believe me when I say it’s helped Diggers & Drillers reader’s dodge a lot of bullets. I sleep well at night knowing I’ve done as much as I can to make sure I haven’t missed anything.

MW: Regular readers of Money Morning often hear us refer to you as “The Doc”. So let’s have it once and for all… what does the “Dr.” stand for?

AC: Early on in my life, I fulfilled a lifelong ambition of graduating as a Veterinarian. That took five years of intense study at the University of Liverpool in the UK. I then worked successfully as a Vet for ten years in seven different countries including UK, Australia, New Zealand, Kenya, Zimbabwe, Nepal and Thailand. This is where the Doctor comes from. I use it because I’ve earned it.

As an adult, my burning ambition became to work independently in the financial markets. People are always surprised when I tell the tale of my career change, but it was the best thing I ever did. The fact is that when it comes to being an analyst, I’ve found the scientific background to be excellent foundations for a career in finance. You need the ability to take on and process a huge amount of information when researching. Plus it prepared me for all the animals in the mining sector (joking).

As for the formal financial training, I completed a postgraduate Diploma in Applied Finance and Investment. I did this in my spare time years ago, and I recommend the course to anyone. I’m now currently halfway through a Masters degree in Finance, which I do on the side. I like learning and intend to make it a lifelong pursuit.

What I like about the markets is that they reward results, not training. And in that respect, I’ve found that having a methodical and scientific approach has been just as valuable in financial markets as it was at the clinic.

MW: Thank you Alex.

AC: No problem.

Shae Smith
Editor, Money Morning

P.S. With the recent sell-off in the gold price, now is a great time to top up on gold. And if Dr. Alex Cowie is right, it’s also a great time to stock up on cheap gold and silver stocks too. If you haven’t seen it yet, make sure you watch the Doc’s latest research presentation for what he says are the six best resource investments for 2012. Click here for details


What are the Commodities You Need to Place on Your Watch List for 2012?

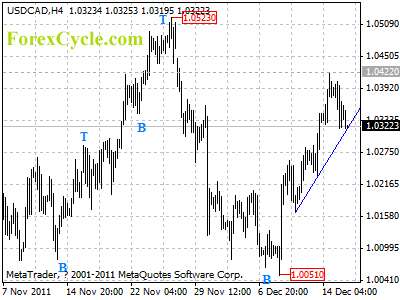
USDCAD is facing trend line support

USDCAD is facing the support of the upward trend line on 4-hour chart, a clear break below the trend line could indicate that a cycle top has been formed at 1.0422 on 4-hour chart, and the uptrend from 1.0051 has completed, then another fall towards 0.9900 could be seen. On the upside, as long as the trend line support holds, the fall from 1.0422 could possibly be consolidation of uptrend, and one more rise towards 1.0523 is still possible.

usdcad

Daily Forex Analysis

A More Profitable Investment Than Cheap Gold?

By MoneyMorning.com.au

Gold was down $3.31 yesterday. But, at last count, it’s still up $180.95 for the year.

Gold – Getting Smashed But Still Up 12.9%

1 Year Gold Price in AUD/oz

And the gold bulls are rubbing their hands with glee.

Yes! They think. This will shake out the weak hands. And the skittish investors. This will give me a chance to build my gold holding on the dips.

And they’re probably right.

But while they’re distracted, drooling over the thought of all that cheap gold, here’s an opportunity they might’ve missed…

1 Year Platinum

Platinum is down 19.8% for the year. And around 41% below its all-time high of $2252 an ounce.

So could there be an upside for platinum?

If you believe in precious metals as a store of wealth, this metal (which has suffered a much bigger knock down for the year than gold or silver) could be a good bet.

Don’t let the drop from $1900 to $1419 scare you off. Exchange Traded Funds traders are one of the biggest buyers of platinum in the world. And when the market started falling in August, the ETF traders sold out of platinum just like everything else.

But before you switch from gold to platinum, remember one thing: gold has a 5000-year history as the preferred medium of exchange. It’s not valuable because it’s shiny. Or yellow. Or because you dig it out of the ground. It’s valuable because it is an accepted medium of exchange.

That’s not likely to change. But if you can get over that and you’re looking to diversify your precious metals portfolio, platinum might be worth a look.

Aaron Tyrrell
Editor, Money Morning

Related Articles

Special Report: Six Extraordinary Resource Investment Opportunities for 2012

How to Buy Gold and Silver

The Only Gold and Silver Stocks to Buy

The Secret Aussie ‘Bank Run’ is a Sign to Buy Gold

Why Gold Should Become Your ‘Stay Rich’ Asset

From the Archives…

How to Turn Paper Money into Silver and Gold
2011-12-09 – Kris Sayce

Will Silver Break Through $50 an Ounce in 2012
2011-12-08 – Dr. Alex Cowie

Investing in the Market for Survival and Prosperity
2011-12-07 – Aaron Tyrrell

China, the U.S. and the Scramble for Commodities
2011-12-06 – Dr. Alex Cowie

Santa Claus: A Market Rally Not Worth the Risk
2011-12-05 – Kris Sayce

For editorial enquiries and feedback, email [email protected]


A More Profitable Investment Than Cheap Gold?

Are You Ready to Profit From the Credit Boom?

By MoneyMorning.com.au

A credit boom is like every other boom. The bigger it gets the more credit it needs to grow… Just as a rising share price needs even more investors to keep buying in order to push the price higher.

Once a share bubble pops, it’s pretty hard to re-inflate it. Investors lose faith. And the share price has to fall a long way before they’re prepared to buy it again.


The same goes for credit markets. With slower credit growth, odds are asset prices won’t rise as much. And that means investors will be less inclined to borrow to buy shares (because asset prices won’t rise enough to offset the interest cost of the debt).

And if price inflation doesn’t rise as much as people are used to, they’ll see less need to go into debt to buy goods… Because there’s a chance the goods won’t cost any more six or 12 months from now.

That spells bad news for companies used to reporting strong sales and profit growth.

Trouble is, those in power don’t want that to happen. So they’ll do anything in their power to stop it. And we mean anything… manipulating currencies, printing money, stealing client money to make leveraged bets (MF Global)… whatever it takes.

Ultimately, they don’t have the power to prevent the end of the credit boom without destroying private wealth. Because the end game is more money printing and more price inflation.

But in the meantime, it will appear to work. Just as the 2008-2009 stimulus measures appeared to work… at first. But at some point, the market will figure things out. Low interest rates and money printing aren’t working.

But rather than give up, the bigwigs will figure they just need to do more. And so the stimulus circus will start again. As the market shifts from stimulus to no stimulus and back to stimulus, well, that’s what will keep the markets super volatile.

That’s where – if you’re smart – you can act to profit from the manipulation.

Energy & Resources


You just need to make sure your portfolio is balanced in a way that helps you preserve your savings… while at the same time allocating a portion to assets that will benefit from an ongoing volatile market.

And the sectors we think will benefit the most from this volatility are energy and resources. Both have taken a beating in recent months and are almost certain to go higher when the central bankers engineer the next short-lived stock market rally.

It’s not a question of “if”, it’s just a matter of “when”.

Cheers.
Kris

P.S. To discover six ways to profit when energy and resources stocks turn back up again, click here

Related Articles

Special Report: Six Extraordinary Resource Investment Opportunities for 2012

How to Buy Gold and Silver

The Only Gold and Silver Stocks to Buy

The Secret Aussie ‘Bank Run’ is a Sign to Buy Gold

Why Gold Should Become Your ‘Stay Rich’ Asset

From the Archives…

How to Turn Paper Money into Silver and Gold
2011-12-09 – Kris Sayce

Will Silver Break Through $50 an Ounce in 2012
2011-12-08 – Dr. Alex Cowie

Investing in the Market for Survival and Prosperity
2011-12-07 – Aaron Tyrrell

China, the U.S. and the Scramble for Commodities
2011-12-06 – Dr. Alex Cowie

Santa Claus: A Market Rally Not Worth the Risk
2011-12-05 – Kris Sayce

For editorial enquiries and feedback, email [email protected]


Are You Ready to Profit From the Credit Boom?

Learn Elliott Wave Analysis Free: Often, The Basics is all You Need to Know

Often, basics is all you need to know.

By Elliott Wave International

Understand the basics of the subject matter, break it down to its smallest parts — and you’ve laid a good foundation for proper application of… well, anything, really. That’s what we had in mind when we put together our free 10-lesson online Basic Elliott Wave Tutorial, based largely on Robert Prechter’s classic “Elliott Wave Principle — Key to Market Behavior.” Here’s an excerpt:

Successful market timing depends upon learning the patterns of crowd behavior. By anticipating the crowd, you can avoid becoming a part of it. …the Wave Principle is not primarily a forecasting tool; it is a detailed description of how markets behave. In markets, progress ultimately takes the form of five waves of a specific structure.

The personality of each wave in the Elliott sequence is an integral part of the reflection of the mass psychology it embodies. The progression of mass emotions from pessimism to optimism and back again tends to follow a similar path each time around, producing similar circumstances at corresponding points in the wave structure.

These properties not only forewarn the analyst about what to expect in the next sequence but at times can help determine one’s present location in the progression of waves, when for other reasons the count is unclear or open to differing interpretations.

As waves are in the process of unfolding, there are times when several different wave counts are perfectly admissible under all known Elliott rules. It is at these junctures that knowledge of wave personality can be invaluable. If the analyst recognizes the character of a single wave, he can often correctly interpret the complexities of the larger pattern.

The following discussions relate to an underlying bull market… These observations apply in reverse when the actionary waves are downward and the reactionary waves are upward.

1) First waves — …about half of first waves are part of the “basing” process and thus tend to be heavily corrected by wave two. In contrast to the bear market rallies within the previous decline, however, this first wave rise is technically more constructive, often displaying a subtle increase in volume and breadth. Plenty of short selling is in evidence as the majority has finally become convinced that the overall trend is down. Investors have finally gotten “one more rally to sell on,” and they take advantage of it. The other half of first waves rise from either large bases formed by the previous correction, as in 1949, from downside failures, as in 1962, or from extreme compression, as in both 1962 and 1974. From such beginnings, first waves are dynamic and only moderately retraced.


Read the rest of this 10-lesson Basic Elliott Wave Tutorial online now, free!

Here’s what you’ll learn:

  • What the basic Elliott wave progression looks like
  • Difference between impulsive and corrective waves
  • How to estimate the length of waves
  • How Fibonacci numbers fit into wave analysis
  • Practical application tips for the method
  • And More

Keep reading this free tutorial today.

This article was syndicated by Elliott Wave International and was originally published under the headline Learn Elliott Wave Analysis — Free. EWI is the world’s largest market forecasting firm. Its staff of full-time analysts led by Chartered Market Technician Robert Prechter provides 24-hour-a-day market analysis to institutional and private investors around the world.


Denmarks Nationalbank Cuts Rate Further 10bps to 0.7%

The Danmarks Nationalbank cut its key lending rate by 10 basis points to 0.70% from 0.80% and reduced the current account rate 5bps to 0.25%, effective from 16 December.  The Bank also cut rates on the 8th of December following the ECB rate cut, at that time it cut the lending rate 40bps to 0.8%, and reduced its other interest rates by 25 basis points.  The Bank said in its press release: “The interest rate reduction follows Danmarks Nationalbank’s purchase of foreign exchange in the market.”

Denmark’s central bank last raised the lending rate by 25 basis points to 1.55% in July this year, after increasing the rate by 25 basis points in April this year, mirroring the interest rate increases by the European Central Bank (ECB).  The Danish Central Bank typically follows the moves of the ECB in order to keep its currency, the Krone, stable.  Denmark reported an annual inflation rate of 2.6% in August and 2.9% in July, compared to 3.1% in May, and 2.9% in April this year.  


The Bank also announced a new liquidity program last month.  The Danish economy grew at a year on year rate of 2% in Q2, compared to 1.7% in Q1 2011 (2.9% in Q4 2010).  The Danish krone (DKK) has weakened about 3% against the US dollar this year, and last traded around 5.71.

Okubo Says Japan’s Growth to Expand in Fourth Quarter

Dec. 15 (Bloomberg) — Takuji Okubo, chief Japan economist at Societe Generale, discusses the nation’s manufacturing sentiment, growth outlook and expectations for Bank of Japan monetary policy. He speaks from Tokyo with Linzie Janis on Bloomberg Televison’s “First Look.” (Source: Bloomberg)