Is the iPhone 4 Causing the Nasdaq to Fall?

By Dan Eduard – With the release of the iPhone 4 dominating headlines, it may be a good time to take a look at how the popular device may be impacting the U.S. stock markets. Most of the press surrounding the iPhone 4 more or less reads the same. Talk of 1.7 million units being sold in only three days and of how Apple is now expanding the number of companies it will distribute the iPhone with, might lead spectators to certain assumptions.

If the iPhone is such a hot product, shouldn’t Apple’s stock be rising in value? Furthermore, shouldn’t the Nasdaq 100, where Apple trades, also be moving up? Investors may be surprised at the answers to both questions.

Apple’s shares on the Nasdaq 100 are down over 2% for the month of June. This is despite the seemingly endless demand for the iPhone. In addition, Apple recently announced that starting in January, Verizon will be able to sell the iPhone along with AT&T.

So how do we explain the drop in the stock market? It appears that Wall Street is waiting to see how well Verizon is able to market the iPhone ahead of its January release date. Furthermore, a perceived over saturation in the market may be causing investors to hesitate regarding the long-term success of the latest Apple product.

While we have explained the drop in Apple’s stock, how should we interpret the drop in the Nasdaq? After all, Apple is only one of 100 companies trading on this specific exchange. As seen in the chart below, the Nasdaq has entered a downward trend that began around June 21st. In order to understand this phenomenon, it is helpful to take a look at recent developments surrounding the iPhone 4.

Demand for the iPhone has been so high, that customers appear to be abandoning its competitor, the Blackberry. Blackberry is owned by Research in Motion, a company which recently saw its stock drop a shocking 4% in a single afternoon. It just so happens, that Research in Motion also trades on the Nasdaq 100. This could go a long way in explaining the Nasdaq’s recent bearish trend.

So to answer our original question: Is the release of the iPhone 4 causing the Nasdaq to fall? Most likely it is a contributing factor, although in no way the only one. Indices like the S&P 500 and Dow Jones Industrials have also bearish trends in recent days. That being said, when a product such as the iPhone is introduced into the market place, its impact can be felt in many different ways.

What do you think? Can a single product impact the stock market?

Nasdaq 100

Forex Market Analysis provided by Forex Yard.

© 2006 by FxYard Ltd

Disclaimer: Trading Foreign Exchange carries a high level of risk and may not be suitable for all investors. There is a possibility that you could sustain a loss of all of your investment and therefore you should not invest money that you cannot afford to lose. You should be aware of all the risks associated with Foreign Exchange trading.

Australian Retail Sales edge higher in May. Building Approvals fall.

By CountingPips.com

Australian retail sales data released earlier today showed that sales edged higher in May but came in lower than expected. Retail sales increased by 0.2% on a seasonally adjusted basis to A$20.155 billion in the month of May following a seasonally adjusted increase of 0.6% in April, according to data by the Australian Bureau of Statistics. The sales results have increased for three straight months but May’s sales level represented the slowest increase of those three months.

The data failed to match market forecasts that were expecting the sales level to reach 0.3% for the month.

Contributing to the increase in retail sales for May was a gain by 1.7% in the clothing, footwear and other personal accessory retail sector while department store sales registered a 1.0% increase for the month. Also showing gains for the month were cafés, restaurants and take away food services (+0.8%), other retailing (+0.3%), and food retailing (0.2%). The largest negative contributor to the sales level in May was sales in household goods retailing which decreased by 1.4%.

New South Wales led the way for states and territories in retail sales increases with a 0.9% gain while Victoria also showed an increase by 0.2%. South Australia, Queensland, Tasmania, Western Australia, the Northern Territory and the Australian Capital Territory all registered negative retail sales levels in May.

In a separately released by the Australian Bureau of statistics, the total number of building units approved in May fell by a seasonally adjusted 6.6% compared to April. On an annual basis and despite the monthly decline, Australian building approvals are 26.6% above the May 2009 level. May private sector houses approved increased by 1.7% on a seasonally adjusted basis and are 9.2% higher on an annual basis.

Red Alert on the Dow! Watch Out! – July 1, 2010

dow, dow jones, dow jones industrial, dow jones industrial average, DJIA, ^DJI, industrial average, US market, daily stock picks

Red alert on the Dow! Watch out! The Dow Jones Industrial Average (^DJI) is at risk of breaking down! From my last post about the index a couple of days ago (kindly check my past entry here), it has finally approached the neckline of a head and shoulders pattern. The NASDAQ, which I presented earlier today (see here), already shows a breakdown from the same formation. Now, will the Dow follow suit? Let’s hope not but there’s a big possibility that it might. The MACD in i ts daily time frame has already turned negative, suggesting a likely down move soon. Moreover, the RSI is also indicating that its downside momentum is gaining speed. So if and when the DJIA falls below the neckline support, it could slide all the way to 8,250.00. Now, that’s a huge drop! But if the neckline holds (I’m crossing my fingers that it does), the index could once again bounce and at least aim for the previous high around 10,500.00.

The recent decline in the index was due to the less-than-stellar rise in China’s leading economic indicator which only rose by 0.3% after posting a gain of 1.7% in the previous month. This was followed up by a weak US ADP employment change number that showed that US firms only hired about 13,000 new employees in June as opposed to the 60,000 expected.

Today, the major markets could once again experience some selling pressure if the US’s pending home sales have indeed dropped by 7.4% or worse in May. The US’s ISM manufacturing PMI is likewise seen to cool down to 58.9 from 59.7. This could pull the index down as well.

Tomorrow’s big time event that will surely cause some volatility on the markets will be the release of the US NFP employment change. according to the estimate of the government’s actual figure, US firms have cut about 103,000 jobs. Now, if the ADP number is correct, the NFP could also come in worse. Such would likely spark some broad based risk aversion, causing the equities and the non-dollar currencies to lose ground.

More on LaidTrades.com

NZD/USD Bullish Correction May BE in the Making

By Anton Eljwizat – The NZD has dropped significantly versus the USD in the past several days, and it is currently traded around 0.6805. And now as evident in the data below, the 8-hour chart is giving bullish signals, indicating that NZD/USD pair might go up. Forex traders can take advantage of this impending movement by having their Entry Orders in place to capture this reversal.

• Below is the 8-hour chart of the NZD/USD currency pair.

• The technical indicators that are used are the William Percent Range, Relative Strength Index (RSI), and Slow Stochastic.

• Point 1: There is a “doji” candlestick that has formed on the chart, indicating that a reversal should take place.

• Point 2: The Slow Stochastic indicates a bullish cross, signaling that the next move may be in an upward direction.

• Point 3: Point 1: The Relative Strength Index (RSI) indicates that the price of this cross currently floats in the oversold territory, signaling upward pressure.

• Point 4: The Williams Percent Ranges is showing that this pair is heavily over-sold and may be experiencing strong upward pressure.

NZD/USD 8-Hour Chart

Forex Market Analysis provided by Forex Yard.

© 2006 by FxYard Ltd

Disclaimer: Trading Foreign Exchange carries a high level of risk and may not be suitable for all investors. There is a possibility that you could sustain a loss of all of your investment and therefore you should not invest money that you cannot afford to lose. You should be aware of all the risks associated with Foreign Exchange trading.

Forex Market Review 07/01/2010

Market Analysis by Finexo.com

The Yen and the Dollar appreciated against their major currency counterparts as investors fled to more risk adverse assets amid rising concerns that the global economic recovery may be faltering. The Euro tumbled to a historical low level against the Swiss Franc after this morning’s weaker than expected Chinese Purchasing Manager’s Index re-ignited fears about the stability of the global recovery.

Up ahead, key Manufacturing data from both the US and UK will be released today. Manufacturing has been one of the few bright spots amongst a sea of disappointing figures throughout global economic recovery. Traders will be watching to see whether these positive trends continue. If they do, it will surely sooth investors fears over the possibility of a double dip recession.

EUR/USD
Selling pressure returned to the EUR/USD, as the forex market saw the Euro slip 0.1% to $1.2211. Risk sentiments are expected to dictate the direction of today’s sessions and if current negative sentiments continue the EUR/USD could very well return to the low of $1.2150 seen earlier this week.

The Euro rose yesterday as news broke that the European Banks had borrowed a substantially smaller amount from the ECB, than previously thought.  A report that the banks had borrowed 131.9 billion Euros instead of 210 billion Euros over a three month period pushed investors to buy the Euro as they realized that the European banks might be in a better financial state than they previously suspected. However, the amount still remains the highest ever borrowed in a three-month period and pales in comparison to the 442 billion Euros of one-year money which banks must repay to the ECB today.

Yesterday’s rally was short lived following a smaller than expected increase in U.S private sectors jobs, and a sound warning issued by Moody’s rating agency that it will cut Spain’s debt rating again.

Support/Resistance 1.2150/1.2245

GBP/USD
Positive trading momentum from last week’s Budget Release seems to have faded. The British currency slipped to a fresh 3-day low against the Dollar yesterday, after June’s ADP Non-Farm Payrolls showed a disappointing increase in the number of U.S private jobs.  The Pound hit $1.4965 during European afternoon trade, its lowest level since June 25th. Despite retreating from a high of $1.5100, seen earlier this week, the GBP/USD has found buying support around 1.4900/1.4950 and could easily rally higher if today’s Manufacturing figure is higher than predicted.

Support/Resistance 1.4900/1.4980

Forex Market Review & Analysis by Finexo.com

Disclaimer: Trading the foreign exchange (Forex) carries a high level of risk, and may not be suitable for all investors. All information and opinions contained on this website are to be used for general informational purposes only and do not consitute investment advice.

GBP/USD – Bullish or Bearish; Make the Call

By Greg Holden – One of my favorite currency pairs for technical analysis is the GBP/USD. I’ve always enjoyed the trading behavior of the Majors for the simple fact that everyone cares more about them and the liquidity allows for relatively smoother movements. The more exotic pairs can be interesting, indeed, but the Majors never let you down. But this past week has put me in a bind regarding this favorite.

So I’ve decided to hit the “streets” and offer my take, hoping that the analysts among us can pitch in and help make sense of this.

The GBP/USD has two distinct signals completely at odds with one another. On one hand, the daily chart shows the pair trading within a very clear bullish channel, with the current price sitting at a trough within this trend. On the other, we have the weekly chart showing the pair within a clear bearish channel, sitting at a peak within this larger trend.

GBP/USD – Daily Chart

GBP/USD – Weekly Chart

To make matters worse, the MACD/OsMA on both is showing the opposite of what we’d normally expect. On the daily chart, where we’d expect to see bullish signals, we actually have a bearish signal; and vice versa on the weekly chart (see below).

Now, there is plenty of news to support a strengthening of safe-havens like the USD – such as the decline in CB Consumer Confidence figures yesterday and the forecast for a drop in NFP employment figures tomorrow – and there is also some data which supports a weakening GBP, such as declines in the UK housing market and the recent austerity budget.

So the hypothesis I would propose is to get away from these bearish and bullish channel analyses and change our perspective to a different chart formation taking place. On the daily chart we can also see, besides the bullish channel, a rising wedge formation with strong resistance lines roughly at 1.5160 and 1.5510. The signals would make more sense in this regard in that our daily MACD would show that a test of the lower border of the wedge is anticipated, but the weekly chart’s bullish signals point us in the direction of thinking that it will fail to breach and continue towards the apex of our wedge.

GBP/USD – Rising Wedge?

What’s your take? Should we follow the channel analyses and take a guess at which one is the more relevant, the daily or weekly chart? Or do we change focus and attempt a different interpretation of the data available to us?

Forex Market Analysis provided by Forex Yard.

© 2006 by FxYard Ltd

Disclaimer: Trading Foreign Exchange carries a high level of risk and may not be suitable for all investors. There is a possibility that you could sustain a loss of all of your investment and therefore you should not invest money that you cannot afford to lose. You should be aware of all the risks associated with Foreign Exchange trading.

Bear Market Alert on the Nasdaq Composite! – July 1, 2010

nasdaq composite july 1, nasdaq, us stock index, stock analysis, daily stock picks,

Good day to you people! It is sad to say that I got some bad news to deliver to you. The Nasdaq composite is an stock market index in the US that has over 3,000 listed technology and growth companies. This composite, though, is not exclusively a US index since non-US companies are listed here as well. In any case, this composite is one of the three major indices, alongside the DJIA and the S&P 500, that are highly followed by investors. Yesterday, however, the index plunged with a 1.21% loss, breaking the neckline of a head and shoulders formation in the process. The weak actually started off on a sour note as it opened with a bearish gap and was followed by two consecutive days of heavy losses. If the index is not able to creep back above the neckline, it would more likely drop further until it reaches its downside target at around 1,750.00. This scenario would actually place the index back on a bear market again. A couple of indicators suggest that this could happen. the first one is the MACD which already turned negative. The other one is the RSI which is now showing that the index is gaining some downside momentum. On the bright side, if risk aversion disappears and the buying resumes, the index could bounce back until it meets some resistance somewhere at 2,300.00.

Monday’s gap down was due to the poor results of China’s leading economic indicators. One of China’s leading barometers failed to get some fans when it only showed a gain of 0.3% after rising by 1.7% the other month. Yesterday’s drop, on the other hand, was due to the weak US ADP report which only showed that US firms had added 13,000 new workers as against the 61,000 expected. This weaker-than-expected result, now, could also reflect on the US government’s actual figure which will be reported this Friday. A less-than-stellar count in the NFP employment change would more likely hit the markets hard. Equities alongside  the non-dollar currencies like the AUD, NZD, CAD, EUR, GBP would further lose their appeal versus the safer ones like bonds, USD and JPY.

Meanwhile, the expected 7.4% slide in the US’s pending home sales, which is due for release today at 2:00 pm GMT could likewise place some selling pressure on equities and the major non-dollar currencies as well.

More on LaidTrades.com

EUR/USD Spikes after European Banks Appear Stronger than Expected

Source: ForexYard

The EUR/USD pair took off during yesterday’s trading session. The rally was supported by low demand for loans offered by the ECB to European banks. Investors realized European banks might be in better financial conditions than previously thought and responded by buying the euro while selling other currencies. However, the rally halted following a disappointing U.S. private sector jobs report, and later by warnings from ratings agency Moody’s that it will downgrade Spain’s sovereign debt rating.

Economic News

USD – ADP Figure Comes in Significantly Lower Than Expected

The dollar started yesterday’s trading session on a bad note, taking losses against the euro as investors put aside fears about euro-zone economies. EUR/USD reached a high of 1.2303, before falling back later in the day. The ADP Non-Farm Payrolls Report, which was forecasted to show an addition of 59K U.S. jobs, came in well below expectations. Subsequently, investor fears regarding the pace of the global economic recovery kept downward pressure on oft-traded EUR/USD pair. Better news later in the day, which showed that American business activity grew for the ninth month straight, kept EUR/USD up but unable to break the 1.2300 level.

EUR/USD is currently trading at 1.2207$. Against the CAD, the greenback soared some 88 pips higher in response to a decline in crude oil prices. With regards to the yen, the USD traded relatively flat and seemed to have reached a turning point as sell pressure declined after the approached the 88.00 level.

Looking ahead to today, traders are advised to pay attention to a number of reports set to be published throughout the day. The ISM Manufacturing PMI and the U.S. Pending Home Sales report are both forecasted to show a decline in the overall state of the U.S. economy. Should the predictions come true, traders can expect EUR/USD to drop further.

EUR – Spain’s Ratings Downgrade Warning Stopped Euro’s Rally

EUR/USD started yesterday’s trading session on a high note, supported by low demand for loans offered by the ECB to European banks. Investors realized European banks might be in better financial conditions than previously thought and responded by buying the Euro while selling other currencies. However, the rally was halted following a disappointing reading on U.S. private sector jobs, and later by warnings from ratings agency Moody’s that it will downgrade Spain’s sovereign debt rating.

Eventually the euro ended yesterday higher against the U.S. dollar. Positive news from the euro-zone showed a decline in German unemployment and a surprisingly strong Irish GDP growth report. In contrast to the euro, the British pound declined against the U.S. dollar to the lowest price since last Friday.

Looking ahead to today investors should pay attention to the British Manufacturing PMI and the weekly U.S. Unemployment Claims report. Both are set to impact European currencies, with most analysts forecasting a further decline in confidence in the global economic recovery as a result. In this case, riskier currencies like the pound and euro are likely to drop.

JPY – Yen Approaching Resistance Line Against USD

The yen is about to end its 4th consecutive week of gains against the U.S. dollar. It is currently trading at 88.30, after the U.S. economic news came in far worse then expected. The USD/JPY is reaching a resistance level where sell pressure is expected to decline as more buyers enter the market at the current rate price.

Both the Japanese yen and U.S. dollar are considered safe haven currencies, but investors as of late seem slightly more in favor of the yen over the USD. Looking ahead to today, investors should pay attention to the numerous U.S. economic indicators set to be released. If they disappoint, the yen should continue to strengthen against the U.S. dollar, possibly taking the pair below $88.

Crude Oil – Fears Regarding Pace of Economic Growth hit Oil Prices

Crude oil prices declined yesterday after U.S. fuel stocks unexpectedly rose as reported by the US Energy Information Administration. U.S. crude oil stocks however, fell by 2.01 million barrels, more than double the expected figure.

Crude oil is currently trading around $75 a barrel. The price of oil has the potential to drop further, should the numerous U.S. economic indicators set to be released today further dampen investor confidence in the global economic recovery.

Gold on the other hand traded relatively flat yesterday, after recent days in which the price was quite volatile. The weekly chart is indicating current levels are high, therefore in the medium term gold price might decline.

Technical News

EUR/USD

The EUR/USD cross has experienced a bearish trend for the past 2 dayss. However, it seems that this trend may be coming to an end. For example, the 2-hour chart’s Stochastic Slow signals that a bullish reversal is imminent. . Going long with tight stops might be a wise choice.
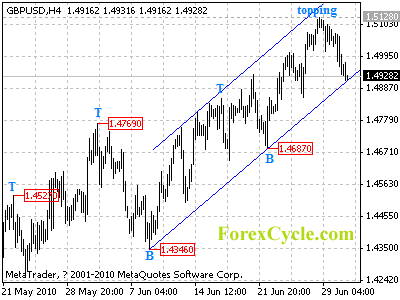
GBP/USD

The hourly chart is showing mixed signals with its RSI fluctuating at the neutral territory. However, the 4-hour Chart’s RSI is already floating in the oversold territory indicating that a bullish correction might take place in the nearest future. When the upwards breach occurs, going long with tight stops appears to be preferable strategy.

USD/JPY

The price of this pair appears to be floating in the over-sold territory on the daily chart’s RSI indicating an upward correction may be imminent. The upward direction on the 4 hour chart’s Momentum oscillator also supports this notion. Going long might be a wise choice.

USD/CHF

The cross has experienced much bearishness in the past month, and currently stands at the 1.0730 level. There is much evidence in the chart’s oscillators that supports a possible bullish correction today. This is supported by the daily chart’s RSI. Going long with tight stops may turn out to bring big profits today.

The Wild Card

NZD/USD

After the recent sharp drop a correction may be taking place today as the RSI seems to be floating in the oversold territory on the hourly and 8 hour charts and a bullish cross is evident on the 4 hour chart’s Slow Stochastic. Forex traders may be advised to go long for the day.

Forex Market Analysis provided by Forex Yard.

© 2006 by FxYard Ltd

Disclaimer: Trading Foreign Exchange carries a high level of risk and may not be suitable for all investors. There is a possibility that you could sustain a loss of all of your investment and therefore you should not invest money that you cannot afford to lose. You should be aware of all the risks associated with Foreign Exchange trading.

Forex Daily Market Review July 01, 2010

By eToro – The Euro rallied as few borrowers repurchased their loans with the ECB.  The Euro nears to break through hourly resistance near 1.2350, to move to the top of the range near 1.2450. Click here to read the full daily Review

Forex Market Analysis provided by eToro

Disclaimer: Trading in the Foreign Exchange market might carry potential rewards, but also potential risks. You must be aware of the risks and are willing to accept them in order to trade in the foreign exchange market. Don’t trade with money you can’t afford to lose.

GBPUSD is forming a cycle top at 1.5128

GBPUSD is forming a cycle top at 1.5128 level on 4-hour chart. Key support s now at the lower border of the rising price channel, now at 1.4910, a clear break below the channel support will confirm the cycle top and indicate that the uptrend from 1.4346 is complete, then the following downtrend could bring price back towards 1.4230 previous low. However, as long as the channel support holds, uptrend is expected to continue and one more rise to 1.5400 is still possible.

gbpusd

Daily Forex Forecast