USDJPY Forex Trading Pivot Point Levels for 2013.11.12

2013.11.12 14:00 7:00AM ET | USDJPY Currency Pair

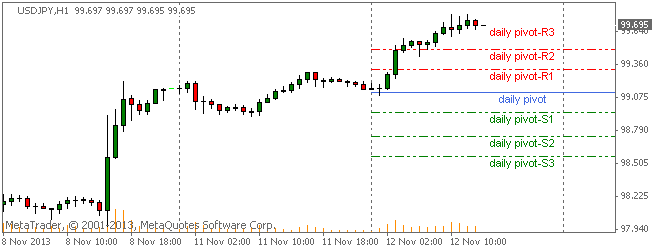
Here are the current Pivot Points Levels with Support (S) and Resistance (R) for the USDJPY currency pair. Price action is currently trading well over the daily pivot point at the 99.695 price level, according to data at 7:00 AM ET. The pair opened the Asian trading session earlier today slightly above the daily pivot and has trended sharply higher so far today to over the R3 resistance level.

SC USDJPY 2013.11.12

Daily Pivot Point: 99.117
— S1 – 98.944
— S2 – 98.741
— S3 – 98.568
— R1 – 99.320
— R2 – 99.493
— R3 – 99.696


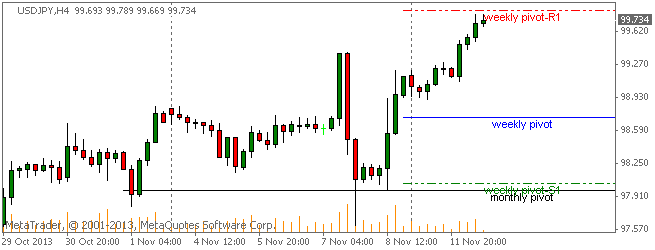
Weekly Pivot Points: USDJPY

Prices are currently trading over the weekly pivot point at time of writing. The USDJPY has been on a bullish pace so far this week after opening the trading week above the weekly and monthly pivots and now trades at the R1 resistance weekly level.

SC USDJPY 2013.11.12

Weekly Pivot Point: 98.721
— S1 – 98.040
— S2 – 96.929
— S3 – 96.248
— R1 – 99.832
— R2 – 100.513
— R3 – 101.624


By CountingPips.com – Forex Trading Apps & Currency Trade Tools


Disclaimer: Foreign Currency trading and trading on margin carries a high level of risk and volatility and can result in loss of part or all of your investment. All information and opinions contained do not constitute investment advice and accuracy of prices, charts, calculations cannot be guaranteed.


GBPUSD Forex Trading Pivot Points: Pound drops sharply to US Dollar

2013.11.12 | GBPUSD Currency Pair

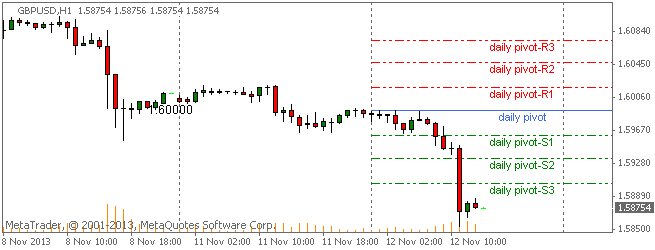
Here are the current Pivot Points Levels with Support (S) and Resistance (R) for the GBPUSD currency pair. Price action is currently trading sharply lower than the daily pivot point at the 1.58754 price level, according to data at 7:00 AM ET. The pair opened the Asian trading session earlier today slightly below the daily pivot and has dropped lower over the course of the day falling all the way through the S3 support level.

SC GBPUSD 2013.11.12

Daily Pivot Point: 1.59910
— S1 – 1.59611
— S2 – 1.59344
— S3 – 1.59045
— R1 – 1.60177
— R2 – 1.60476
— R3 – 1.60743


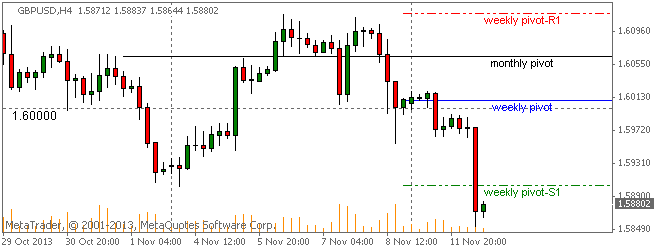
Weekly Pivot Points: GBPUSD

Prices are currently trading under the weekly pivot point at time of writing on Tuesday Nov, 12th. The GBPUSD has been on a bearish pace this week after opening the trading week slightly below the weekly pivot and further below the monthly pivot.

SC GBPUSD 2013.11.12

Weekly Pivot Point: 1.60101
— S1 – 1.59035
— S2 – 1.57957
— S3 – 1.56891
— R1 – 1.61179
— R2 – 1.62245
— R3 – 1.63323


By CountingPips.comForex Trading Apps & Currency Trade Tools

Disclaimer: Foreign Currency trading and trading on margin carries a high level of risk and volatility and can result in loss of part or all of your investment. All information and opinions contained do not constitute investment advice and accuracy of prices, charts, calculations cannot be guaranteed.
 

EURUSD Forex Trading Pivot Point Levels for 2013.11.12

2013.11.12 14:00 7:00AM ET | EURUSD Currency Pair

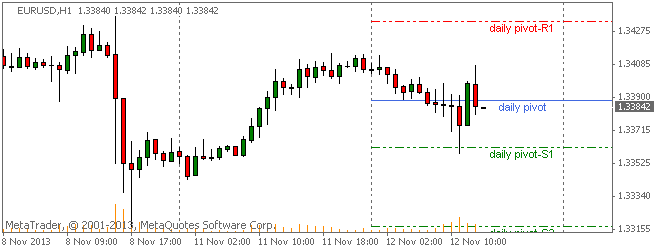
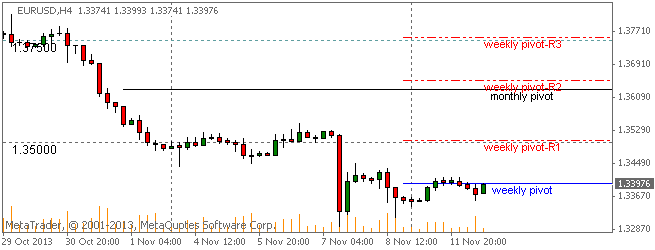
Here are the current Pivot Points Levels with Support (S) and Resistance (R) for the EURUSD currency pair. Price action is currently trading below the daily pivot point at the 1.33842 price level, according to data at 7:00 AM ET. The pair opened the Asian trading session earlier today higher than the daily pivot and has trended lower over the course of the day. The pair found support at the S1 support level earlier today and retraced back to the pivot area.

SC EURUSD 2013.11.12

Daily Pivot Point: 1.33884
— S1 – 1.33617
— S2 – 1.33171
— S3 – 1.32904
— R1 – 1.34330
— R2 – 1.34597
— R3 – 1.35043


Weekly Pivot Points: EURUSD

Prices are currently trading right on top of the weekly pivot point at time of writing. The EURUSD has been on a slightly bullish pathce so far this week after opening the trading week below the weekly pivot.

SC EURUSD 2013.11.12

Weekly Pivot Point: 1.34001
— S1 – 1.32535
— S2 – 1.31482
— S3 – 1.30016
— R1 – 1.35054
— R2 – 1.36520
— R3 – 1.37573


By CountingPips.comForex Trading Apps & Currency Trade Tools


Disclaimer: Foreign Currency trading and trading on margin carries a high level of risk and volatility and can result in loss of part or all of your investment. All information and opinions contained do not constitute investment advice and accuracy of prices, charts, calculations cannot be guaranteed.
 

USDCHF Forex Trading Pivot Point Levels for 2013.11.12

2013.11.12 14:00 7:00AM ET | USDCHF Currency Pair

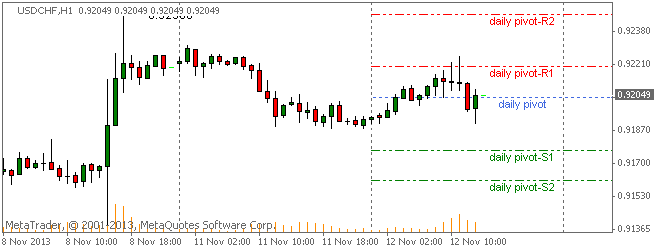
Here are the current Pivot Points Levels with Support (S) and Resistance (R) for the USDCHF currency pair. Price action is currently trading slightly over the daily pivot point at the 0.92049 price level, according to data at 7:00 AM ET. The pair opened the Asian trading session earlier today below the daily pivot and has traded higher over the course of the day, hitting the R1 resistance level before coming back to today’s pivot point.

SC USDCHF 2013.11.12

Daily Pivot Point: 0.92039
— S1 – 0.91769
— S2 – 0.91612
— S3 – 0.91342
— R1 – 0.92196
— R2 – 0.92466
— R3 – 0.92623


Weekly Pivot Points: USDCHF

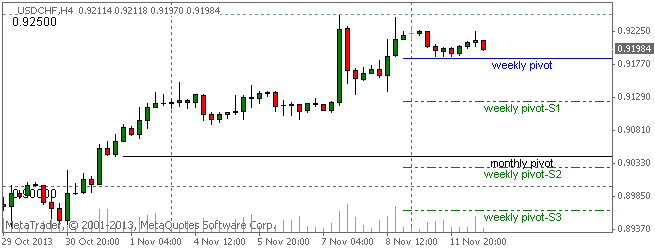
Prices are currently trading over the weekly pivot point early in the trading week. The USDCHF has been on a slightly bearish pace so far this week after opening the trading week higher than the weekly and monthly pivots.

SC USDCHF 2013.11.12

Weekly Pivot Point: 0.91860
— S1 – 0.91233
— S2 – 0.90273
— S3 – 0.89646
— R1 – 0.92820
— R2 – 0.93447
— R3 – 0.94407


Monthly Pivot Point: 0.90441
— S1 – 0.89112
— S2 – 0.87563
— S3 – 0.86234
— R1 – 0.91990
— R2 – 0.93319
— R3 – 0.94868


By CountingPips.comForex News & Forex Trading Apps


Disclaimer: Foreign Currency trading and trading on margin carries a high level of risk and volatility and can result in loss of part or all of your investment. All information and opinions contained do not constitute investment advice and accuracy of prices, charts, calculations cannot be guaranteed.
 

USDJPY Daily Fibonacci Forex Levels & Trends Data 2013.11.11

2013.11.11 | USDJPY Market Analysis

USDJPY Trends & Fibonacci Retracement Levels

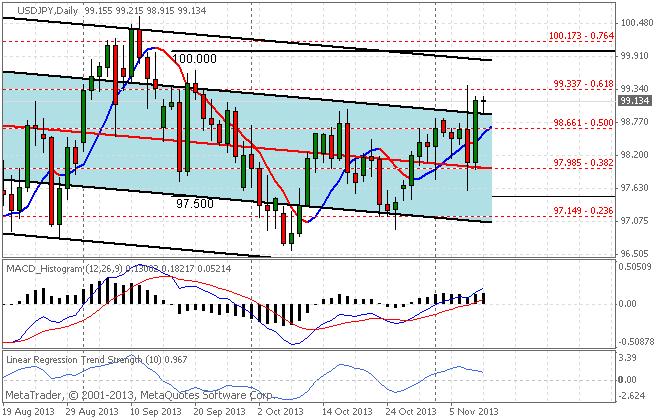
The USDJPY currency pair has been rising slightly in forex market trading today with the USDJPY registering a high of 99.215 and a low of 98.915 over the day. Trends data shows the pair is currently in a short-term uptrend as prices are trading above our favored short-term moving average (21 periods). Over the longer term trend, as seen on the chart by the 90 day Linear Regression Channels, the pair continues to be in an downtrend. Look for resistance into the 99.37 level over the next few days with the 100 level looming above.

SC USDJPY 2013.11.11


USDJPY Trends Data: Linear Regression Indicator

10-day current trend is BULLISH / Trend strength of 103.7 pips
30-day current trend is BULLISH / Trend strength of 122.9 pips
60-day current trend is BEARISH / Trend strength of -56.1 pips
90-day current trend is BEARISH / Trend strength of -107.9 pips
180-day current trend is BULLISH / Trend strength of 167.7 pips


By CountingPips.comForex Trading Apps & Currency Trade Tools


Disclaimer: Foreign Currency trading and trading on margin carries a high level of risk and volatility and can result in loss of part or all of your investment. All information and opinions contained do not constitute investment advice and accuracy of prices, charts, calculations cannot be guaranteed.


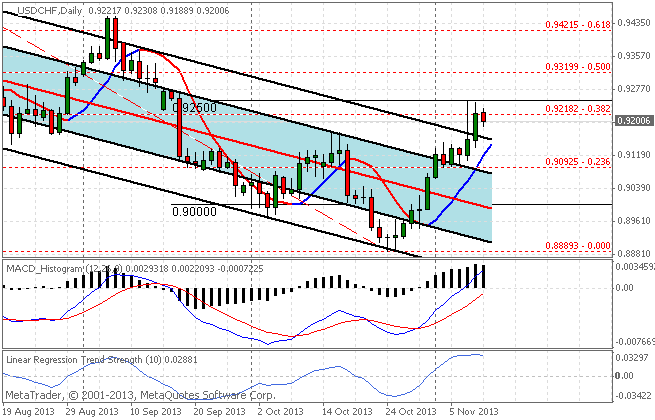
USDCHF Daily Forex Fibonacci Levels & Trends Data 2013.11.11

2013.11.11 | USDCHF Market Analysis

USDCHF Trends & Fibonacci Retracement Levels

The USDCHF currency pair has been on the decline in forex market trading today with the USDCHF making a high of 0.92308 and a low of 0.91889 on the day. Trends data shows the pair is currently in a short-term uptrend with prices  trading above our favored short-term moving average (21 Periods). Over the longer term trend, as seen on the chart by the 90 day Linear Regression Channels, the pair continues to be in a downtrend although prices are trading outside our 2nd channel which constitutes a extreme deviation from the longer-term trend. Look for 0.9250 to present major resistance above.

SC USDCHF 2013.11.11


USDCHF Trends Data: Linear Regression Indicator

10-day current trend is BULLISH / Trend strength of 277.8 pips
30-day current trend is BULLISH / Trend strength of 70.2 pips
60-day current trend is BEARISH / Trend strength of -286.8 pips
90-day current trend is BEARISH / Trend strength of -451.0 pips
180-day current trend is BEARISH / Trend strength of -448.6 pips

Fibonacci Retracement Levels

— 0.000 – 0.88893
— 0.236 – 0.90925
— 0.382 – 0.92182
— 0.500 – 0.93199
— 0.618 – 0.94215
— 0.764 – 0.95472
— 1.000 – 0.97504


By CountingPips.comForex Trading Apps & Currency Trade Tools


Disclaimer: Foreign Currency trading and trading on margin carries a high level of risk and volatility and can result in loss of part or all of your investment. All information and opinions contained do not constitute investment advice and accuracy of prices, charts, calculations cannot be guaranteed.


EURUSD Daily Forex Fibonacci Levels & Trends Data 2013.11.11

2013.11.11 | EURUSD Market Analysis

EURUSD Trends & Fibonacci Retracement Levels

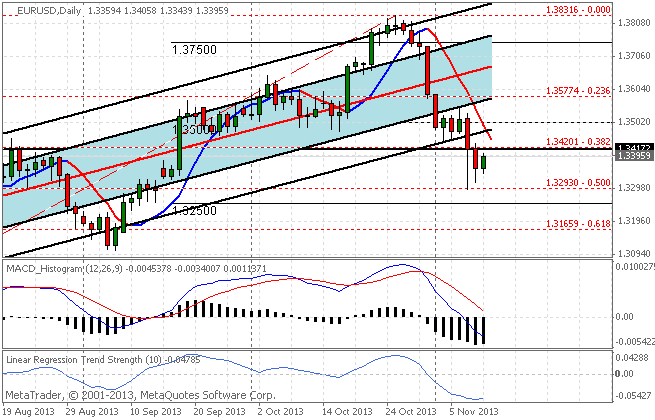
The EURUSD currency pair has been rising in forex market trading today with the EURUSD registering a high of 1.34058 and a low of 1.33439 on the day. The EURUSD had been on a 2 day losing streak after last week’s ECB rate cut and better-than-expected upbeat US economic data. Trends data shows the pair is currently in a short-term downtrend as prices are trading under our favored short-term moving average. Over the longer term trend, as seen on the chart by the 90-day Linear Regression Channels, the pair continues to be in an uptrend although prices have deviated to outside our channels which is seen as an extreme position compared to the trend.

Forex EURUSD


EURUSD Trends Data: Linear Regression Indicator

10-day current trend is BEARISH / Trend strength of -461.6 pips
30-day current trend is BEARISH / Trend strength of -42.1 pips
60-day current trend is BULLISH / Trend strength of 405.4 pips
90-day current trend is BULLISH / Trend strength of 590.0 pips
180-day current trend is BULLISH / Trend strength of 719.1 pips

Fibonacci Retracement Levels over last 100 Days

— 0.000 – 1.38316
— 0.236 – 1.35774
— 0.382 – 1.34201
— 0.500 – 1.32930
— 0.618 – 1.31659
— 0.764 – 1.30086
— 1.000 – 1.27544


By CountingPips.comForex Trading Apps & Currency Trade Tools


Disclaimer: Foreign Currency trading and trading on margin carries a high level of risk and volatility and can result in loss of part or all of your investment. All information and opinions contained do not constitute investment advice and accuracy of prices, charts, calculations cannot be guaranteed.
 

USDJPY Forex Trading Pivot Point Levels for 2013.11.11

2013.11.11 14:00 7:00AM ET | USDJPY Currency Pair

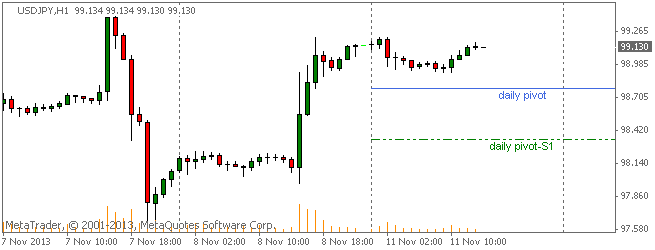
Here are the current Pivot Points Levels with Support (S) and Resistance (R) for the USDJPY currency pair. Price action is currently trading over the daily pivot point on Monday at the 99.130 price level, according to data at 7:00 AM ET. The pair opened the Asian trading session earlier today above the daily pivot and, despite an early morning decline, has remained above the pivot and above 99.00 at time of writing.

SC USDJPY 2013.11.11

Daily Pivot Point: 98.778
— S1 – 98.342
— S2 – 97.535
— S3 – 97.099
— R1 – 99.585
— R2 – 100.021
— R3 – 100.828


Weekly Pivot Points: USDJPY

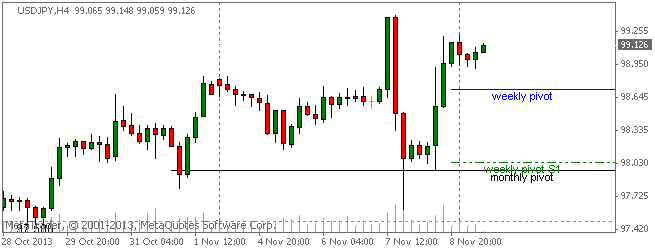
Prices are currently trading over the weekly pivot point to start the week after opening the trading week above both the weekly and monthly pivots.

SC USDJPY 2013.11.11

Weekly Pivot Point: 98.721
— S1 – 98.040
— S2 – 96.929
— S3 – 96.248
— R1 – 99.832
— R2 – 100.513
— R3 – 101.624


Monthly Pivot Point: 97.973
— S1 – 96.949
— S2 – 95.545
— S3 – 94.521
— R1 – 99.377
— R2 – 100.401
— R3 – 101.805


By CountingPips.com – Forex Trading Apps & Currency Trade Tools


Disclaimer: Foreign Currency trading and trading on margin carries a high level of risk and volatility and can result in loss of part or all of your investment. All information and opinions contained do not constitute investment advice and accuracy of prices, charts, calculations cannot be guaranteed.
 

EURUSD Forex Trading Pivot Point Levels for 2013.11.11

2013.11.11 14:00 7:00AM ET | EURUSD Currency Pair

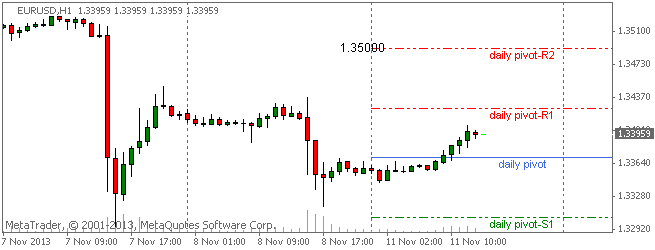
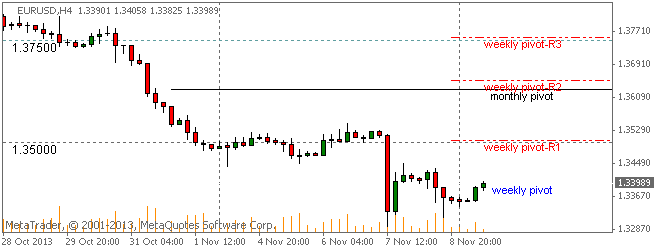
Here are the current Pivot Points Levels with Support (S) and Resistance (R) for the EURUSD currency pair. Price action is currently trading above the daily pivot point to start the trading week at the 1.33959 price level, according to data at 7:00 AM ET. The pair opened the Asian trading session earlier today below the daily pivot and has traded higher over the course of the day to just about the 1.3400 level.

SC EURUSD 2013.11.11

Daily Pivot Point: 1.33709
— S1 – 1.33049
— S2 – 1.32510
— S3 – 1.31850
— R1 – 1.34248
— R2 – 1.34908
— R3 – 1.35447


Weekly Pivot Points: EURUSD

Prices are currently trading right on top of the weekly pivot point to start the week after opening the trading week below the weekly and monthly pivot points.

SC EURUSD 2013.11.11

Weekly Pivot Point: 1.34001
— S1 – 1.32535
— S2 – 1.31482
— S3 – 1.30016
— R1 – 1.35054
— R2 – 1.36520
— R3 – 1.37573


Monthly Pivot Point: 1.36305
— S1 – 1.34295
— S2 – 1.32711
— S3 – 1.30701
— R1 – 1.37889
— R2 – 1.39899
— R3 – 1.41483


By CountingPips.comForex Trading Apps & Currency Trade Tools


Disclaimer: Foreign Currency trading and trading on margin carries a high level of risk and volatility and can result in loss of part or all of your investment. All information and opinions contained do not constitute investment advice and accuracy of prices, charts, calculations cannot be guaranteed.
 

USDCHF Forex Trading Pivot Point Levels for 2013.11.11

2013.11.11 14:00 7:00AM ET | USDCHF Currency Pair

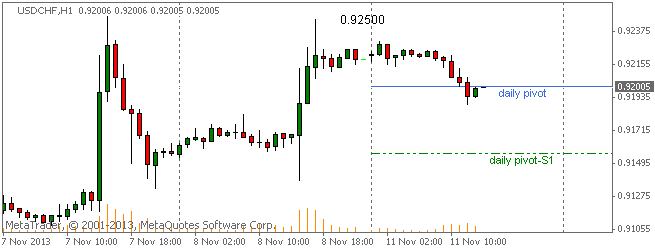
Here are the current Pivot Points Levels with Support (S) and Resistance (R) for the USDCHF currency pair. Price action is currently trading at the daily pivot point at the 0.92005 price level, according to data at 7:00 AM ET. The pair opened the Asian trading session earlier today above the daily pivot and has traded lower over the course of the day coming back to the pivot point.

SC USDCHF 2013.11.11

Daily Pivot Point: 0.92012
— S1 – 0.91565
— S2 – 0.90939
— S3 – 0.90492
— R1 – 0.92638
— R2 – 0.93085
— R3 – 0.93711


Weekly Pivot Points: USDCHF

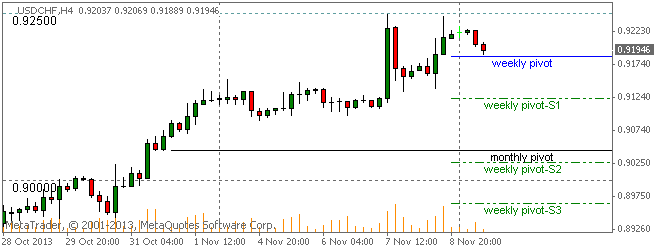
Prices are currently trading slightly over the weekly pivot point to start the week after opening the trading week above  both the weekly and monthly pivots.

SC USDCHF 2013.11.11

Weekly Pivot Point: 0.91860
— S1 – 0.91233
— S2 – 0.90273
— S3 – 0.89646
— R1 – 0.92820
— R2 – 0.93447
— R3 – 0.94407


Monthly Pivot Point: 0.90441
— S1 – 0.89112
— S2 – 0.87563
— S3 – 0.86234
— R1 – 0.91990
— R2 – 0.93319
— R3 – 0.94868


By CountingPips.comForex Trading Apps & Currency Trade Tools


Disclaimer: Foreign Currency trading and trading on margin carries a high level of risk and volatility and can result in loss of part or all of your investment. All information and opinions contained do not constitute investment advice and accuracy of prices, charts, calculations cannot be guaranteed.