EURUSD Forex Trading Pivot Point Levels for 2013.10.28

2013.10.28 13:30 7:00AM ET | EURUSD Currency Pair

Here are the current Pivot Points Levels with Support (S) and Resistance (R) for the EURUSD currency pair. Price action is currently trading above the daily pivot point at the 1.38051 price level, according to data at 7:00 AM ET. The pair opened the Asian trading session earlier today higher than the daily pivot and has remained close to this level so far today.

SC EURUSD 2013.10.28

Daily Pivot Point: 1.38021
— S1 – 1.37726
— S2 – 1.37436
— S3 – 1.37141
— R1 – 1.38311
— R2 – 1.38606
— R3 – 1.38896


Weekly Pivot Points: EURUSD

Prices are currently trading over the weekly pivot point to begin the trading week after opening the trading week higher than the weekly pivot level.

SC EURUSD 2013.10.28

Weekly Pivot Point: 1.37612
— S1 – 1.36908
— S2 – 1.35800
— S3 – 1.35096
— R1 – 1.38720
— R2 – 1.39424
— R3 – 1.40532


Monthly Pivot Point: 1.33989
— S1 – 1.32298
— S2 – 1.29350
— S3 – 1.27659
— R1 – 1.36937
— R2 – 1.38628
— R3 – 1.41576


By CountingPips.com – Forex Trading Apps & Currency Trade Tools


Disclaimer: Foreign Currency trading and trading on margin carries a high level of risk and volatility and can result in loss of part or all of your investment. All information and opinions contained do not constitute investment advice and accuracy of prices, charts, calculations cannot be guaranteed.


USDJPY Forex Trading Pivot Point Levels for 2013.10.28

2013.10.28 13:30 7:00AM ET | USDJPY Currency Pair

Here are the current Pivot Points Levels with Support (S) and Resistance (R) for the USDJPY currency pair. Price action is currently trading over the daily pivot point 1st resistance level (R1) at the 97.629 price level, according to data at 7:00 AM ET. The pair gapped higher at the open of the Asian trading session earlier today above the daily pivot and has traded continued higher over the course of the day.

SC USDJPY 2013.10.28

Daily Pivot Point: 97.271
— S1 – 97.061
— S2 – 96.721
— S3 – 96.511
— R1 – 97.611
— R2 – 97.821
— R3 – 98.161


Weekly Pivot Points: USDJPY

Prices are currently trading modestly over the weekly pivot point to begin the trading week after opening the trading week below the weekly pivot.

SC USDJPY 2013.10.28

Weekly Pivot Point: 97.602
— S1 – 96.730
— S2 – 96.059
— S3 – 95.187
— R1 – 98.273
— R2 – 99.145
— R3 – 99.816


Monthly Pivot Point: 98.806
— S1 – 97.009
— S2 – 95.814
— S3 – 94.017
— R1 – 100.001
— R2 – 101.798
— R3 – 102.993


By CountingPips.comForex Trading Apps & Currency Trade Tools


Disclaimer: Foreign Currency trading and trading on margin carries a high level of risk and volatility and can result in loss of part or all of your investment. All information and opinions contained do not constitute investment advice and accuracy of prices, charts, calculations cannot be guaranteed.


Fundamental Outlook – The Upcoming Forex Events on the Schedule worth watching out for

By CountingPips.com

A large number of all economic events are on the schedule this week with interest rate decisions coming from many countries including the United States, India, Japan and New Zealand. The US interest rate decision on Wednesday will also include an announcement if any changes are made to the US stimulus program. Please see our list of important economic events below.

Monday has the leading index out of China, industrial production and manufacturing production data out of the United States as well as pending home sales United States.

Tuesday‘s economic releases include the Indian interest rate decision, German consumer confidence data, the latest retail sales data from the United States as well as the conference board consumer confidence survey from the US.

Wednesday is a very busy economic day with the Spanish GDP report, the German employment data report, United States consumer price index, the United States interest rate decision and announcement of any changes to the current QE program as well as the New Zealand interest rate decision.

Thursday reports include Japanese interest rate decision and monetary policy, the euro zone consumer price index and the GDP report out of Canada.

Friday data will include the manufacturing PMI out of China and the ISM manufacturing report from the United States.

Please see the week’s highlighted economic events below or the full economic calendar:


This Week’s Economic Highlights:

Monday, October 28

China — leading index
United States — industrial production
United States — manufacturing production
United States — pending home sales
United States — Dallas Fed manufacturing
Japan — household spending
Japan — retail trade
Australia — RBA governor speech

Tuesday, October 29

India — interest rate decision
euro zone — German consumer confidence
United States — producer price index
United States — retail sales
United States — consumer confidence

Wednesday, October 30

Australia — new home sales
Switzerland — leading indicator
Switzerland — consumption indicator
euro zone — Spanish GDP
euro zone — Germany employment data
euro zone — consumer confidence
United States — mortgage approvals
United States — ADP employment data
United States — consumer price index
euro zone — Germany consumer price index
United States — interest rate decision
United States — treasury purchases decision

New Zealand — interest rate decision

Thursday, October 31

Japan — interest rate decision
Japan — Bank of Japan policy

euro zone — consumer price index
Canada — GDP report
United States — weekly jobless claims
United States — Chicago purchasing manager

Friday, November 1

China — manufacturing PMI
China — HSBC PMI
Switzerland — purchasing managers index
United Kingdom — purchasing managers index
United States — markit PMI
United States — ISM manufacturing

Article by CountingPips.com – See our Forex Economic Calendar

Large Forex Speculators cut US Dollar bullish bets to 7-month low on Oct 1st

By CountingPips.com


Cots


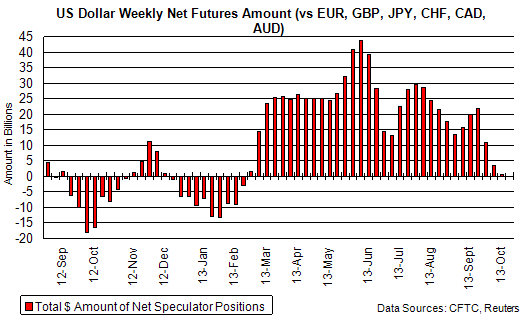
The weekly Commitments of Traders (COT) report, not published for close to a month due to the partial US government shutdown, was released on Friday by the Commodity Futures Trading Commission (CFTC) and showed that large futures traders & speculators continued to decrease their bullish bets of the US dollar for a third week in a row on October 1st.

Non-commercial large futures traders, including hedge funds and large International Monetary Market speculators, cut their overall US dollar long positions to a total of $692.8 million as of Tuesday October 1st. This was a decline of $-2.89 billion from the total long position of $3.58 billion that was registered on September 24th, according to data from Reuters that calculates this amount by the total of US dollar contracts against the combined contracts of the euro, British pound, Japanese yen, Australian dollar, Canadian dollar and the Swiss franc.

US dollar overall long positions, on October 1st, marked a new lowest level since February 12th when US dollar bets were bearish at a total of $-3.02 billion.

COT explanation: The weekly cot report summarizes the total trader positions for open contracts in the futures trading markets. The CFTC categorizes trader positions according to commercial hedgers (traders who use futures contracts for hedging as part of the business), non-commercials (large traders who speculate to realize trading profits) and non-reportable traders (usually small traders/speculators).

Individual Currencies Large Speculators Positions in Futures:

The large non-commercial net positions for each of the individual major currencies directly against the US dollar on October 1st showed weekly increases for the euro, British pound sterling, Japanese yen, Swiss franc, Canadian dollar, Australian dollar, Mexican peso and the New Zealand dollar.


Individual Currency Charts:


EuroFX:

EuroFx

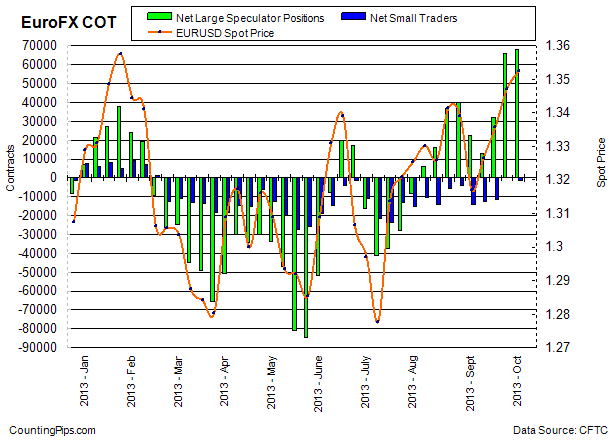
Last Six Weeks of Large Trader Positions: EuroFX

DateLarge Trader Net PositionsWeekly Change
08/27/2013400813335
09/03/201322738-17343
09/10/201312696-10042
09/17/20133190719211
09/24/20136584433937
10/01/2013682762432


British Pound Sterling:

gbp

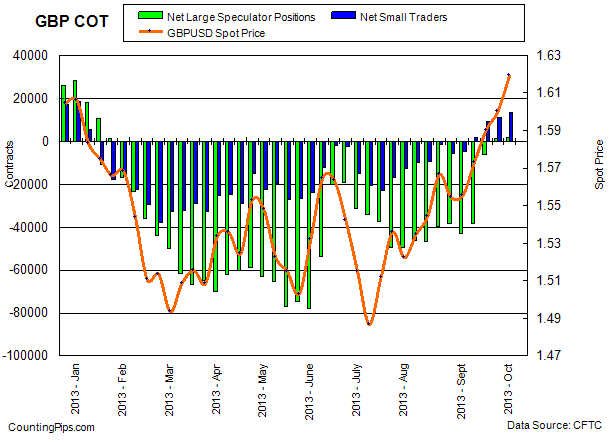
Last Six Weeks of Large Trader Positions: Pound Sterling

DateLg Trader NetWeekly Change
08/27/2013-382261296
09/03/2013-43046-4820
09/10/2013-381664880
09/17/2013-631031856
09/24/201311747484
10/01/20131496322


Japanese Yen:

jpy

Last Six Weeks of Large Trader Positions: Yen

DateLg Trader NetWeekly Change
08/27/2013-78353-6632
09/03/2013-79761-1408
09/10/2013-95066-15305
09/17/2013-887946272
09/24/2013-92818-4024
10/01/2013-8232410494


Swiss Franc:

chf

Last Six Weeks of Large Trader Positions: Franc

DateLg Trader NetWeekly Change
08/27/2013402111
09/03/20131059657
09/10/2013420-639
09/17/2013616196
09/24/201357455129
10/01/20136636891


Canadian Dollar:

cad

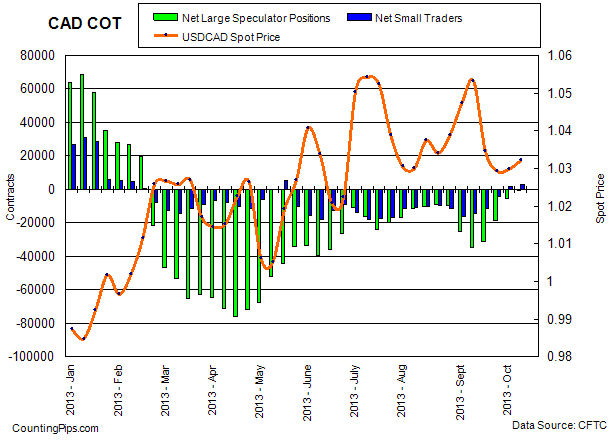
Last Six Weeks of Large Trader Positions: CAD

DateLg Trader NetWeekly Change
08/27/2013-24959-15415
09/03/2013-34639-9680
09/10/2013-309423697
09/17/2013-1876412178
09/24/2013-567513089
10/01/2013-9554720


Australian Dollar:

aud

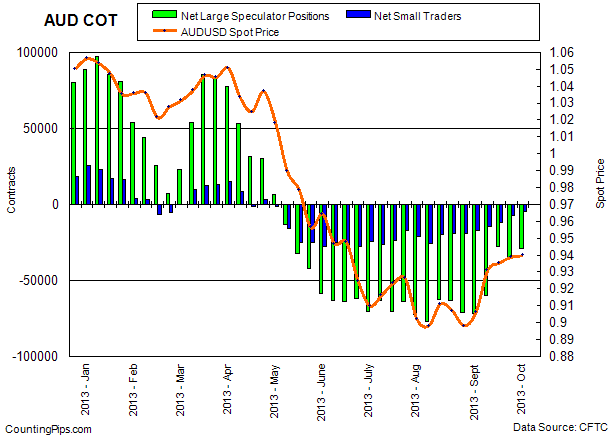
Last Six Weeks of Large Trader Positions: AUD

DateLg Trader NetWeekly Change
08/27/2013-71117-7934
09/03/2013-71506-389
09/10/2013-6003211474
09/17/2013-2736032672
09/24/2013-34819-7459
10/01/2013-288046015


New Zealand Dollar:

nzd

Last Six Weeks of Large Trader Positions: NZD

DateLg Trader NetWeekly Change
08/27/2013252-2138
09/03/2013-797-1049
09/10/2013-601196
09/17/201356576258
09/24/201380552398
10/01/2013108912836


Mexican Peso:

mxn

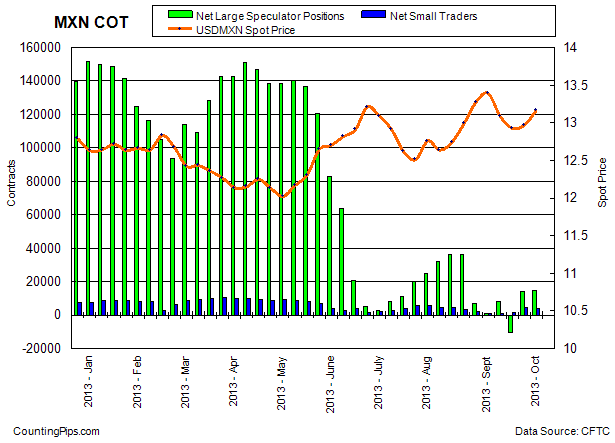
Last Six Weeks of Large Trader Positions: MXN

DateLg Trader NetWeekly Change
08/27/20137198-28933
09/03/2013688-6510
09/10/201382797591
09/17/2013-10201-18480
09/24/20131402324224
10/01/201314601578

The Commitment of Traders report is published every Friday by the Commodity Futures Trading Commission (CFTC) and shows futures positions data that was reported as of the previous Tuesday (3 days behind).

Each currency contract is a quote for that currency directly against the U.S. dollar, a net short amount of contracts means that more speculators are betting that currency to fall against the dollar and a net long position expect that currency to rise versus the dollar.

(The graphs overlay the forex spot closing price of each Tuesday when COT trader positions are reported for each corresponding spot currency pair.)

See more information and explanation on the weekly COT report from the CFTC website.


Article by CountingPips.com


US 10-Year Treasury Speculators decreased their bearish positions on Oct. 1st

By CountingPips.com

Weekly CFTC Net Speculator Report

10 Year Treasuries: Large trader and futures market speculators decreased their overall bearish positions for a third straight week on October 1st in the 10-year treasury notes. The 10-year treasury non-commercial contracts totaled a net position of -28,536 contracts in the data reported for October 1st, according to data from the Commodity Futures Trading Commission (CFTC). This was a change of +60,571 contracts from the previous week’s total of -89,107 net contracts that was registered on September 24th.

In the same time-frame, the yield on the 10 Year treasury note declined from 2.67 on Tuesday September 24th to 2.66 on Tuesday October 1st, according to US Treasury data.

*The COT data was not published by the CFTC for close to a month due to the partial government shutdown and the latest data is up to October 1st.


10Yr


Last 6 Weeks of Large Trader Positions

DateNet Large SpecsWeekly Change10 Year Yield
08/27/2013-110825-859852.72
09/03/2013-10309477312.86
09/10/2013-85324177702.96
09/17/2013-126026-407022.86
09/24/2013-89107369192.67
10/01/2013-28536605712.66


*COT Report: The weekly commitment of traders report summarizes the total trader positions for open contracts in the futures trading markets. The CFTC categorizes trader positions according to commercial hedgers (traders who use futures contracts for hedging as part of the business), non-commercials (large traders who speculate to realize trading profits) and nonreportable traders (usually small traders/speculators).


Article by CountingPips.comCurrency Trading News


VIDEO: Amazon’s Stock Soars On Q3 Revenue Beat

Amazon’s stock price was up more than 10 percent, to $366, since yesterday’s market close, thanks to Wall Street analyst price-target upgrades following the company’s third-quarter earnings report, which saw Amazon beat revenue expectations for the first time in a year and a half.

USDCHF Forex Trading Pivot Point Levels for 2013.10.25

2013.10.25 13:30 7:00AM ET | USDCHF Currency Pair

Here are the current Pivot Points Levels with Support (S) and Resistance (R) for the USDCHF currency pair. Price action is currently trading high over the daily pivot point at the 0.89412 price level, according to data at 7:00 AM ET. The pair opened the Asian trading session earlier today above the daily pivot, fell sharply lower near the S1 support level and has since returned higher through the pivot to the R1 resistance level.

SC USDCHF 2013.10.25

Daily Pivot Point: 0.89135
— S1 – 0.88981
— S2 – 0.88738
— S3 – 0.88584
— R1 – 0.89378
— R2 – 0.89532
— R3 – 0.89775


Weekly Pivot Points: USDCHF

Prices are currently trading under the weekly pivot point in the last trading day of the week. The USDCHF has been on a bearish pace basically from the go this week after opening the trading week below the weekly pivot. Prices currently reside between the S1 and S2 support levels.

SC USDCHF 2013.10.25

Weekly Pivot Point: 0.90655
— S1 – 0.89540
— S2 – 0.88919
— S3 – 0.87804
— R1 – 0.91276
— R2 – 0.92391
— R3 – 0.93012


Monthly Pivot Point: 0.91742
— S1 – 0.88938
— S2 – 0.87397
— S3 – 0.84593
— R1 – 0.93283
— R2 – 0.96087
— R3 – 0.97628


By CountingPips.com – Currency Trading Apps &  Trade Tools


Disclaimer: Foreign Currency trading and trading on margin carries a high level of risk and volatility and can result in loss of part or all of your investment. All information and opinions contained do not constitute investment advice and accuracy of prices, charts, calculations cannot be guaranteed.


EURUSD Forex Trading Pivot Point Levels for 2013.10.25

2013.10.25 14:00 7:00AM ET | EURUSD Currency Pair

Here are the current Pivot Points Levels with Support (S) and Resistance (R) for the EURUSD currency pair. Price action is currently trading slightly over the daily pivot point at the 1.37992 price level, according to data at 7:00 AM ET. The pair opened the Asian trading session earlier today just above the daily pivot and jumped higher to the R1 resistance level before falling back to the pivot as the day progressed.

SC EURUSD 2013.10.25

Daily Pivot Point: 1.37963
— S1 – 1.37682
— S2 – 1.37358
— S3 – 1.37077
— R1 – 1.38287
— R2 – 1.38568
— R3 – 1.38892


Weekly Pivot Points: EURUSD

Prices are currently trading well over the weekly pivot point on Friday and have extended above the R1 resistance level near the 1.3800 major level. The EURUSD has been on a bullish pace this week after opening the trading week above the weekly pivot.

SC EURUSD 2013.10.25

Weekly Pivot Point: 1.36205
— S1 – 1.35376
— S2 – 1.33894
— S3 – 1.33065
— R1 – 1.37687
— R2 – 1.38516
— R3 – 1.39998


Monthly Pivot Point: 1.33989
— S1 – 1.32298
— S2 – 1.29350
— S3 – 1.27659
— R1 – 1.36937
— R2 – 1.38628
— R3 – 1.41576


By CountingPips.comForex Trading Apps & Currency Trade Tools


Disclaimer: Foreign Currency trading and trading on margin carries a high level of risk and volatility and can result in loss of part or all of your investment. All information and opinions contained do not constitute investment advice and accuracy of prices, charts, calculations cannot be guaranteed.