Australian New Home Sales Down 8.7%

printprofile

An economic report from the Australian Housing Industry Association (HIA) remarked this morning that the sale of newly constructed homes declined in June by 8.7%, month-on-month. The previous month’s contraction by 0.2% had spooked investors only mildly last month, but today’s reading has many pulling away from the Australian dollar (AUD) in larger numbers.

Housing data worldwide has been showing positive figures. Japan, Britain and the United States all posted significant growth in their respective housing sectors. The slump in Australian housing is bewildering to many who had anticipated a return to growth globally in the housing sector of industrialized nations.

Read more forex trading news on our forex blog.

Is the Gold Rally Over?

debt ceilingAfter all the hype and hysteria, it looks like our politicians have finally worked out a deal… Not that they didn’t love every minute in front of the cameras.

Late Sunday evening, President Obama announced that leaders of both parties have reached an agreement to raise the debt ceiling.

You see, politicians jumped on this debt crisis like a hungry lion. For both sides, this is still an epic campaign battle. It’s a win-win for everyone, no matter what happens. That means politicians will milk this debt crisis for months to come.

And that’s not good for the country, no matter what side of the aisle you stand on.

The House is expected to vote on the bill sometime today.

Now, we don’t normally talk politics… but when politics directly affect the safety of your money, it’s time to take action.

As we come to a close with this debt ceiling farce, let’s see what the government’s compromise could do to your portfolio.

This agreement shouldn’t be a big surprise to anyone.

In a nutshell, this is what the agreement looks like:

  • Raise debt ceiling by $400 billion immediately, $900 billion more subject to vote
  • Cut spending by $1 trillion
  • Cut $1.5 trillion from long-term debt by 2021

What’s ironic about these points is that they are so vague and, to be blunt, wimpy. Both the Democrats and the Republicans pushed for higher spending cuts in their individual bills. We will know more details today, but at the time of this writing, everything was a bit hazy.

The one thing we do know is that this is only a Band-Aid. It’s an extremely short-term solution.

(Don’t forget to sign up for Smart Investing Daily and let me and fellow editor Jared Levy simplify the market for you with our easy-to-understand articles.)

Let’s talk about that $1.5 trillion in cuts… They’re not really cuts… They are just more headroom in the debt ceiling. The New York Times puts it:

A second [debt ceiling] increase of $1.2 trillion to $1.5 trillion would be available subject to a second vote of disapproval by Congress. At the same time, a new joint Congressional committee would be created to find a like amount of cuts.

Wimpy, wimpy, wimpy…

The CEO of Pacific Investment Management Co., the world’s largest bond fund manager, said that this deal will only provide short-term relief. The rating agencies will probably agree. Standard & Poor’s will downgrade our credit rating anyway. The rating agencies were looking for $4 trillion in cuts. A paltry $2.5 trillion — especially when $1.5 trillion aren’t even cuts — isn’t good enough.

But the market will receive this news of a deal very well.

That means traditional safe havens will take a hit. Gold and other precious metals will see a drop.

Gold was in for a technical correction anyway. Take a look at this chart.

Gold Chart
View Larger Chart

Consider any weakness in gold and precious metal prices as a bullish correction. This means that prices are pulling back, but we think the overall trend of prices will keep rising.

Insiders know this debt ceiling deal is only a short-term fix. The pullback in gold prices is only for the short-term, too.

Price could dip all the way back to $1,550. If you’re holding on to slim gains in a gold investment, you might want to unload and take those profits. That $1,550 could be a point of major support, and I would consider a correction down to that level a good time to buy.

Remember, the fundamental problems in our economy and our budget have not been fixed, and this half-assed, last-minute deal government leaders just cooked up won’t do anything to change the economy either. That means our dollar is still under pressure, and commodity prices will continue to climb.

Publisher’s Note: Sara is right. The equities market surged on the news of a debt deal. The details of the plan are fantastic news for Taipan’s Michael Robinson.

Not only did his American Wealth Underground subscribers have the chance to double and even triple their money in recent weeks… Washington’s latest move gives them a chance to do it again. Follow the link to see how they will do it.

Article brought to you by Taipan Publishing Group. Additional valuable content can be syndicated via our News RSS feed. Republish without charge. Required: Author attribution, links back to original content or www.taipanpublishinggroup.com.

{loadposition sidarticles}

{jtagstpg} {authorstpg}

Other Related Sources:

  • Debt Ceiling Debacle Is Bullish for Gold
  • House GOP Unveils its Debt Plan
  • No Matter What… Buy Silver
  • Turning Stock Market Fear Into Money With Debt Crisis

     By Chris Vermeulen, thegoldandoilguy.com

    Over the past seven trading sessions we have seen stocks plummet in price because of the debt issues in the United States. I think a lot of individuals including myself thought that a bill would have been passed last week and with a plan underway money would flow back into stocks for a relief bounce at minimum. Instead, nothing was passed and that lead to strong selling into Friday’s close.

    The next couple weeks are going to be very interesting for stocks, bonds, currencies and commodities as traders and investors process this event as it unfolds.

    Let’s step back and take a quick technical look at the chart…

    SPY – SP500 Index ETF – 10 Minute Chart
    I call this chart my sentiment chart because I use three indicators to get a feel for what the masses are doing. The first indicator which is the green spikes on the price chart is my own custom indicator to measure panic selling in the stock market. Usually I look for strong selling days followed by an exhaustion gap lower within 1-3 days.

    As you can see below, the last panic selling spike took place on a large gap down only 2 days after we saw extreme panic selling which actually got stronger as the session grew older. This is a bullish sign in my opinion.

    Also if you look at the two other indicators at the bottom we can see the NYSE advance decline line trading down in an oversold zone. And the very bottom indicator is the put/call ratio showing everyone is trading puts and that means they are betting on lower prices.

    To sum this chart up quickly I can tell that traders are selling everything they own because they are scared, stocks have moved down to quickly and likely ready for a bounce and also that options traders are expecting lower prices. So if everyone is bearish and has already sold their positions it only makes sense that a bounce or rally should take place in the next few sessions.

    Percentage of Stocks Trading Above the 20 Moving Average
    This chart helps me get more of an intermediate trend analysis for if stocks are oversold or over bought. This chart tells us the percentage of stocks that are trading above their 20 day moving average.

    This is how I use the info:
    Example: If we are in a long term bull market which we currently are… then I look at buy during these oversold conditions. Once this chart reaches the 75%+ level I become more aggressive with my positions and actively manage them (Take partial profits, tighten stops).

    Example 2: During a major bear market you to the opposite (build short positions on the bounces to 75%+ level and then cover partial positions and tighten stops once stocks are oversold and ready for a dead cat bounce once below the 25% level.

    SPY Daily Chart
    This chart below allows us to get a longer term view of my panic selling indicator. As we all know the market moves in waves (fear and greed). So with the SP500 traded by individual’s from all around the world it generally takes 5-15 days for everyone to become fearful and or greedy and to take action with their investments. This can be seen from looking at how long it takes for the sellers unload their positions.
    If things play out in favor of what the charts are telling me we should have a nice bounce or rally just around the corner. Again this analysis is based strictly on technical analysis and not on economic data. Adding the economic/political data makes things very confusing and interesting to say the least and they do not always to hand-in-hand.

    Weekend Trading Conclusion:
    In short, this coming week the market has a big wild card on the table. Until we know what that is be very cautious with trading positions. Just now/tonight Obama said a deal was reached to end debt issue and urges both parties to do the right thing and support this deal over the next 2 days. This deal will raise the debt limit and will cut $2.5 trillion from the deficit over the next 10 years.

    We are seeing a 20 point jump in the SP500 futures from this news just moments ago so this just may be the bounce/rally I am looking for.

    Technically I feel higher prices should take place in stocks but we may have a couple volatile sessions with lower prices before a strong jump in price as this news is not set in stone just yet and we have a couple days before we know what the final decision is…

    Get my trading reports free each week here: http://www.thegoldandoilguy.com/trade-money-emotions.php

    Chris Vermeulen

    Debt Ceiling Compromise Provides Only Short Term Dollar Relief

    printprofile

    The relief rally the US dollar received was short lived following the compromise between Democrats and Republicans to increase the US debt ceiling. All of the majors are higher versus the USD with equity markets also posting solid gains. Given last week’s poor Q2 GDP report traders may be positioning for another round of quantitative easing from the Fed though the bar for additional easing remains high.

    Traders took only a short pause in their dollar selling while market players continue to move into the safe haven currencies as the threat of a US credit rating downgrade by S&P looms and European peripheral bond spreads remain elevated. The USD/CHF is within striking distance of Friday’s low and the yen has rebounded from this morning’s initial spike higher to 78 in the USD/JPY. The overnight high coincides with a 50% retracement of the downtrend that began on July 20th. While intervention in the forex market by the Japanese Ministry of Finance remains a possibility the most recent CFTC data of the International Money Market shows speculators have increased their long yen positions to a level last seen in March (see chart below), a signal that hints at a reversal in the value of the USD/JPY.

    Asian and European equities were higher following the compromise over the US debt ceiling and data from China. Chinese manufacturing PMI was better than expected at 50.7 on expectations of 50.2 but the indicator declined from its previous reading of 50.9. This hints at a slowdown in the Chinese economy but deflects the hard landing scenario some analysts are calling for.

    British manufacturing PMI came in below expectations at 49.1 on consensus forecasts of 51.1. A reading below the 50 boom/bust level suggests a contraction in economic growth. This is the fifth consecutive month the survey has failed to meet expectations. The continued drop in manufacturing PMI suggests today’s results are not a case of one off irregularities due to Japanese supply constraints but rather structural problems in the UK manufacturing sector. In the crosses sterling is trading on its lows for the day but cable has still managed to eke out gains versus. Appreciation in the GBP/USD should be contributed to fundamental dollar weakness rather than sterling strength. The pair has resistance at 1.6550 and support at 1.6260. EUR/GBP has resistance at 0.8870 from the falling trend line off of the July high. Support is located at 0.8700.

    Last Friday’s disappointing Q2 US GDP of 1.3% was well below expectations of 1.7% and suggests the US economy continues to struggle despite ultra-loose monetary policy. Cyclical unemployment also has drag with the unemployment rate standing at 9.2%. The next major update to the US economic picture comes on Friday with the non-farm payrolls report. Traders may be selling dollars in anticipation of QE3 but the bar for additional Fed action remains high. Despite the gains seen on Friday and today the EUR/USD has traded sideways over the past 10-weeks. EUR/USD resistance is found at 1.4440 followed by last week’s high at 1.4540 and 1.4580. A break here would likely shift the technical picture in favor of the euro. To the downside support comes in at 1.4320-40.

    JPY IMM

    Read more forex trading news on our forex blog.

    Forex: Currency Speculators raise bets for Japanese Yen against US Dollar. Euro, NZD, AUD, CAD positions increase

    By CountingPips.com

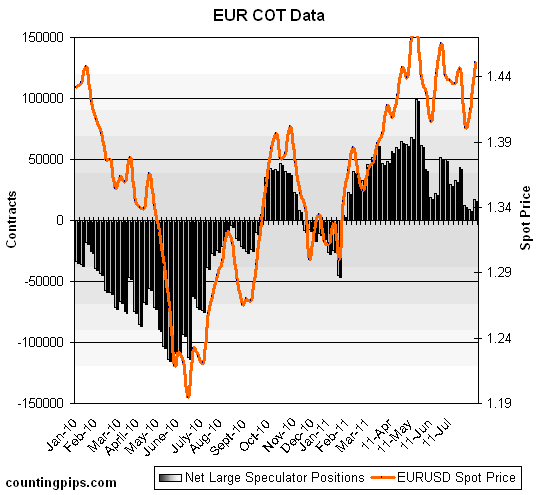
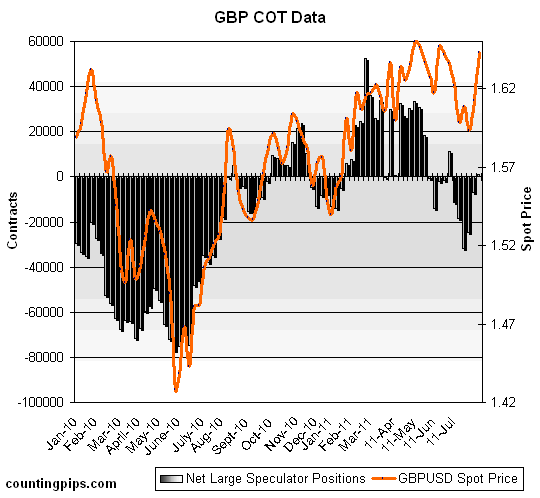
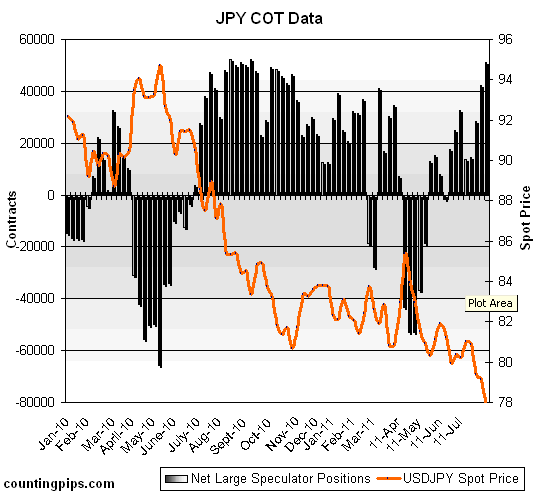
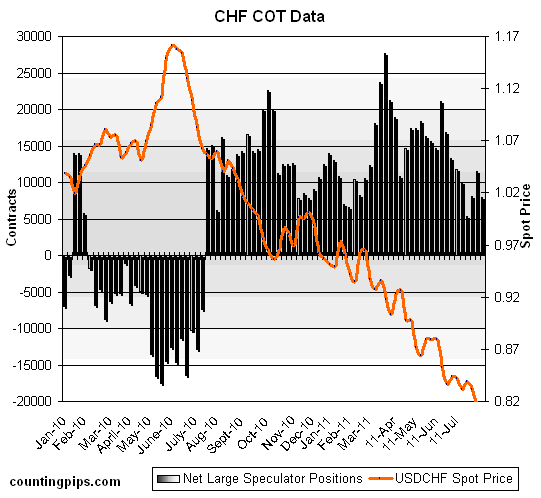
    The latest Commitments of Traders (COT) report, released on Friday by the Commodity Futures Trading Commission (CFTC), showed that large futures speculators added to their long positions of the euro against the US dollar while continuing to increase bets on the Japanese yen. Non-commercial futures positions, those taken by hedge funds and large speculators, added to their positions in favor of the euro, Japanese yen, British pound sterling, Australian dollar, Canadian dollar and the New Zealand dollar directly against the US dollar while decreasing their bets for the Swiss franc, according to data on July 26th.

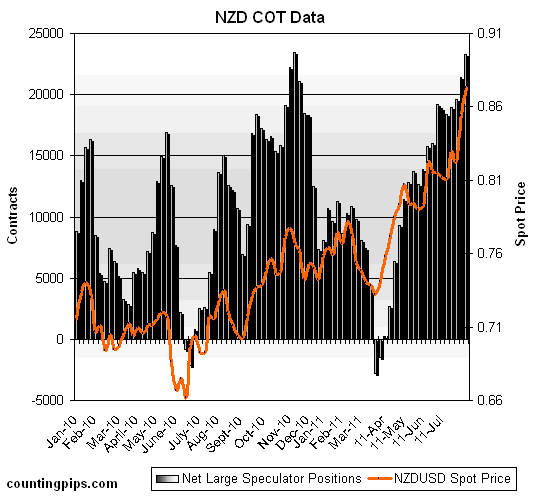
    This week’s notable changes were New Zealand dollar positions rising for a fourth straight week to the highest level since November while Japanese yen dollar positions also continued to rise and increased to their highest level since September 2010.

    EuroFX: Currency speculators increased their net long positions for the euro against the U.S. dollar reversing two straight weeks of declines. Euro positions rose as of July 26th to a total of 17,038 net long contracts from the previous week’s total of 9,246 contracts on July 19th. Euro positions on July 19th were at their lowest point since January 18th when net long contracts equaled 4,109.


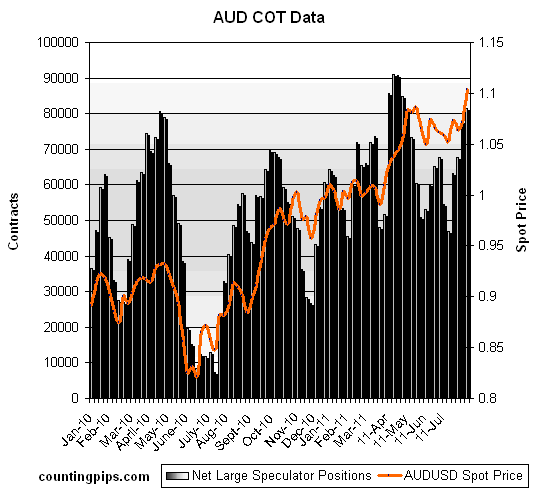
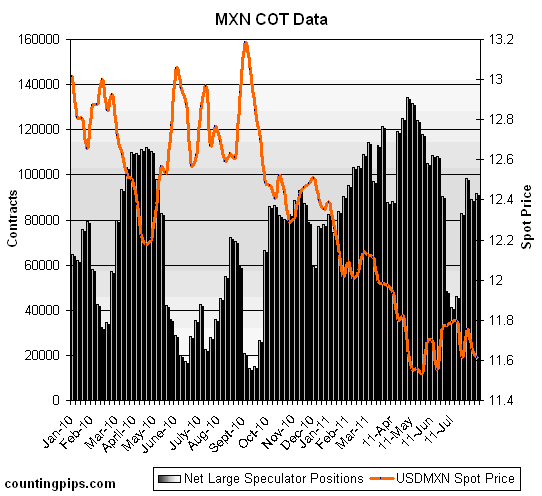
    The COT report is published every Friday by the Commodity Futures Trading Commission (CFTC) and shows futures positions as of the previous Tuesday. It can be a useful tool for traders to gauge investor sentiment and to look for potential changes in the direction of a currency or commodity. Each currency contract is a quote for that currency directly against the U.S. dollar, where as a net short amount of contracts means that more speculators are betting that currency to fall against the dollar and net long position expect that currency to rise versus the dollar. The graphs overlay the forex spot closing price of each Tuesday when COT trader positions are reported for each corresponding spot currency pair.

    GBP: British pound sterling positions increased higher for a third consecutive week after touching the lowest level in over a year on July 5th. British pound contracts rose over to the long side to a net long total of 1,222 contracts on July 26th following a net short position of 6,714 contracts reported on July 19th.

    JPY: The Japanese yen net contracts advanced for the fourth consecutive week as yen positions rose to the highest position since September 2010 when long contracts numbered 52,183. Yen net long positions increased to a total of 51,302 net long contracts reported on July 26th following a total of 42,155 net long contracts reported on July 19th.

    CHF: Swiss franc long positions decreased lower after rising for two consecutive weeks. Franc positions fell to a total of 7,877 net long contracts as of July 26th following a net of 11,494 long contracts on July 19th.

    CAD: The Canadian dollar positions rose higher for a fourth consecutive week to a total of 36,141 contracts as of July 26th. CAD net contracts had risen to a total of 27,764 net long contracts on July 19th as CAD positions continue to rebound after decreasing over to a net short total position on June 11th.

    AUD: The Australian dollar long positions advanced for the fourth straight week to a total net amount of 81,438 long contracts as of July 26th. AUD positions had totaled 77,795 net long contracts on July 19th and now sit at the highest level since April 26th when net long positions were 80,867.

    NZD: New Zealand dollar futures positions continued to rise higher for a fourth consecutive week and leveled at the highest level since November 2010 when positions reached 23,445 net long contracts . Last week, NZD contracts increased to a total of 23,291 net long positions as of July 26th from a total of 21,438 long contracts on July 19th.

    MXN: Mexican peso long contracts edged higher last week after a dip lower the previous week. Peso positions rose to a total of 91,913 net long speculative positions as of July 26th following a total of 89,266 contracts on July 19th.

    COT Data Summary as of July 26, 2011
    Large Speculators Net Positions vs. the US Dollar

    EUR +17038
    GBP +1222
    JPY +51302
    CHF +7877
    CAD +36141
    AUD +81438
    NZD +23291
    MXN +91913


    Investors Appear Optimistic for a US Debt Deal Today

    By ForexYard

    Risk appetite and market volatility are likely to be slightly elevated today as investors gear up for the rollercoaster that lies ahead considering today is the last day before the deadline for lifting the US debt ceiling.

    Economic News

    USD – USD Edges Higher as Debt Talks Nearing End

    The US dollar (USD) was seen trading mildly bullish at the start of this week as traders anticipate a completion to the debt talks that many assume will end the debt ceiling debacle that has gripped the nation for the past few weeks. The dollar has been primarily gaining from such momentum due to the shift into safer assets, but woes regarding the inability of Congress to address the impending debt crisis have partially dragged on the USD in sporadic bursts.

    Though news has been both positive and negative, traders have been predisposed to short the higher yielding assets in general as the US and European economies falter. As the August 2 deadline rapidly approaches, we are beginning to see some hedging behavior with the Swiss franc (CHF) and Japanese yen (JPY) acting as alternate stores of value should the US default on its loans. The USD/JPY in particular has fallen below intervention levels and now trades near 77.50.

    As for today, the US economy will be publishing an important manufacturing PMI reading at 15:00 GMT. Risk appetite and market volatility are likely to be slightly elevated today as investors gear up for the rollercoaster that lies ahead considering today is the last day before the deadline for lifting the US debt ceiling.

    EUR – EUR Mixed as Traders Await US Debt Ceiling News

    The euro (EUR) was seen trading with mixed results this morning following news of pessimistic growth in both the US and European economies, and heightened anticipation ahead of debt talks in the US. Against the US dollar (USD) the euro was trading somewhat bearish in late trading Friday as shifts into safe-haven investments pulled money away from the euro and into stores of value.

    Traders are looking for a way to balance a renewal of risk appetite with continued shakiness in global markets. A weakly optimistic sentiment towards investing in the US dollar at the moment, due to the debt limit talks taking place in Congress, has many investors on edge. A failure to lift the debt ceiling could result in a default by the US government, causing ratings agencies to downgrade US debt and pull the global economy in several directions, likely bearish across the board.

    Sentiment across the euro zone has also turned negative, with many analysts and economists expecting moves towards safety by traders this week. Any more bearishly-leaning news out of any major global economy will likely pull down on the EUR even further as investors flee risk, despite a moderate sentiment of optimism taking hold this morning.

    AUD – AUD Sees Uptick as Data Supports Growth

    The Australian dollar (AUD) was seen trading moderately higher versus most other currencies this morning after inflationary data last week caused a stir in Pacific markets. The Aussie has been experiencing several wide swings lately from the various shifts into and away from riskier assets. Traders witnessed a turn towards safety after last Friday’s economic reports, but sentiment appears mixed as of this morning.

    The latest moves have helped to lift the AUD as traders turned to its high interest rates in order to seek profits in higher yielding assets like the AUD, NZD and Scandinavian currencies. The producer price index (PPI) published last week beat forecasts, but so far has pushed down on the Aussie as traders had priced in positive growth ahead of time. The renewal of risk appetite could explain part of this recent uptick, but it doesn’t appear that it will last through the day.

    Gold – Gold Price Increasing Monday Morning

    The price of Gold found solid support over the past week despite the rising strength of the US dollar, the currency in which such assets are valued. Precious metals bear their name as a result of their traditional store of value in times of uncertainty. Gold has been trading with rather mild price action since June, but traders have been awaiting price resurgence due to the rampant increase in risk aversion due to rising tensions from Greece and faltering debt talks out of the US.

    As investors seek safety, the value of gold, which has been seen trading with mixed results, jumped to an all-time high of $1633.65 per troy ounce. A sudden jump in dollar values due to this week’s risk averse environment has so far done little to suppress this price movement as gold serves as a traditional store of value. Should risk sentiment hold steady this week, the prices for this precious metal may continue to find support as the week moves ahead.

    Technical News

    EUR/USD

    The weekly chart shows a bullish engulfing pattern was followed by a false breakout above the trend line falling off of the May and July highs. A pullback from this resistance line formed a doji reversal candlestick which hints at declines in the EUR/USD. The 200-week moving average looks to be the first support at 1.4025 followed by the 200-day moving average at 1.3930. The rising trend line from the May low could also be supportive at 1.3830. To the upside 1.4580 will need to hold to maintain the bearish technical picture. A close above this level could go on to test 1.4700 and this year’s high of 1.4940.

    GBP/USD

    Three weeks of consistent gains for cable are beginning to shift the technical picture from bearish to bullish. Sterling has moved above resistance levels that otherwise would have contained the pair. The first break occurred above the neckline of the head and shoulders pattern at 1.6185 and the second major break occurred at 1.6370 above the previous trend line rising from the May 2010 low. Initial resistance will be the May 31st high at 1.6550 followed by the April high at 1.6745. A move lower for the GBP/USD will likely test the base at 1.6260 followed by the previously broken trend line off of the April high at 1.6140. A breach of 1.6000 could have scope towards 1.5780.

    USD/JPY

    Yen strength has returned with a vengeance. Last week’s candlestick closed with a shaved bottom indicating momentum is to the downside. This week’s opening gapped higher but the price managed to hold below the current short term trend line from the July 20th high which comes in at 78.05. Additional resistance may be 79.60 and the 55-day moving average at 80.15 but the downside is calling. Support is found at 76.70 from last week’s low followed by the all-time low from March at 76.11. A break here and we move into uncharted territory where the psychological support at 75.00 and 70.00 come into play.

    USD/CHF

    The Swiss franc is in a similar position as the yen as the USD/CHF moves into uncharted territory. Bias remains to be short but Monday’s opening gap higher could create a Harami reversal pattern which may lead slight gains for the pair. A daily close will be needed for confirmation. Resistance is found at 0.8080 and 0.8275. A move higher to these levels would provide for potential short entries back into the long term downtrend with targets at the big round number at 0.7800.

    The Wild Card

    USD/CAD

    The pair moved higher on Friday only to run into resistance at the falling trend line from the June and July highs. Today the resistance comes in at 0.9600. This may provide forex traders with a resistance level to jump back into the long term downward trend.

    Forex Market Analysis provided by ForexYard.

    © 2006 by FxYard Ltd

    Disclaimer: Trading Foreign Exchange carries a high level of risk and may not be suitable for all investors. There is a possibility that you could sustain a loss of all of your investment and therefore you should not invest money that you cannot afford to lose. You should be aware of all the risks associated with Foreign Exchange trading.

    Weekly Technical FX Preview – GBP/USD Shifting from Bearish to Bullish

    printprofile

    EUR/USD

    The weekly chart shows a bullish engulfing pattern was followed by a false breakout above the trend line falling off of the May and July highs. A pullback from this resistance line formed a doji reversal candlestick which hints at declines in the EUR/USD. The 200-week moving average looks to be the first support at 1.4025 followed by the 200-day moving average at 1.3930. The rising trend line from the May low could also be supportive at 1.3830. To the upside 1.4580 will need to hold to maintain the bearish technical picture. A close above this level could go on to test 1.4700 and this year’s high of 1.4940.

    EURUSD_Weekly

    GBP/USD

    Three weeks of consistent gains for cable are beginning to shift the technical picture from bearish to bullish. Sterling has moved above resistance levels that otherwise would have contained the pair. The first break occurred above the neckline of the head and shoulders pattern at 1.6185 and the second major break occurred at 1.6370 above the previous trend line rising from the May 2010 low. Initial resistance will be the May 31st high at 1.6550 followed by the April high at 1.6745. A move lower for the GBP/USD will likely test the base at 1.6260 followed by the previously broken trend line off of the April high at 1.6140. A breach of 1.6000 could have scope towards 1.5780.

    GBPUSD_Daily

    USD/JPY

    Yen strength has returned with a vengeance. Last week’s candlestick closed with a shaved bottom indicating momentum is to the downside. This week’s opening gapped higher but the price managed to hold below the current short term trend line from the July 20th high which comes in at 78.05. Additional resistance may be 79.60 and the 55-day moving average at 80.15 but the downside is calling. Support is found at 76.70 from last week’s low followed by the all-time low from March at 76.11. A break here and we move into uncharted territory where the psychological support at 75.00 and 70.00 come into play.

    USDJPY_Daily

    USD/CHF

    The Swiss franc is in a similar position as the yen as the USD/CHF moves into uncharted territory. Bias remains to be short but Monday’s opening gap higher could create a Harami reversal pattern which may lead slight gains for the pair. A daily close will be needed for confirmation. Resistance is found at 0.8080 and 0.8275. A move higher to these levels would provide for potential short entries back into the long term downtrend with targets at the big round number at 0.7800.

    USDCHF_Daily

    Read more forex trading news on our forex blog.