My GOLD Technical Trading Analysis: What the Market is telling us

By Adam Hewison – Despite all the turmoil in Egypt and the Arab world, gold has stubbornly refused to rally. This probably causes great concern amongst the gold bugs and the folks who are bullish on gold.

As we have mentioned before many times on this blog, “perception is more powerful than fundamentals.”

While the gold bugs argue that the market is being manipulated, I am more of a realist and respect what the market is actually doing. The big question on everyone’s mind is: Why are food prices and other commodity markets soaring, while gold is dismally staying down in the $1,330 area?

MarketClub’s Trade Triangles are all Red, meaning that the trend for gold is likely to remain negative or at best move in a sideways fashion.

My best estimation at this point in time is that we are going to see more sideways action and probably some recovery from current levels. However, I would like to see some concrete evidence that the market has actually put in a low and that we will see a recovery in this yellow metal in the future.

One thing I can say, historically our monthly RED Trade Triangles have not been successful in gold. You would have been more successful fading the RED monthly Trade Triangle signal and going long gold.

Before getting, “gung ho” on this approach, you will be better off waiting for a green weekly trade triangle to kick in which would indicate that the market has probably made a low.

That is the main reason why, we recommend using the weekly Trade Triangles for trend, and daily Trade Triangle’s for timing.

In this short video, I explained what I mean and show you concrete examples of how you can use this strategy to make money.

As always our videos are free to watch and there is no registration requirements. Our only request is that you tell your friends, Tweet and Facebook about this blog posting. We would also enjoy hearing from you, so please feel free to comment on this blog about this video.


Enjoy,
All the best,
Adam Hewison
President of INO.com and co-founder of MarketClub

To see more of Adam’s videos click here or sign up for Adam’s Free 10-part Professional Trading Course.

Technical Tip – GBP/USD Breakout

By Russell Glaser

The GBP/USD appears set to end its 5-month period of sideways trading as the pair is currently testing the upper boundary of a consolidation pattern.

A surprisingly strong January has helped the Cable come off of its December lows and the pair is now testing a trend line that falls off of the August 2009 high. The trend line comes in this week at 1.6160.

Should the GBP/USD breach this trend line, the path higher is littered with resistance levels. The first target would be the October 20010 high at 1.6300, followed by the January 2010 high at 1.6460. This price level should have added significance as it coincides with the falling trend line of the 2007 high. Further resistance is found at the November 2009 high of 1.6880, followed by the August 2009 high of 1.7040.

If the long term trend line holds and the GBP/USD will move lower, support is located at the previous week’s low of 1.5750, followed by the rising trend line off of the May lows which comes in this week at 1.5520. Further support may be found at the December 2010 low of 1.5340.

While it may not be relevant at this time, a distinct head and shoulders pattern is identifiable with the neck line below the September and December lows of 2010. A move above the 1.6300 level would nullify this reversal pattern.

GBPUSD_Weekly

Forex Market Analysis provided by ForexYard.

© 2006 by FxYard Ltd

Disclaimer: Trading Foreign Exchange carries a high level of risk and may not be suitable for all investors. There is a possibility that you could sustain a loss of all of your investment and therefore you should not invest money that you cannot afford to lose. You should be aware of all the risks associated with Foreign Exchange trading.

It’s About Time That Filinvest Land (FLI)es!

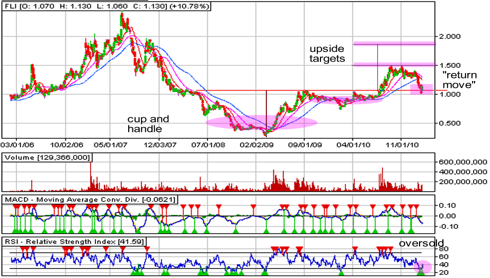
Filinvest Land, Inc. or FLI in the Philippine Stock Exchange did not get the award for the most outstanding stock in 2010. Despite this, it was still able to book some descent amount of gains. In fact, it rose by 45.56% when it opened at PHP 0.90 in January 2010 and closed at PHP 1.31 at the end of the year. Not bad if you ask me. Looking at its chart above, FLI was actually trading sideways during the first half 7 months of the year before it swung higher to break out from a cup and handle formation in August. And in a little more than a month following the breakout, it was able to mark a high at PHP 1.50. However, luck appeared to reverse when it gradually fell to a low of 1.060 yesterday.

Some people were actually asking me if FLI was a good buy at yesterday’s levels. My answer was it was not since it already fell and closed below the former neckline of the previous cup and handle which was supposed to act as a support. I mentioned that it first needed to move its head above the neckline in the next few days for me justify a technical buy on the issue. And guess what, the stock proved to be resilient as it was able to move back above the neckline. Yesterday’s gain of 10.78% or so was a missed opportunity, I know. But in my opinion, it’s always better to play things if the probabilities are on your side. Yesterday, the stock had a higher probability of losing than winning given the technical reason that I mentioned above, notwithstanding the uncertainties surrounding Egypt. And now that the support has held, I could say that it could once again revisit its former high at PHP 1.50 or its upside target of PHP 1.85.

On the fundamental side, the company earlier disclosed its plans to launch new real-estate projects this year that are worth about PHP 13 billion. It said that is is aiming to sell around 14,000 residential units this 2011, almost twice of the 7,300 units last year. It also noted that its sales revenues for 2010 amounted to PHP 10 billion which was 42% better than in 2009. Borrowing costs (housing loans, etc.), is expected to somewhat remain subdued for the rest of the year. In fact, some commercial banks are even lower its interest rate at least for the first year to 5.88%, encouraging more people to purchase real properties. This environment of low interest rates plus the continuing pick up of the Philippine economy and of course the FLI’s plans for new projects could really play for the company.

More on LaidTrades.com

What To Watch, February 2nd, 2011

Wednesday, February 2nd will kick off earnings with AOL (AOL), Time Warner (TWX), Mattel(MAT), Whirlpool (WHR), Nasdaq OMX (NDAQ), and Hershey (HSY). Expect earnings releases from News Corp (NWSA), Hartford Financial Services (HIG), Visa(V), Vulcan Materials (VMC), Green Mountain Coffee Roasters (GMCR), Yum! Brands (YUM), and BMC Software (BMC) in the latter part of the day. ADP will announce its Employment Change report early on in the day at 8:15AM.

Forex Daily Market Commentary

By GCI Forex Research

Fundamental Outlook at 0800 GMT (EDT + 0400)

USD

The dollar failed to claw back any of its recent losses during the Asia session. EURUSD traded 1.3813-1.3862, and USDJPY 81.31-81.60. US equities closed up over 1% and Treasury yields pushed higher. The manufacturing ISM index rose much higher than expected to 60.8 in January versus consensus 58.0. The report included increases in the components most directly indicative of faster growth, with the employment index, the new orders index, and the production index all posting gains. All in all, the ISM report showed the trend in manufacturing output growth (and hiring) rising solidly at the beginning of 2011. The strength in the ISM index is consistent with our economists’ forecast for real GDP growth to pick up to a 4.2% annual rate in Q1 from 3.2% in Q4. But with labour data ahead, market participants do not appear to want to cheer the ongoing US recovery just yet. The ADP employment change does have a reasonable correlation to payrolls data. However, the last ADP print conflicted with the official non-farm payrolls release and wintry weather could add more volatility to the payrolls data this time around.
EUR

Manufacturing PMIs across the Eurozone were strong, with Germany, Italy and France all beating consensus. The EU composite indicator was equally positive, although there is substantial country divergence between the larger economies and the peripheral nations. But with the indicator near the 2006 high, a potential turning point may be at hand. The Eurozone unemployment rate fell for the first time since 2007, to 10.0%, in line with UBS estimates.
Spanish Economy Secretary Campa is confident that Eurozone leaders will reach a deal on improving the financial stability facility and said recent market calm does not remove the need for a more effective facility.
JPY

BoJ Board member Kamezaki said that rapid FX moves are undesirable, but that the yen’s appreciation has subsided somewhat from the sharp gains that have been seen in the past.
GBP

Manufacturing PMI in the UK rose to 62.0, the highest level since records began in 1992. Mortgage approvals fell in December, but this was largely due to the adverse weather conditions and sterling reacted positively to the PMI data primarily.
CHF

Swiss data was mixed with a disappointing retail sales number but a very strong PMI print. Retail sales fell in December by -0.4% y/y versus November’s reading of +2.5%. The PMI was 60.50 versus consensus at 59.2.
SNB Vice President Jordan did not comment on monetary policy but again said that the Swiss franc has massively appreciated and poses a risk to growth
AUD

Australia is bracing itself for the arrival of a category 5 cyclone today. Queensland Premier Bligh said it could be “catastrophic”.
CAD

BoC Senior Deputy Governor Macklem said a strong Canadian dollar could jeopardize the export recovery but at the same time said it would be a “risky business model” to assume the Canadian dollar would weaken.

Forex Daily Market Commentary provided by GCI Financial Ltd.

GCI Financial Ltd (”GCI”) is a regulated securities and commodities trading firm, specializing in online Foreign Exchange (”Forex”) brokerage. GCI executes billions of dollars per month in foreign exchange transactions alone. In addition to Forex, GCI is a primary market maker in Contracts for Difference (”CFDs”) on shares, indices and futures, and offers one of the fastest growing online CFD trading services. GCI has over 10,000 clients worldwide, including individual traders, institutions, and money managers. GCI provides an advanced, secure, and comprehensive online trading system. Client funds are insured and held in a separate customer account. In addition, GCI Financial Ltd maintains Net Capital in excess of minimum regulatory requirements.

DISCLAIMER: GCI’s Daily Market Commentary is provided for informational purposes only. The information contained in these reports is gathered from reputable news sources and is not intended to be U.S.ed as investment advice. GCI assumes no responsibility or liability from gains or losses incurred by the information herein contained.

FX Markets Eye U.S. ADP Non-Farm Employment Change

Source: ForexYard

Today, traders should pay close attention to the release of the U.S. ADP Non-Farm Employment Change report. This indicator always provides for extreme market volatility in the major currency pairs. Traders may find good opportunities to enter the market following this vital announcement at 13:15 GMT.

Economic News

USD – Dollar Falls against Majors after U.S. Manufacturing Data

The US dollar slid on Tuesday against other major currencies, hitting a three-month low against the euro, as surprisingly strong US manufacturing data encouraged risk-taking. In addition, the dollar, which saw a safe-haven bids late last week when protests in Egypt intensified, fell broadly as risk appetite returned, hitting a four-week low of 81.33 against the yen and falling 0.9% against the CHF to 0.9355.

The dollar has fallen every day this week against the EUR, Sterling Pound, and yen. Analysts attributed the fall in the dollar, which has been treated as a lower risk, safe-haven investment, to growing optimism that the worst of the financial crisis has passed, causing investors to unwind long dollar positions when fear was widespread, credit was frozen and stock markets were in a free fall.

Another leading indicator released yesterday was U.S Manufacturing PMI. This number handedly beat last month’s result but failed to provide strength to the dollar as investors may be waiting for key data due to be released today to implement their trading strategies.

Looking ahead today, the news event that may have a very large impact on the dollar and its main currency pairs in today’s trading is the ADP Non-Farm- Employment Change around 13:15 GMT. This report is very important as it will likely impact dollar volatility. Traders should pay close attention to the market as there is an opportunity to capitalize on the fluctuations which are likely to follow this release.

EUR – EUR Gains on Renewed Risk Appetite

The euro rose against the major currencies on Tuesday, supported by expectations of higher euro-zone interest rates and an increase in investor appetite for riskier assets. As a result, the euro rose as high as $1.3842, its highest since early November. The EUR experienced similar behavior against the GBP and closed at 0.8570.
Traders are increasingly convinced that rising inflation in the 17-nation currency bloc will soon force the hand of the European Central Bank as it seeks to curb price pressures. While no one expects the ECB to raise interest rates when it meets on Thursday, building inflationary pressures have led to speculation the central bank may need to raise borrowing costs sometime this year.

Currency levels are being increasingly determined by interest rate differentials. As a result, investors have been willing to purchase euros based on expected higher returns, even as they momentarily ignore Europe’s still-festering sovereign debt problems.

Easing fears Egypt’s political unrest would spread in the Middle East also helped boost the euro and higher-yielding currencies such as the Australian and New Zealand dollars.

JPY – Yen Mixed Against Major Currencies

The yen completed yesterday’s trading session with mixed results versus the other major currencies. The JPY was broadly unchanged versus the EUR yesterday and closed its trading session at around the 112.50 level. The JPY also saw bullishness against the USD as it jumped around 60 points and closed at 81.40.

The JPY’s trends will be affected by the rallies of its primary currency pairs today. It seems that the USD and EUR are expected to continue a volatile trading session today, especially against the Japanese currency. Traders should keep a close look on the news coming from the U.S. and Europe as these economies will be the deciding factors in the JPY’s movement today, especially the ADP Non- Farm Employment Change at 13:15 GMT. It is also advisable for traders to follow any unexpected comments coming from key Japanese governmental figures, as this is also likely to lead to further JPY volatility.

OIL – Crude Oil Inventories Data to Drive Oil Trading Today

Crude oil price slipped on Tuesday as fears over oil supply disruptions at the Suez Canal eased, but attention remained fixed on events in Egypt, where massive antigovernment protests continued for another day. Crude oil prices dropped to an intra-day low of $90.30 a barrel before rebounding to settle at 90.90,

Egypt isn’t a major oil supplier, but the Suez Canal and the nearby Sumed pipeline are key chokepoints for global oil supplies. In addition, fears persist that the antigovernment protests could spread to major oil producing countries elsewhere in the region.

As for today, traders should pay attention to the U.S. Crude Oil Inventories report scheduled, as it tends to have a large impact on crude oil’s prices recently, especially for the short-term.

Technical News

EUR/USD

The pair has recorded much bullish behavior in the past several days. However, the technical data indicates that this trend may reverse anytime soon. For example, the 4-hour chart’s Stochastic Slow signals that a bearish reversal is imminent. Going short with tight stops might be a wise choice.

GBP/USD

The price of this pair appears to be floating in the over-bought territory on the 4-hour chart’s RSI indicating a downward correction may be imminent. The downward direction on the 8-hour chart’s Momentum oscillator also supports this notion. When the downwards breach occurs, going short with tight stops appears to be preferable strategy.

USD/JPY

The USD/JPY cross has experienced a bearish trend for the past week. However, it seems that this trend may be coming to an end. The RSI of the 4-hour chart shows the pair floating in the oversold territory, indicating that an upward correction will happen anytime soon. Going long with tight stops might be a wise choice.

USD/CHF

The 8-hour chart is showing mixed signals with its Slow Stochastic fluctuating at the neutral territory. However, there is a fresh bullish cross forming on the 4-hour chart’s Slow Stochastic indicating a bullish correction might take place in the nearest future. Going long might be a wise choice.

The Wild Card

NZD/USD

This pair’s sustained upward movement has finally pushed its price into the over-bought territory on the 4-hour chart’s RSI. Not only that, but there actually appears to be a bearish cross on the Slow Stochastic pointing to an imminent downward correction. forex traders have the opportunity to wait for the downward breach on the hourlies and go short in order to ride out the impending wave.

Forex Market Analysis provided by ForexYard.

© 2006 by FxYard Ltd

Disclaimer: Trading Foreign Exchange carries a high level of risk and may not be suitable for all investors. There is a possibility that you could sustain a loss of all of your investment and therefore you should not invest money that you cannot afford to lose. You should be aware of all the risks associated with Foreign Exchange trading.

US dollar declines whereas the Euro Strengthens

The US dollar declined versus its major counterpart currencies on Tuesday where the Euro strengthened on the better than expected economic data by euro zone. Investors took fresh position on single currency perceiving it to be safe haven keeping in view the political and economic unrest in Egypt.

The dollar index DXY which measures the US dollar’s movement versus its six major rival currencies declined to 76.008 on Tuesday’ s North American trading session as compared to 77.777 on Monday

The Euro surged to 1.3835 against the greenback as compared to 1.3689 on late Monday. Investors were very optimistic about the single currency and took fresh positions on the euro zone’s increased PMI index for manufacturing sector depicting high factory activity in last nine months.

Moreover Germany also reported a decreased of 13,000 in its unemployment figure for the month of January.

Economist Andrew Grantham from HSBC commented, “The figures confirmed that growth remained robust in January and suggested that it is now more broadly-based.”

The US dollar experienced high selling pressure but later in session recovered on better than expected US manufacturing data.

The greenback also declined versus the British Pound as the pair GBP/USD surged to 1.6148 as compared to 1.6020 on Monday. Pound Sterling remained strong as the Britain’s manufacturing PMI reached its record high to 62.0 for the month of January.

The US dollar declined to 81.40 against the Japanese Yen as compared to 82.07 on Monday. The trading of Yen is highly reactive to US treasury rates which have increased after strong US manufacturing data on Tuesday.

About the Author

Daily forex trading news written by Rehan from DailyForexTrade.com

Trans-Asia Oil and Energy Development Corporation (TA) Awakes?

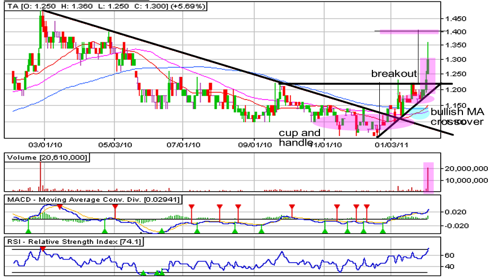
Trans-Asia Oil and Energy Development Corporation or TA in the Philippine Stock Exchange is a company that is involved in power generation, and oil and mineral exploration business. Like one of its partners in the drilling of several oil wells, Petroenergy Resources Corporation (PERC), TA looks to be on the verge of an upswing in the days to come as well at least from a technical point of view. As you can see from its day chart, TA has already escaped from its long term downtrend line. The other day (January 31, TA broke out from a cup and handle formation. This move was confirmed yesterday when its 5.69% gain was accompanied by a relatively large volume.

Yesterday’s breakout could swing TA towards its upside target of PHP 1.40 (gauged by projecting the height of the cup from the point of breakout). Another bullish indicator that suggests a possible move higher was a bullish crossover (highlighted in light blue) of the moving averages. Usually, when the red moving average crosses over the other two MAs signifies a switch in trend. On the down side, TA could likewise weaken because of its overbought condition. If it does, it could once again revisit its support around PHP 1.22.

More on LaidTrades.com

Stocks Look PERCy Enough!

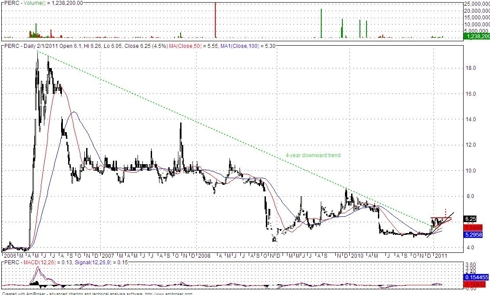
Petroenergy Resources Corporation or PERC as listed in the Philippine Stock Exchange provides specialized technical services to oil-exploring companies in the Philippines. Technical wise, the PERC stocks broke out from its 4-year downtrend last December 8 as seen in the image above.

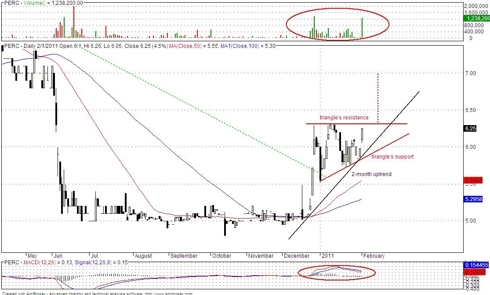
As we zoom closer, there could be a 1-month ascending triangle setting up as well, just right above the broken downtrend. A break above the triangle’s resistance could make way for the PHP 7.00 target price which I got by adding the size of the triangle’s base to the possible breakout point. At its current price, if it reaches the target, that could be an easy 12% gain! PERC, by the way, is moving above the 50 and 100-period moving averages, the MACD is above 0 and its volume traded daily has been more active recently. With these positive indicators in line along with the bullish looking chart pattern, the stocks could most likely be propelled upward. In case the stocks drop, the 2-month uptrend could be the immediate support. Then the next marker is the ascending triangle’s support.

On the side note, Petroenergy Resources Corporation is currently working on its geothermal produce in southern Luzon and is preparing to begin drilling at an oil well in San Isidro Leyte that covers 332,000 hectares over the East Visayas basin. Drilling is set to start on March 2011 with an estimated 12 million to 263 million oil barrels to be found on the site. Partners for the Leyte project include listed companies Alcorn Gold Resources Corporation (APM), Energy Development Corporation (EDC) and Trans-Asia Oil and Energy Development Corporation (TA). With oil prices soaring higher because of the political turmoil in Egypt, PERC would most likely benefit from it.

Just be careful with your trades since the Philippine Stock Exchange Index has broken down from its 2-year ascending channel and could continue to head lower until it finds some support (here’s my post when the channel was still intact).

More on LaidTrades.com

Crisis Panel Report Reveals Flaws in the U.S. Financial System

By Sara Nunnally, Editor, Smart Investing Daily, taipanpublishinggroup.com

Today, I have to rant… Over the weekend I read parts of a report from the Financial Crisis Inquiry Commission. After the global financial crisis, the U.S. government created the Financial Crisis Inquiry Commission to delve into the heart of what caused the crisis, and who might be to blame for it.

On Thursday of last week, the Commission released its report. It’s 633 pages long, and cites some 700 interviews and millions of e-mails. No wonder it took them so long… Even the Warren Commission and its 888-page report took less than a year to prepare.

The Commission was created on May 20, 2009, under the Fraud Enforcement and Recovery Act of 2009.

Along with the report released on Thursday, the Financial Crisis Inquiry Commission released 1,200 documents, with another thousand documents and interviews to be released before the Commission dissolves on Feb. 13.

It does more than just point fingers… It explains how a financial system nearly collapsed. And it cited actions from people on both Wall Street and in Washington.

From page xv of the Financial Crisis Inquiry Commission Report:

Some on Wall Street and in Washington with a stake in the status quo may be tempted to wipe from memory the events of this crisis, or to suggest that no one could have foreseen or prevented them. This report endeavors to expose the facts, identify responsibility, unravel myths, and help us understand how the crisis could have been avoided. It is an attempt to record history, not to rewrite it, nor allow it to be rewritten.

Indeed, the Commission was to be bipartisan, but the report was supported only by the six Democrats on the panel. The four Republicans actually offered two separate dissents.

At the heart of the disagreement is an age-old argument.

Deregulation. For simplicity’s sake, let’s make some generalizations. Republicans favor an environment with less regulation, while Democrats tend to favor more regulation.

Republicans argue that regulations can unnecessarily slow economic growth.

Democrats say deregulation creates an unstable economy with room for fraud and bubbles.

For example, the Glass-Steagall Act was first passed in 1933. This act limited the amount of investing a commercial bank could do, and it in effect separated — and kept separate — investment banks and bank-holding companies from the commercial banking industry.

This act was in response to the vast speculation that was behind the stock market crash in 1929. There was outright fraud, and conflicts of interest that were behind some banks’ activities.

The Glass-Steagall Act sought to make commercial banks and brokers or investment banks two different entities.

But it wasn’t long before certain banks began chipping away at the act — lobbying for increases in investing limits and deregulation that would allow them to acquire other banks.

Citigroup was one of the more prominent folks behind the push to repeal the act. It’s been suggested that Sanford Weill, CEO of the group from October 1998 to October 2003, spent $100 million lobbying to get the act repealed.

It worked. On Nov. 12, 1999, the provisions in the Glass-Steagall Act that prohibit a bank-holding company from acquiring other financial companies were repealed with the Gramm-Leach-Bliley Act, also known as the Financial Services Modernization Act of 1999.

Many folks believe this repeal was responsible for the buildup of risky assets and investments and contributed heavily to the global financial crisis.

Consider what Robert B. Ekelund and Mark Thornton have to say:

The Financial Services Modernization Act of 1999 would make perfect sense in a world regulated by a gold standard, 100% reserve banking, and no FDIC deposit insurance; but in the world as it is, this “deregulation” amounts to corporate welfare for financial institutions and a moral hazard that will make taxpayers pay dearly.

And boy, have we… In fact, we still are, as the Federal Reserve continues to buy billions of dollars’ worth of government debt each month.

(Investing doesn’t have to be complicated. Sign up for Smart Investing Daily and let me and my fellow editor Jared Levy simplify the stock market for you with our easy-to-understand investment articles.)

But let’s get back to the Commission’s report.

In a nutshell, the Commission blames “the collapse of the housing bubble — fueled by low interest rates, easy and available credit, scant regulation, and toxic mortgages” for the financial crisis. But there are a lot of players that contributed to each of those factors, so the blame can be widely spread between Wall Street and Washington, and those places in between, like the Federal Reserve.

Speaking of which, did you know that Fed Chairman Ben Bernanke has called the financial crisis “the worst financial crisis in global history, including the Great Depression”?

Maybe not. He didn’t say it publicly; he told the Commission behind closed doors on Nov. 17, 2009.

And yet, everyone — from financial institutions to the Federal Reserve to the government and its regulators — didn’t see this coming.

Up until the you-know-what hit the fan, everyone was saying that the housing bubble could be contained. Greenspan didn’t see it, Bernanke didn’t see it… But maybe one company did.

Goldman Sachs.

This company, one of the creators of collateralized debt obligations (CDOs) that bundled up subprime mortgages and labeled them as a AAA-rated investment, was actually betting against these securities.

They made a killing, too. In 2007, the company made $4 billion in profits from their subprime bets.

That’s my rant… The report highlights all of these greedy actions of money-hungry banks and blind inactions from the government and Federal Reserve.

And much of it was already in Barbarians of Wealth, the book Sandy Franks and I co-authored last year:

Chapter 11: The Scourge of Wall Street talks about Goldman Sachs’ exploits. Chapter 6: Race to the Bottom Line talks about deregulation… It’s this kind of stuff that needs to be aired — not behind the closed doors of some government commission to be released more than a year later.

If you haven’t picked up a copy of Barbarians of Wealth yet, consider it a kind of New Year’s resolution. The barbaric tales of Wall Street are still relevant today. Perhaps even more so, as one commissioner, Byron S. Georgiou, said the financial system is not that different today as it was before the crisis.

“In fact,” he said, “the concentration of financial assets in the largest commercial and investment banks is really significantly higher today than it was in the run-up to the crisis, as a result of the evisceration of some of the institutions, and the consolidation and merger of others into larger institutions.”

The protections inside shouldn’t be missed…

Editor’s Note: Do you have the government form that could make you 81% in a day? Inside an obscure Canadian government form is a tip-off about a massive silver discovery. You could make 81% in a matter of hours when the discovery is announced to the public. This announcement could happen any day now. Find out how to cash in on this silver investment.

About the Author

Sara is Managing Editor of Smart Investing Daily. As Senior Research Director and global correspondent, Sara Nunnally’s diverse resume includes studies in art history, computer science and financial research. She has appeared on news media such as Forbes on Fox, Fox News Live, and CNBC’s Squawk Box, as well as numerous radio shows around the country.

As Senior Research Director, global correspondent and managing editor of Smart Investing Daily, Sara has traveled all over the world in search of the best investment opportunities to recommend to her readers, be they in developed economies like France and Italy, in emerging markets like the Czech Republic and Poland, or in frontier terrain like Vietnam and Morocco. Her unique “holistic” approach of boots-on-the-ground research has given her an edge in today’s financial marketplace as she searches for the next investment opportunities in hot sectors like alternative energy, currency markets and commodities.