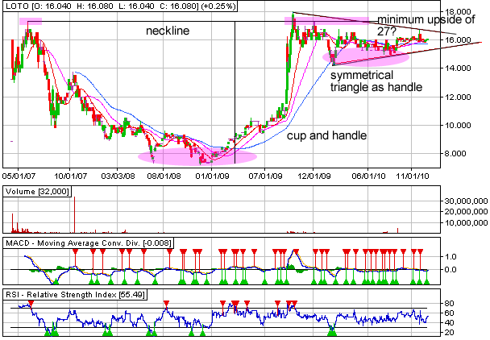
Who Wants To Win The (LOTO)?


Pacific Online Systems Corporation or LOTO in the Philippine Stock Exchange is engaged in the business of developing and managing online systems for the Philippine gaming industry. It also leases to the Philippine Charity Sweepstakes Office (PCSO) an on-line lottery equipment and accessories for the PCSO’s lottery operations in Visayas and Mindanao. For the first 3 quarters of 2010, the company already racked up P220 million in net income, up by 8% from the same period of 2009. With the 6/55 jackpot reaching a record high of P741 million in November, 4th quarter revenues from equipment leasing would most likely swamp the previous year’s figures. With the introduction of a more varied and exciting new games, sustained marketing effort, plus the government’s push to eradicate illegal gambling as well, growth in the company’s income would most probably supported.

Technically, a nice cup and handle pattern appears to be forming in the daily chart of LOTO. What is exciting about it now is that LOTO could be in the verge of a break out soon. Would the likely increase in the company’s fourth quarter bottomline push the stock higher? Probably. In any case, if LOTO breaks out of the said pattern, an upside of P27.00 (measured by projecting the height of the cup from the point of potential breakout) could be achieved. It’s not exactly the return you would have if you win the lottery but a potential capital gain of around 60% is already a handsome one, right?

More on LaidTrades.com


The January Effect On The Dow Jones Industrial Average


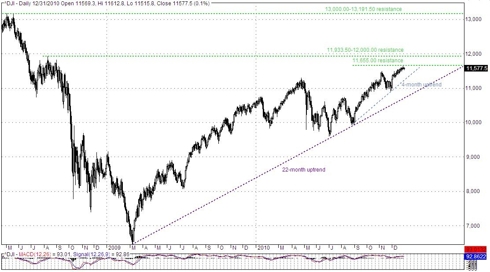
Happy New Year everyone!!! The Santa Clause Rally gave the Dow Jones Industrial Average (^DJI) a decent rise for the final month of 2010. From 11,007.30 on December 1st, the ^DJI ended the month up by 570.20 points to 11,577.50. Moreover, the “January Effect” is on the way and could further boost the Dow’s ascend. The “January Effect” phenomenon is when the stock markets rise on the first week of January as many investors choose to sell their stocks right before the end of the year to be able to claim a capital loss for tax purposes. Then when the tax calendar gets refreshed for the new year, investors start buying stocks once again. This has been proven by history however as more people expect this and try to ride, it usually losses effect. Let’s see if this will take place on the following days.

The Dow Jones Industrial Average has been on an uptrend since March of 2009 after the financial crisis. Zooming in closer, there is a steeper uptrend in the 4-month time frame. From short to long term, the ^DJI is in bullish mode as long as the trend remains intact. In my opinion, following the 4-month uptrend in accordance with the possible “January Effect” phenomenon, the Dow Jones Industrial Average could continue to rise in the coming days as the MACD is moving above 0 as well. In case it does, the 2-year high at 11,655 could be hit. If that gets broken another 400-500 points could be added to this index until it encounters some selling pressure at the 11,933.50-12,000.00 resistance. If that resistance area gets cleared out, the next resistance could be around the 13,000.00 level. On the downside, the immediate support could be the 4-month uptrend. Once that breaks, the next support could be the 22-month uptrend.

More on LaidTrades.com


First Philippine Holdings (FPH) to Make 2011 Its Year?

Last December 2009, First Philippine Holdings Corporation or FPH in the Philippine Stock Exchange disclosed that it is planning to invest more than $750 million in renewable energy. The company’s chief financial officer, Francis Giles Puno, said the company is planning to produce 200-megawatts of wind power, with a cost of about $3 million per megawatt, from the farms they are building. This project will be coursed under its subsidiary, Energy Development Corporation (EDC) and will be partly financed by a proposed $200 million dollar bond offering during the first quarter of this year. Presently, the company is also in the process considering the viability of building three hydroelectric power plants, worth $150 million, in Mindanao. If all goes well, construction of the plants will commence this year. Additionally, FPH also plans to invest $40 million in solar farms. These additional investments could of course provide some sustainable cash stream for the company in the foreseeable future.

San Miguel Corporation (SMC) and Aboitiz Power (AP), with their investments in energy and power generation, were the flavors of 2010. Now, given FPH’s additional venture in the same industry and their expertise (Meralco and FGEN), 2011 could be a blow out year for the company.

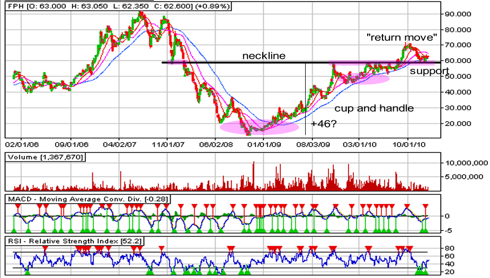
From a technical perspective, FPH had already broken out from a cup and handle formation during the early part of the fourth quarter of 2009. However, it was not able to sustain its move upwards, causing it to just move sideways and then eventually revisit the cup and handle’s neckline. Presently, the shares of FPH are just hovering above the neckline at around PHP 60.00. This “return move” now gives us a better opportunity to get in and ride FPH’s potential move higher. If the support at PHP 60.00 holds, FPH could then aim for its upside target of around PHP 100.00 (gauged by projecting the height of the cup from the point of breakout).

More on LaidTrades.com


British VAT Rises From 17.5% To 20.0%

2011 promises to be a turbulent 12 months on the currency exchange markets and already the news is pouring in.

UK

British VAT has increased from 17.5% to 20.0% this morning. This rise (combined with expected tax increases) could prompt reduced consumer spending in the UK in the coming months. For the moment though the retail sector has swallowed the increase to encourage sales.

Festive sales in the UK rose to their highest ever levels in the UK this December. John Lewis for instance posted a 30% increase on its previous record for December 27th. However (as mentioned) tax increases and the VAT rise mean these levels are unlikely to last.

Finally UK mortgage approvals for November hit 48 thousand beating expectations of 47 thousand according to new figures. This bodes well for the UK housing market and could improve sentiment toward sterling.

EU

In the euro zone meanwhile on January 1st Estonia became the 17th nation to join the common currency. This is unlikely to bolster the EMU: Estonia has a population of only 1.3 million and is the smallest member of the EMU. Indeed several journalists are suggesting the euro faces collapse in the near future.

For instance EMU governments and banks must refinance €900 billion of debt between them in the first 6 months this year. This might be difficult: there may be insufficient demand on the markets to meet this requirement meaning several nations could be forced to seek ECB bailouts.

US

In the US manufacturing figures rose for the 17th consecutive month in December. This has led Goldman Sachs to suggest further quantitative easing (in addition to the $600 billion program already in progress through the Fed) may be unnecessary, and as such improved sentiment toward the dollar.

Upcoming Today

In the US the minutes of the last Fed meeting are released today. This will indicate the direction of US economic policy for the coming months.

http://www.purefx.co.uk

NZD/USD Reverses Course, Targets 0.7500

By Greg Holden

The US dollar’s decline against most other major currencies yesterday appears to have skipped the Pacific country of New Zealand. The NZD/USD, as will be shown below, actually underwent a bearish session, with many indicators signaling a continuation of this downtrend.

Looking at the chart below, we can see that the pair spiked upward as 2010 came to a close, but has actually reversed course over the past few days.

The Stochastic (slow) reveals a bearish cross taking place just before the end of the year, followed by a now descending price movement. This suggests added momentum to the newly formed downward direction of the pair.

The Williams Percent Range and Relative Strength Index (RSI) both show similar price behavior. Both of these indicators were floating in the over-bought region and have since begun to move downward, suggesting bearish pressure. In the case of the RSI, the price appears to still be over-bought, which highlights the bearish notion further.

It appears this pair has entered a downturn which may last throughout the remainder of the week with a short-term target near 0.7650 and a longer-term target of 0.7500. Traders have a chance to capture these movements for profit with short positions in their Forex Trading Account.

Forex Market Analysis provided by ForexYard.

© 2006 by FxYard Ltd

Disclaimer: Trading Foreign Exchange carries a high level of risk and may not be suitable for all investors. There is a possibility that you could sustain a loss of all of your investment and therefore you should not invest money that you cannot afford to lose. You should be aware of all the risks associated with Foreign Exchange trading.
Dollar Tumbles as Investors Turn to Riskier Assets

Source: ForexYard

The US dollar slid against the euro following a rally in global equity markets. The rally prompted investors to turn to higher yielding riskier assets and away from the USD. With recent market optimism, traders may continue to see a small downward trend in the dollar as its positions are unwound in exchange for higher yielding assets.

Economic News

USD – Dollar Drops on Renewed Risk Appetite

The US dollar slipped against the EUR and CHF Monday, erasing some early morning gains after encouraging US economic data sent traders into riskier, higher-yielding assets. By yesterday’s close, the greenback had fallen against the EUR, pushing the oft-traded currency pair to 1.3360. The dollar experienced similar behavior against the Swiss franc, closing at 1.5485.

The ISM manufacturing index rose to 57.0 last month, nearly in line with the consensus forecast of 57.1. The manufacturing sector has been steadily growing in recent months, indicating the pace of economic recovery could be picking up. November construction spending also rose for a third straight month, providing a positive sign for US growth.

The economic reports from Monday bolstered US Treasury yields, but higher yields weren’t enough of an incentive to get the few active market participants to continue buying dollars. Instead, traders saw the upbeat news as a reason to search out riskier assets. US stocks and crude oil were among the biggest beneficiaries of increased risk demand.

Looking ahead to today, the most important economic indicators scheduled to be released from the US are the Factory Orders at 15:00 GMT. Traders will be paying close attention to today’s announcement as a stronger than expected result may continue to boost risk appetite in the short-term.

EUR – EUR Rises on All Fronts

The euro rallied broadly against most of it major currency pairs on Monday as US stocks rose, though gains were likely temporary given doubts about the ability of euro zone members to tap bond markets. The 17-nation currency extended gains against the US dollar and closed around 1.3350. The EUR experienced similar behavior against the GBP as the pair rose from 0.8540 to 0.8625 by day’s end.

Thinned trading due to holidays in Tokyo and London added to the volatility in the euro. The addition of Estonia to the euro zone has also helped add positive sentiment to the region.

The EUR was affected by a US stock market rally and a bearish dollar. Growth in stocks led investors to buy-back into the EUR, as they looked for returns on buying commodity-linked and higher-yielding currencies in Monday’s trading.

Turning to today, traders will want to pay particular attention to the US FOMC Meeting Minutes, scheduled to be released at 19:00 GMT. Should the meeting minutes indicate further improvements in the US economy, the euro could maintain its current course, and could even push the 1.3500 resistance level against the greenback.

JPY – Yen Lower vs. Major Currency Pairs

The Japanese yen saw a very bearish trading session yesterday, losing ground against all of its currency crosses. The JPY fell against the USD and closed around 81.75, Moreover; the yen lost almost 100 points versus the EUR, closing at 109.10; and just about 80 points versus the CHF.

The JPY’s trends will be affected by the rallies of its primary currency pairs today. It seems that the USD and EUR are expected to continue trading volatile today, especially against the Japanese currency.

Traders should keep a close look on the news coming from the US and Europe as these economies will be the deciding factors in the JPY’s movement today, especially the FOMC Meeting Minutes at 19:00 GMT. It is also advisable for traders to follow any unexpected comments coming from key Japanese governmental figures, as this is also likely to lead to further JPY volatility.

Crude Oil – Crude Oil Trades at 27-Month High

Oil prices rose to a 27-month peak on Monday as upbeat European and US manufacturing data, and forecasts for cold weather, reinforced optimism about economic and energy demand growth. Crude oil rose to $92.56 a barrel, its highest settlement since early October 2008, before rebounding back to $91.51.

Manufacturing in the United States and Europe accelerated in December and growth in China and India slowed to a more sustainable level, helping to fuel a move by investors into commodity-link and higher-yielding currencies.

Technical News

EUR/USD

The 4-hour chart is showing mixed signals with its RSI fluctuating in neutral territory. However, there is a fresh bearish cross forming on the daily chart’s Slow Stochastic indicating a bearish correction might take place in the nearest future. Going short might be a wise choice.

GBP/USD

The pair has been range-trading for a while now, with no specific direction. The daily chart’s Slow Stochastic is providing us with mixed signals. The 4-hour chart does not provide a clear direction either. Waiting for a clearer sign on the hourlies chart might be a good short-term strategy today.

USD/JPY

The USD/JPY cross experienced a bullish trend yesterday. However, it seems that this trend may be coming to an end. The Williams Percent Range of the 4-hour chart shows the pair floating in the over-bought territory, indicating that a downward correction could happen anytime soon. Going short with tight stops might be a wise choice.

USD/CHF

The pair has recorded much bearish behavior in the past several days. However, the technical data indicates that this trend may reverse anytime soon. For example, the daily chart’s Stochastic (slow) indicates that a bullish reversal is imminent. An upward trend today is also supported by the RSI. Going long with tight stops may pay off.

The Wild Card

Crude Oil

Crude Oil prices rose significantly in the last two days and peaked at $92.50 a barrel. However, the 4-hour chart’s RSI is floating in the over-bought territory suggesting that the recent bullish trend is losing steam and a bearish correction may be impending. This might be a good opportunity for forex traders to enter the new trend at a very early stage.

Forex Market Analysis provided by ForexYard.

© 2006 by FxYard Ltd

Disclaimer: Trading Foreign Exchange carries a high level of risk and may not be suitable for all investors. There is a possibility that you could sustain a loss of all of your investment and therefore you should not invest money that you cannot afford to lose. You should be aware of all the risks associated with Foreign Exchange trading.
Triple Bottom seen in CADCHF

By Forex Signs, Inc.

The CADCHF pair seems deceiving at the opening of the trading session today. The pair initially dumped off a bearish candle stick at H1 chart then had a reversal breakout at the following stick. The bullish reversal was 30 pips from the opening price. At the time of writing, the pair has been moving sideways; trading at a low volume. Resistance level is 0.9425 while support is 0.9423. Looking back at yesterday’s session, the USDCHF pair already completed a triple bottom pattern. The Alligator indicator indicated that the pair began bearish but towards end of session, the alligator closed its mouth. Today’s session, the pair is looking strongly pulled upward by a bullish force. The MACD (12, 29, 9) has already surpassed the 0.00 scale in H1 time frame. As of press time, the signal has already reached 0.0006. For the longest time, the MACD has finally touched the scale above 0; meaning there is a greater chance that the pair will pursue an upward trend. To further support this analysis, %R (14) is seen lingering at the above -20 level. The line has not yet touch the extreme 0, when it does, it is advisable to hold the pair first then buy it back once it has already neutralize. Behold the Alligator as it just opened woke up from a long sleep and it looks like that it is very hungry to feed on an upward trend. A strong buy is recommended once the price level breaks initial resistance.

Asian Session Outlook

Similar trend patterns were traced yesterday for the Japanese yen, aussie, and kiwi. The three major currencies of the Asian region moved sideways against the U.S. dollar whilst alongside euro, there was a significant downfall recorded. Investors probably played it safe trading the greenback as they were waiting for the release of U.S. economic indicators. Meanwhile, the trades against euro were all bullish. The EURJPY pair or euppy fell 39 pips. EURAUD on the other hand collapsed 60 pips; and finally, the EURNZD pair decreased by 47 pips. The bullish force shown by Asian currencies alongside euro may probably because speculators influenced the trade that the three musketeers of the Asian region were considered as currency safe haven compared to euro. Speculators have a great influence in the trade today as most countries are still observing a Bank Holiday.

For today’s session, the three Asian currencies may just move sideways as there are no market-moving indicators set for release. The trade may be influenced by indicators backing up their American and European counterparts. Studying the rival’s market-movers, there is a chance that the trades against euro will further incline; whilst against greenback, the trend might fall a few pips. However, there is a probability that the Australian dollar can move an upward trend against both currency counterparts as an increase in their Commodity Prices in December is expected.

About the Author

Forex Signs, Inc., Founded in 2006 in Wall Street, New York City, FSI relentlessly strives to be the premier Forex brokerage company in the industry by providing exclusive and unmatched trading and investment related services while constantly developing innovative solutions that cater to the vast requirements of both individual and institutional market participants.

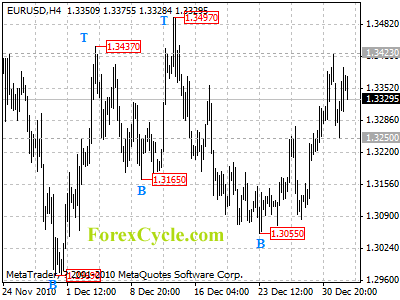
EURUSD remains in uptrend from 1.3055

EURUSD remains in short term uptrend from 1.3055, the fall from 1.3423 is likely consolidation of uptrend. Another rise to test 1.3497 resistance is still possible, a break above this level will indicate that the longer term downtrend from 1.4281 (Nov 4, 2010 high) had completed at 1.2969 already, then further rally could be seen to 1.3700 area. Initial support is at 1.3250, below this level will indicate that a cycle top had been formed at 1.3423 on 4-hour chart, then the following downward move could bring price to 1.3000 area.

eurusd

Daily Forex Signals

What Rising Commodity Prices Mean for Investors

On the last trading day in 2010, gold prices traded up $15.50 to more than $1,421 an ounce and oil prices ended above $91 a barrel. Indeed, gasoline prices are back above $3 a gallon, up more than 44 cents from last year!

But these hard assets aren’t the only things climbing… look at the prices of these other commodities. Coffee futures have jumped more than 60% in 2010, and sugar has nearly doubled in the past six months alone.

Wheat prices are up more than 46% in the past six months despite seesawing through much of the third and fourth quarters. Corn’s up nearly 57%, and soybeans are up better than 51%.

I could go on and on…

What’s behind these moves in commodity prices, and what does this mean for your investment portfolio?

In past Smart Investing Daily issues, we’ve made the connection between the U.S. dollar’s performance against other currencies and the rise and fall of commodity prices.

This link is simple: Every commodity priced in dollars is subject to price fluctuations based on the value of that dollar. That’s why some commodities make great hedges against a falling dollar.

What’s Behind Commodity Price Gains?

But is the U.S. dollar behind these major commodity price gains?

Yes, of course… But that’s only half the story. Here’s a six-month futures chart of the U.S. Dollar Index, which compares the greenback to a basket of major currencies:

US-dollar-index-icefi

You can see the index has fallen nearly 7% in the past six months. A move like this is pretty big in the currency world, and it certainly results in sizable swings in commodity prices.

But another reason commodity prices are rising could just be the fledgling recovery.

Consider this: In the past month, crude oil inventories have fallen by 20.3 million barrels. And while it is winter, and we expect declining stocks, this data is significant. Crude oil production in the U.S. is higher than it was a year ago, as are imports.

That means demand is on the rise.

Same with gold. When the official statistics come out, the World Gold Council expects jewelry demand for 2010 to outpace 2009, particularly due to a recovery in India and increased Chinese demand.

There’s also demand from central banks. Russia, for example, increased its gold holdings by 7% in the third quarter of 2010.

And gold is even making a comeback in industrial uses. In every region of the world, gold industrial demand has climbed in the first half of 2010 compared to 2009.

Climbing demand is found in agricultural commodities as well. The U.S. exported $108.7 billion worth of agricultural products in the fiscal year of 2010 — up 13% from 2009. Everything from cotton to sugar to dairy products jumped in value… and many experienced sharply higher shipments. Soybean exports climbed 20%!

And imports climbed, too: 8% compared to 2009.

Rising Commodities Mean a Sign of Recovery

This is a good sign that the recovery is gaining ground. It also means that commodities could be more than just a hedge in your portfolio in 2011.

Here’s a captured image of the top 10 ETF gainers for the last day of 2010.

10-etf-gainers-2010

Eight out of 10 of these ETFs are commodity-based. And look at some of the three-month gains…

  • SGG up 45%
  • DAG up over 32%
  • UCO up over 23%

With these kinds of gains, what will 2011 bring?

My gut tells me that many commodities will see at least a small pullback in price. These gains are far too good for many investors to leave on the table, and we could see a lot of profit taking. I think this would be good for the commodity market as a whole, and it would consolidate some of the sharp price increases we’ve seen in the charts.

Any pullback would be an interesting opportunity for investors to start dabbling in commodities — either through an ETF or through futures… or even options on those futures.

Aside from gold, which should be a staple in any investors portfolio if only for its hedging qualities, I’d take a look at agricultural commodities. Three of the eight commodity-based ETFs in the top-10 chart above are focused on agricultural commodities.

But take a moment to see what happens in the first week or two of trading in 2011. We’ll be back to higher volume trading, and we’ll be able to get a better sense of how the market will view the major gains some of these ETFs have made heading into the new year.

Smart Investing Daily will follow up on this idea in subsequent issues, but as always, feel free to send us your ideas and comments.

Article brought to you by Taipan Publishing Group. Additional valuable content can be syndicated via our News RSS feed. Republish without charge. Required: Author attribution, links back to original content or www.taipanpublishinggroup.com.

Facebook Reportedly Takes In $500M in Investments

Facebook has reportedly received $500 million in new investments. The New York Times is reporting that the social networking site has received $450 million from Goldman Sachs (GS) and $50 million from Russian investment firm Digital Sky Technologies.