FOREX: Currency Speculators decrease shorts of US Dollar. Add to Euro shorts

By CountingPips.com

The latest Commitments of Traders (COT) report, released on Monday by the Commodity Futures Trading Commission (CFTC), showed that futures speculators decreased their short bets of the US dollar against the other major currencies. Non-commercial futures positions, those taken by hedge funds and large speculators, were overall net short the US dollar by $8.97 billion against other major currencies as of December 21st. This is down from the total short position of $9.46 billion on December 14th, according to the CFTC data and calculations by Reuters which calculates the dollar positions against the euro, British pound, Japanese yen, Australian dollar, Canadian dollar and the Swiss franc.

EuroFx: Currency speculators added to their shorts of the euro against the U.S. dollar to 14,093 short contracts as of December 21st. This is approximately 4,000 more than the short positions on December 14th which saw 10,304 euro short contracts.

The COT report is published every Friday by the Chicago Mercantile Exchange (CME) and shows futures positions as of the previous Tuesday. It can be a useful tool for traders to gauge investor sentiment and to look for potential changes in the direction of a currency or commodity. Each currency contract is a quote for that currency directly against the U.S. dollar, where as a net short amount of contracts means that more speculators are betting that currency to fall against the dollar and net long position expect that currency to rise versus the dollar. Open interest is the number of open contracts that have not been closed by a transaction or by delivery.

GBP: Speculators trimmed their British pound sterling positions for a second straight week to a total of 7,432 short contracts on December 21st following the previous week’s short positions of 8,186 contracts. Pound sterling contracts have now been short for four straight weeks dating back to November 30th.

JPY: The Japanese yen net long contracts were basically unchanged as of December 21st with 12,529 long contracts from 12,735 net long contracts reported on December 14th.

CHF: Swiss franc long positions rose higher for a third straight week to a total of 12,527 long contracts as of December 21st after totaling a net of 10,716 long contracts on December 14th.

CAD: The Canadian dollar positions decreased as of December 21st. CAD long positions registered 24,948 contracts after totaling 33,396 net longs on December 14th.

AUD: The Australian dollar positions advanced higher for a third consecutive week after nine straight weeks of declining positions. AUD contracts increased to a net amount of 60,550 long contracts as of December 21st from 53,778 long contracts on December 14th.

NZD: New Zealand dollar futures positions declined for a fifth straight week as of December 21st. NZD long positions fell to a total of 7,366 long contracts after a total of 12,521 long contracts the week before.

MXN: Mexican peso long contracts edged slightly higher as of December 21st to 78,002 net long positions from 77,168 longs the week prior. The latest data is a second straight week of increase for the Mexican peso speculative positions.

COT Data Summary as of December 21st, 2010
Large Speculators Net Positions vs. the US Dollar

EuroFx: -14,093
British pound sterling: -7,432
Japanese yen: +12,529
Swiss franc: +12,527
Canadian dollar: +24,948
Australian dollar: +60,550
New Zealand dollar: +7,366
Mexican peso: +78,002

Go to the Commitment of Traders CME raw futures data

Further COT Resources from around the web:

The Most Important Stock Market Chart of the Week

Jared Levy, Editor, Smart Investing Daily, TaipanPublishingGroup.com

Editor’s Note: When I read Jared’s article, titled “The Most Important Chart of the Week,” in mid-December, I thought to myself, “This isn’t just a short-term opportunity.”

I think it’s a long-term lesson.

Jared reminds us that the all-important Dow Jones Industrial Average is only made up of 30 stocks out of some 5,000. And while these companies may be some of the biggest and most influential in the world, they’re hardly a good representation of the market as a whole.

Indeed, compared to the S&P 500 and the Nasdaq, the Dow has lagged behind in gains this year.

That’s why I’ve chosen Jared’s article as one of the “best of” Smart Investing Daily articles we’ve published this year. I’m reposting this for you in its entirety.

I hope you can take away a big lesson — that the markets can no longer be pigeonholed into a snapshot of just one index.

Enjoy, and happy holidays…


Aside from the somewhat positive fundamentals of both the macroeconomic improvements and individual companies’ improved fiscal health, we have year-end window dressing and some good old statistical (and superstitious) beliefs working in your favor, especially if you are a bull.

What I have not addressed yet are some of the key technical levels that you need to be aware of. In just about every stock trade I make, I am paying close attention to a minimum of two stock market charts (usually more). I don’t just analyze the stock that my investment is in, but also a large index, such as the SPX, OEX, NDX or similar.

Don’t Pay Attention to the Dow Jones Industrial Average

I do NOT use the Dow Jones Industrial Average, because I feel the index is flawed in that it concentrates on the price of the stock for its weight in the index as opposed to its real value. In addition, to me, 30 stocks out of the over 5,000 stocks that trade on major exchanges is just not a good sample size. But I digress…

Get Paid 4 Times Your Money Using the Lucrative Secret of China’s “Top Cop”

One senior Communist official is poised to start collecting a million-dollar retirement check, as early as tomorrow.

Act immediately and you could ride his coattails for a 400% gain.

Learn more from American Wealth Underground.

The S & P 500 Can Show You the Market’s “Hand”

Out of all the commonly watched indexes out there, the S&P 500 or SPX is the preferred barometer of most professional traders, because of its breadth and diversity. The S&P 500 is a collection of about 500 stocks (it varies at times) that cross many sectors. The price levels of the S&P 500 are not only used as major support and resistance for traders, but they can send individual stocks higher or lower.

There is a unique characteristic about big indexes and ETFs like the SPX and SPY. You would think the index itself is just telling us where stocks are; in other words, it gets its value from the changes in the stocks. But because of arbitrage, the behavior of ETFs and the weighing of certain stocks within that index, it sometimes works the other way around. When roles reverse, the tail wags the dog, so to speak, and the index determines where many stocks are headed. I mean, why do you think experts are always quoting support and resistance levels in the indexes if they were only monitors for the hundreds of stocks within them?!

So today, I am going to tell you the levels you need to watch out for and where I think we may head from here.

Economic Calendar

This week’s economic docket is chock-full of data and potential market movers. Unlike last week, where the expectations were for quiet sailing, expect movement as we progress through the second week of December.

Check out the chart below for all the economic data and estimates due out this week.

Chart courtesy of forexfactory.com
December Economic Calendar
View Larger Chart

The Levels You Need to Be Aware Of

The chart of the SPX below tells us much about the current trend and why we need to watch the 1,221 support level very carefully. That number was not only the former high made back in April, but it was also a support level formed back in July of 2008. The recent breakout about this level is and continues to be a bullish sign, but a violation below it could mean the SPX could drop to its next support level of 1,170. If you are currently long and notice the SPX breaking below 1,221, and if it’s looking like it might close below that level, you might want to evaluate that long position for an exit.

View Larger S & P 500 Chart
View Larger Chart

For now, barring any adverse data this week, the market is struggling higher. However, watch for late-day weakness and note the stochastic hanging out in the overbought area, which is typical, but not something to be ignored. Also keep your eye on the 20-day moving average compared to the 50-day moving average. Right now, the 20-day is on top, but converging into the 50. If they cross, that could be our signal that at least the short-term trend is over.

Where to find “real wealth”…

If you guessed the U.S., you’re in for a shock. The U.S. economy may be recovering, but it’s nothing compared to the area some analysts are calling the “Global Wealth Zone.” Investors who move their money into the Global Wealth Zone now could more than double their net worth… but only if you know exactly where to look.

Act immediately and you could ride his coattails for a 400% gain.

Learn how you could be banking gains of 102.5%, 45.8% and 204.9% in the days ahead… It’s all in this investment report.

Don’t be greedy this week and make sure you tell your friends about Smart Investing Daily!

*Note: By the way, so far Jared’s analysis of the S&P 500 has been spot-on… The index found support at 1,235 before breaking higher. That said, Jared’s levels referenced in this article should still be monitored. It wasn’t a true test of the 1,221 support level, so the S&P 500 could still see a bit of a correction. Should that happen, Jared’s warning of a drop to the next support level of 1,170 should be heeded.

About the Author

Jared Levy is Co-Editor of Smart Investing Daily, a free e-letter dedicated to guiding investors through the world of finance in order to make smart investing decisions. His passion is teaching the public how to successfully trade and invest while keeping risk low.

Jared has spent the past 15 years of his career in the finance and options industry, working as a retail money manager, a floor specialist for Fortune 1000 companies, and most recently a senior derivatives strategist. He was one of the Philadelphia Stock Exchange’s youngest-ever members to become a market maker on three major U.S. exchanges.

He has been featured in several industry publications and won an Emmy for his daily video “Trader Cast.” Jared serves as a CNBC Fast Money contributor and has appeared on Bloomberg, Fox Business, CNN Radio, Wall Street Journal radio and is regularly quoted by Reuters, The Wall Street Journal and Yahoo! Finance, among other publications.

Google Looking to Build Marketplace for Online Learning Prog

Google (GOOG) shares are higher Tuesday trading as the Internet search giant is reportedly talking with educational software companies to build a marketplace for online learning programs. Google is reportedly hoping to lure more educational developers with the move. Google shares are up 0.33% on the news to $604.38.

Forex Daily Market Commentary

By GCI Forex Research

Fundamental Outlook at 0800 GMT (EDT + 0400)

The euro appreciated vis-à-vis the U.S. dollar today as the single currency tested offers around the US$ 1.3275 level and was supported around the $1.3160 level.  Technically, today’s intraday high was right around the 61.8% retracement of the $1.2650 – 1.4280 range.  The dollar was weak across the board including the majors and the Antipodean dollar bloc.  Data released in the U.S. today saw the October CaseShiller home price index decline more than expected at -0.99% m/m and -0.80% y/y.  These data evidence a U.S. housing market that likely began the fourth quarter on a weak note despite strong indications the Federal Reserve would be easing monetary policy drastically.  Other data released to be released today include December consumer confidence and the December Richmond Fed manufacturing index.  European Central Bank member Mersch called for tougher penalties against eurozone countries that exceed fiscal deficit limits, incuding near-automatic sanctions.  The European Central Bank last week increased its intervention in the eurozone government bond market with purchases under the ECB’s asset-buying program escalating to €1.1 billion from €603 million the previous week.  ECB member Stark this weekend reported “Helping governments cannot and should not be a goal of these (bond-buying) operations.”  German December consumer price inflation data will be released tomorrow.  French Q3 gross domestic product data were released today and narrowed to +0.3% m/m and +1.7% y/y.  Estonia will be joining the eurozone as of the New Year and this will increase the size of the bloc to seventeen members.  In U.S. news, traders continue to speculate on whether the Federal Reserve will be forced to ease monetary policy further in 2011. The U.S. dollar’s recent pullback is coinciding with a move higher in riskier assets including crude oil and gold.  It was reported today that more than 50% of the credit provided through the Federal Reserve’s emergency Term Auction Facility went to foreign banks during the financial crisis.   Notably, the Dow Jones Industrial Average has risen approximately 14% since Fed Chairman Bernanke hinted at the end of August that the Fed could expand policy further, a move it made in early November by announcing it could purchase as much as US$ 600 billion in additional U.S. Treasury securities by the middle of 2011.  New voting members of the Federal Open Market Committee will be casting rate-setting votes in 2011 and many Fed-watchers believe the new voting members as a whole may provide the Fed with a more hawkish bent.  Euro bids are cited around the US$ 1.2995 level.

¥/ CNY

The yen appreciated vis-à-vis the U.S. dollar today as the greenback tested bids around the ¥81.80 level and was capped around the ¥82.85 level.  Technically, today’s intraday low was right around the 61.8% retracement of the ¥80.25 – 84.50 range.  Finance Minister Noda verbally intervened against the yen’s strength again, vowing to take “bold action when moves are excessive.”  Noda added the yen’s appreciation has been “one-sided” while Economy Minister Kaieda added “abrupt yen moves must be avoided.”  Japanese policymakers clearly remain preoccupied with preventing the yen’s advances from eroding exporters’ margins too much, especially after positive Japanese economic data were released overnight.    On 22 December, the government released an economic growth forecast that predicts economic growth will fall to +1.5% in the fiscal year beginning 1 April, down from the estimated +3.1% rate of growth in the current fiscal year.  Many data were released in Japan overnight. First, the November jobless rate remained steady at 5.1%.  Second, November overall household spending remained steady at -0.4%, defying expectations of an improvement.  Third, December Tokyo-area consumer price inflation was off 0.2% y/y at the headline level and off 0.5% y/y at the ex-food, energy level.  Fourth, November national consumer price inflation was up 0.1% y/y at the headline level and off 0.5% y/y at the ex-fresh food level, evidencing a minor uptick from October’s rate.  In October, Bank of Japan’s Policy Board forecast that core prices would rise 0.1% in the fiscal year beginning 1 April and 0.6% the following fiscal year.  Fifth, November industrial production improved significantly and was up 1.0% m/m and 5.8% y/y.  Sixth, November retail trade was up 1.9% m/m and 1.3% y/y.  Seventh, November labour cash earnings were off 0.2% y/y.  Minutes from Bank of Japan Policy Board’s 4-5 November meeting were released earlier this week and one voting member “was of the view that the effects of the measure taken (by the Federal Reserve to ease policy in early November) were highly uncertain and growth in the U.S. economy was still likely to remain low for some time.” BoJ officials also noted they needed to continue monitoring the impact of the yen’s gains on exporters with one member speculating gross domestic product growth could contract this quarter.  Officials warned the yen “might exert downward pressure on Japan’s economy by negatively affecting business and household sentiment.  A few members expressed the opinion that careful attention should be paid to the economy’s vulnerability to downside risks, particularly when the pace of economic improvement remained slow.”  The Nikkei 225 stock index lost 0.61% to close at ¥10,292.63.  U.S. dollar offers are cited around the ¥84.60 level.  The euro moved lower vis-à-vis the yen as the single currency tested bids around the ¥108.20 level and was capped around the ¥109.50 level.  The British pound moved lower vis-à-vis the yen as sterling tested bids around the ¥126.55 level while the Swiss franc moved higher vis-à-vis the yen and tested offers around the ¥87.15 level. In Chinese news, the U.S. dollar depreciated vis-à-vis the Chinese yuan today as the greenback closed at CNY 6.6250 in the over-the-counter market, down from CNY 6.6313.  People’s Bank of China raised the yield on one-year bills for the first time in seven weeks.  PBoC official Wu Nianlu reported it would be optimal if the yuan was convertible by 2016.  People’s Bank of China raised its one-year lending and deposit rates by 25bps on Saturday, its second rate hike since mid-October.  The benchmark lending rate increased to 5.81% and the benchmark deposit rate increased to 2.75%.  Many economists believe PBoC will front-load additional rate hikes and other monetary tightening policies in the coming months.  Notably, China has raised banks’ reserve requirements six times in 2010 and reduced loan growth from record levels.  These actions evidence a central bank and government that remain very concerned about elevated rates of inflation.  Data released in China overnight saw the November leading index tick higher to 101.58.  Data released in China earlier this week saw November industrial profits move lower to +49.4% y/y.  China is said to be targeting 8% GDP growth and 4% inflation growth in 2011 along with 16% M2 money supply growth.

£


The British pound appreciated vis-à-vis the U.S. dollar today
as cable tested offers around the US$ 1.5510 level and was supported around the US$ 1.5410 level. Technically, today’s intraday high was right around the 38.2% retracement of the $1.4230 –  1.6300 range.  The pair last week reached its weakest level since September.  Data released in the U.K. earlier this week saw the December Hometrack housing survey off 0.4% m/m and off 1.6% y/y.  Q3 Bank of England housing equity withdrawal data will be released tomorrow followed by December Nationwide house prices on Friday.  Bank of England Monetary Policy Committee member Fisher last week warned mortgage interest rates could reach 5%. Cable bids are cited around the US$ 1.5265 level.  The euro appreciated vis-à-vis the British pound as the single currency tested offers around the £0.8590 level and was supported around the £0.8530 level.

CHF

The Swiss franc appreciated sharply vis-à-vis the U.S. dollar today as the greenback tested bids around the CHF 0.9435 level and was capped around the CHF 0.9605 level.  The pair has now lost about twenty big figures from its 2010 high and fell to an all-time low today as the franc continues to sharply escalate.  Data released in Switzerland today saw the November UBS consumption indicator decline to 1.630 from the revised prior reading of 1.708, still indicating an expansion in consumer spending activity. The December KOF Swiss leading indicator will be released tomorrow.  There is intense focus on the Swiss franc by traders now.  Swiss National Bank Chairman Hildebrand has labeled the franc’s record rally a “burden” and options traders are said to more bullish on the franc over the next quarter than any other currency other than the yen.  SNB incurred approximately CHF 22 billion of intervention-related losses in the first nine months of 2010 on account of its inability to halt the franc’s appreciation and there is a broadening perspective the SNB may not be able to reverse the franc’s ongoing gains.  SNB last week reported “Concerns about stability in the euro area have led to renewed financial market tensions.  Should these tension be exacerbated and put a strain on economic developments in the euro area, this would also have a detrimental effect on the Swiss economy.  If a deflation risk emerges, the SNB would take the measures necessary to ensure price stability.” The SNB’s 2012 inflation forecast was reduced to 1% from 1.2% on 16 December, just a few months after SNB Vice Chairman Jordan reported intervention is no longer necessary because the deflation threat was almost gone.   Last week, the euro reached an all-time low vis-à-vis the Swiss franc.  U.S. dollar offers are cited around the CHF 0.9780 level.  The euro depreciated vis-à-vis the Swiss franc as the single currency tested bids around the CHF 1.2485 level while the British pound moved lower vis-à-vis the Swiss franc and tested bids around the CHF 1.4550 level.

Forex Daily Market Commentary provided by GCI Financial Ltd.

GCI Financial Ltd (”GCI”) is a regulated securities and commodities trading firm, specializing in online Foreign Exchange (”Forex”) brokerage. GCI executes billions of dollars per month in foreign exchange transactions alone. In addition to Forex, GCI is a primary market maker in Contracts for Difference (”CFDs”) on shares, indices and futures, and offers one of the fastest growing online CFD trading services. GCI has over 10,000 clients worldwide, including individual traders, institutions, and money managers. GCI provides an advanced, secure, and comprehensive online trading system. Client funds are insured and held in a separate customer account. In addition, GCI Financial Ltd maintains Net Capital in excess of minimum regulatory requirements.

DISCLAIMER: GCI’s Daily Market Commentary is provided for informational purposes only. The information contained in these reports is gathered from reputable news sources and is not intended to be U.S.ed as investment advice. GCI assumes no responsibility or liability from gains or losses incurred by the information herein contained.

Gold Miners Jump About 2% as Bullion Price Again Near $1,400

Shares of gold mining stocks are higher this morning, following bullion prices to the upside as dollar weakness and year-end buying brought the yellow metal back above $1,400 an ounce for the first time in nearly two weeks. Goldcorp (GG,G.TO) is leading the advance, adding more 2.3% heading into today’s open. Other gainers include: Yamana Gold up +2% Agnico-Eagle Mines up 1.8% Barrick Gold up 2.2% Kinross Gold up 1.8% Eldorado Gold up 2.1%

USD/CHF – Moves Past Previous Low

By Russell Glaser

The USD/CHF has continued its previous downtrend, moving below the all-time low for the pair set in October at 0.9559.

A channel has formed from the price action beginning in December and a price target may be estimated via the lower line of the channel.

Resistance comes in at last week’s low at 0.9500 followed by the high of today’s candlestick at 0.9560 and 0.9650.

Forex Market Analysis provided by ForexYard.

© 2006 by FxYard Ltd

Disclaimer: Trading Foreign Exchange carries a high level of risk and may not be suitable for all investors. There is a possibility that you could sustain a loss of all of your investment and therefore you should not invest money that you cannot afford to lose. You should be aware of all the risks associated with Foreign Exchange trading.

EUR/USD – Short Opportunity at the Trend Line

By Russell Glaser

An early morning rally in light liquidity has sent the EUR/USD close to its downward sloping trend line, setting up an entry opportunity to go short.

Following a rise in the price of the EUR/USD during the Japanese trading hours, the pair is trading close to its downward sloping trend line that falls from the November high and has a contact point in mid-December.

Traders can use this point as a setup to go short on the pair that is in a clear downtrend since November. The trend line should act as a resistance to any further move higher.

The first target will be the 50% Fibonacci retracement level from the June to November move at a price of 1.3080. This area has served as a support level during the consolidation pattern of the past two weeks.

Further support will be the 200-day moving average which comes in today at 1.3040, as well as the November low at 1.2870.

A stop loss can be placed above the close of yesterday’s candle by 20 pips at a price of 1.3274, giving traders a healthy 5:1 profit to risk ratio.

Forex Market Analysis provided by ForexYard.

© 2006 by FxYard Ltd

Disclaimer: Trading Foreign Exchange carries a high level of risk and may not be suitable for all investors. There is a possibility that you could sustain a loss of all of your investment and therefore you should not invest money that you cannot afford to lose. You should be aware of all the risks associated with Foreign Exchange trading.

Technical Analysis Provide Bullish Signals for NZD/USD

By Yan Petters

The NZD/USD has recently recovered from a 3-month low, trading as low as the 0.7340 level but failed several times to breach below this price. However, over the past weeks, the pair began to correct these losses and is currently trading near the 0.7525 level. In addition, bullish signals on the 8-hour chart suggest that the pair’s uptrend is likely to proceed.

• The chart below is the NZD/USD 8-hour chart.
• It can be seen that a bullish channel has formed after the pair recovered from a 3-month low.
• The pair is currently floating in the midst of the channel, suggesting that the bullish momentum has more steam in it.
• In addition, a bullish cross took place on the Slow Stochastic, also indicating that the bullish move has more room to go.
• Another bullish signal comes from the MACD which continues to point upwards and is currently floating near the 0.00 line. Potentially, the MACD can reach as high as the 0.10 level, and the pair is likely to follow it.
• The next resistance levels are located at the 0.7575, 0.7630 and 0.7665 levels.
• The next support levels are at: 0.7460, 0.7405 and 0.7340.

Forex Market Analysis provided by ForexYard.

© 2006 by FxYard Ltd

Disclaimer: Trading Foreign Exchange carries a high level of risk and may not be suitable for all investors. There is a possibility that you could sustain a loss of all of your investment and therefore you should not invest money that you cannot afford to lose. You should be aware of all the risks associated with Foreign Exchange trading.

Forex Market Gets Ready for 2011

Source: ForexYard

With slow trading expected today, investors will likely keep their eyes on the U.S. Dollar and whether it can maintain its recent upswing that it experienced last week. Set to be released later today, the U.S. Consumer Confidence report should give traders a good idea about the general direction of the greenback as 2010 draws to a close.

Economic News

USD – Dollar Declines against Major Rivals

The dollar fell against most of its major currency pairs on Monday, as risk appetite took a minor hit after China’s weekend rate hike. The People’s Bank of China said Saturday that it will raise interest rates for a second time in the current cycle as the government steps up its fight against inflation. But the post-Christmas trading day saw little activity and the major FX pairs then reversed their initial moves and were mostly trading flat in the afternoon. After yesterday, the USD fell against the EUR and closed at 1.3190.
Traders should note that most analysts do not see these dollar decreases as signs of a continued trend. With many investors on vacation for the holidays, USD movements may have just been a result of low liquidity and a slow news day on Monday. Traders will want to pay attention to the U.S. Consumer Confidence report set to be released at 15:00 GMT today.

A higher number then last month is forecasted for the report, which if indeed comes true, will likely support the dollar. Most analysts are saying that the American people are slowly regaining faith in the U.S. economy. If the consumer confidence figure reflects this sentiment, it could be an early sign as to where the dollar is headed in 2011.

EUR – EUR Higher in Thin Trading Day

The euro was steady on Monday after rebounding from a record low against the Swiss franc and a three-week low versus the dollar, though sentiment on the single currency remained bearish amid worries about Portuguese and Spanish debt. . By yesterday’s close, the EUR rose slightly against the USD, pushing the oft- traded currency pair to 1.3190. The 16 nation currency saw also a small bullishness against the CHF and closed at 1.2640

Yesterday’s trading ranks were extremely thin. London was closed on Monday and Tuesday for holidays and a blizzard in New York limited activity, ensuring only minor price fluctuations. However, analysts said concerns about fiscal troubles in some euro zone countries could result in further euro selling in the New Year.

The euro showed limited reaction to Fitch cutting Portugal’s long-term and local currency ratings by one notch to A-plus on Thursday, although this served as a reminder that sovereign debt problems will stay a key theme for 2011.

JPY – Yen Mixed Against Major Currencies

The Japanese Yen completed yesterday’s trading session with mixed results versus the major currencies. The JPY fell against the GBP yesterday, pushing the oft-traded currency pair to 127.90. The Yen experienced similar behavior against the EUR as the pair rose from 108.70 to 109.40 by day’s end. The JPY did see some bullishness as well, gaining 30 points against the USD and closed at 82.65.

Traders today have very little fundamental news emanating from Japan. As such the Yen will look towards equity movements as well as to U.S. and Euro-Zone news for market movements.

OIL – Crude Oil Falls from 26-Month High

Oil dipped below $91 per barrel on Monday after briefly hitting its third successive 26-month high, ending a five-day rally after a Chinese rate increase threatened to slow demand and a major East Coast refinery resumed operations.

As a major blizzard on the East Coast further diminished already thin holiday trading volumes and threatened to stoke oil demand for home heating, many traders expected the fourth-quarter rally to quickly resume toward $100 a barrel as key OPEC members showed no sign of moving to halt its rise.

Technical News

EUR/USD

The price of this pair appears to be floating in the over-bought territory on the 4-hour chart’s RSI indicating a downward correction may be imminent. The downward direction on the hourly chart’s Momentum oscillator also supports this notion. When the downward breach occurs, going short with tight stops appears to be the preferred strategy.

GBP/USD

The pair has been range-trading for a while now, with no specific direction. The Daily chart’s Slow Stochastic is providing us with mixed signals. All oscillators on the 4 hour chart do not provide a clear direction as well. Waiting for a clearer sign on the hourlies might be a good strategy today.

USD/JPY

The pair has recorded much bearish behavior yesterday. However, the technical data indicates that this trend may reverse anytime soon. For example, the 8-hour chart’s RSI signals that a bullish reversal is imminent. An upward trend today is also supported by the 4-hour chart’s Williams Percent Range. Going long with tight stops may pay off today.

USD/CHF

The USD/CHF has gone increasingly bearish yesterday and currently stands at the 0.9560 level. The daily chart’s Slow Stochastic supports this currency cross to fall further today. However, the hourly chart’s Stochastic Slow signals that a bullish reversal will take place today. Entering the pair when the signs are clearer seems to be the wise choice today.

The Wild Card

Oil

Crude oil prices rose significantly in the last week and peaked at $91.80 per barrel. However, the daily charts’ RSI is floating in overbought territory suggesting that a recent upwards trend is losing steam and a bearish correction is impending. This might be a good opportunity for forex traders to enter the trend at a very early stage.

Forex Market Analysis provided by ForexYard.

© 2006 by FxYard Ltd

Disclaimer: Trading Foreign Exchange carries a high level of risk and may not be suitable for all investors. There is a possibility that you could sustain a loss of all of your investment and therefore you should not invest money that you cannot afford to lose. You should be aware of all the risks associated with Foreign Exchange trading.

Aboitiz Transport System (ATS) to Sail High?

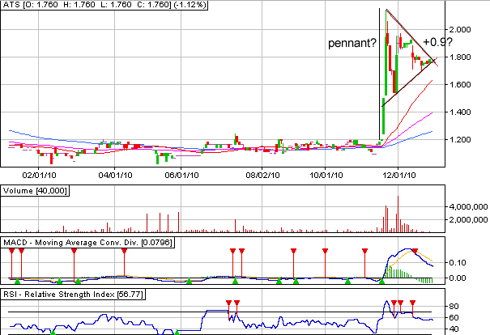
On December 6, Aboitiz Equity Ventures or AEV in the Philippine Stock Exchange disclosed that it would push through with the sale of its transport unit, Aboitiz Transport System (ATS) to Negros Navigation Co. (Nenaco). Aboitiz Equity Ventures is selling 1,889,489,607 common shares, representing 77.24% of ATS’ outstanding common shares. The proceed of which will be used by AEV to finance new investments in power, food, and banking. As previously mentioned, the purchase price for 100% of ATS’s outstanding common shares is $105 million, approximately equivalent to $0.043 per share. This would then translate to PHP 1.8920 per share at PHP 44.00 per 1 USD. So presently, the shares of ATS is still trading at a 7.50% discount, assuming an exchange rate of PHP 44.00 to a dollar,  given last Thursday’s close of PHP 1.7600 per share.

From a technical perspective, the shares of ATS have exploded from PHP 1.200 last November 18 to a high of PHP 2.14 on November 22. Since then, ATS, however, has consolidated in to what looks to be a pennant formation. A breakout from this pattern could send it at least back to its previous high at 2.14 or even to as high as 2.70 if the height of the pole of the pennant is projected upwards. But before anyone of you buys, it’s better to wait for a breakout which is confirmed by an increase in volume.

More on LaidTrades.com