Platinum Flag Formation Foreshadows Sharp Drop

By Greg Holden – I’m going to make a prediction here, then explain why I assume this. My prediction is this: Platinum prices are currently testing the lower boundary of a flat channel and, due to a number of factors which will be explained, the price is forecast to climb higher, with target prices at $1,565 and $1,600. However, upon reaching these price targets, we may expect a sharp decline in price, below the lower border of the flat channel.

Here’s why I make this forecast. First, as stated, the price is trading within a flat range with clear highs and lows, drawn in red lines on the chart (see below). It’s clear to see that the price is also moving upward at the moment, which supports this notion.

Second, the Fibonacci lines drawn on the chart demonstrate that the 23.6% support line (near $1,520 an ounce) has proven difficult for the price to breach. This level appears to represent one of the strongest psychological support lines for this commodity, and seems to highlight the fact that this commodity’s minimum accepted price by investors is around $1,500. For a variety of reasons, traders simply won’t allow the price to fall below that price.

Third, both of our oscillators – the RSI and Stochastic (slow) – agree with an upward movement. When the price fell towards $1,500, the RSI entered the over-sold territory and is now mirroring the price’s movements upward; which also suggests that momentum is building in an upward direction. The Stochastic (slow) has also recently touched the over-sold region and crossed the averages, representing a bullish cross. All of this together supports the idea of an upward move towards $1,565 an ounce, or possibly higher.

Platinum – Daily Chart

But don’t forget that I also said there is an expected sharp drop following the success of reaching this higher target. This is where I want to draw your attention to the long, sharp drop in price which occurred in May. We can call this sharp drop a flagpole, since it appears to have created the conditions for a flag formation.

Flags are precisely what you see above: a flat channel following a sharp movement. Channels are usually confirmed when three tops/bottoms have successfully formed. This verifies the trend. We can see above that we have two tops/bottoms, so we should expect to see one more, which indeed appears to be forming right now. Once the flag formation/channel has been confirmed, 9 times out of 10 we would then see the flag come to an end and the previous direction (i.e. the direction of the flagpole) continue. So, if I’m right, the price should climb towards $1,565, and perhaps even $1,600, after which the price may drop sharply, roughly the same size as the previous flagpole (meaning a price around $1,300).

So that concludes the analysis on Platinum, but before I end I want to provide a parallel with the EUR/USD. As I’m sure we’re all aware, commodities are priced in USD. This means that the EUR/USD typically provides similar movements to commodity prices.

Here is the EUR/USD daily chart with the same Fibonacci lines and oscillators.

EUR/USD – Daily Chart

The EUR/USD is currently consolidating towards 1.3000. The market has been fluctuating back and forth between risk appetite and risk aversion. This has created the consolidation pattern you see in this chart above. As you can see from the red lines drawn, the price has just touched the lower border of this trend (which is also a significant support level on the Fibonacci) and then bounced off. It is now ascending towards the upper border with a target around 1.3200, after which it will likely descend back towards roughly 1.2800.

As you may have assumed, a rising EUR/USD represents a declining USD, which also supports the idea of rising commodity prices (since they would be getting cheaper). Additionally, if the price of the EUR/USD does hit 1.3200 and then declines, this would mirror the same movement in Platinum prices once they reached $1,565, or $1,600.

More on the EUR/USD: after a consolidation trend like that seen above finishes, it is usually followed by a sharp movement, but the direction is traditionally unclear, at least from a technical standpoint. This gives us the unique opportunity to also use Platinum prices to predict the direction of the sharp movement of the EUR/USD after it consolidates at 1.3000. We know from the “flag formation” on Platinum that a downward movement is expected, at least from a technical point of view. This also means that after the consolidation point is reached on the EUR/USD that a strengthening dollar is being forecast, and the EUR/USD may drop towards 1.2300 or even 1.2200.

Let’s do a quick recap to finish:

1) I’m predicting that Platinum prices are going to rise, then fall sharply after hitting $1,565, or $1,600.
2) Technical oscillators like the RSI and Stochastic (slow) support this notion.
3) There is a flag formation on Platinum which supports the idea that prices will fall sharply after climbing towards the aforementioned targets.
4) The EUR/USD is also consolidating and is currently expected to move higher, which makes commodity prices rise from being cheaper in USD.
5) The EUR/USD may drop sharply towards 1.2300 or lower after it consolidates around 1.3000, due to what we can predict from the Platinum flag formation.

Forex Market Analysis provided by ForexYard.

© 2006 by FxYard Ltd

Disclaimer: Trading Foreign Exchange carries a high level of risk and may not be suitable for all investors. There is a possibility that you could sustain a loss of all of your investment and therefore you should not invest money that you cannot afford to lose. You should be aware of all the risks associated with Foreign Exchange trading.

Short Term Technical Analysis for Majors (07:30 GMT)

EUR/USD

Correction off 1.2586, 24 Aug fresh low, has tripped 1.2725 resistance today, reaching 1.2744. Near term outlook, however, remains negative, with scope for break below 1.2608/1.2586 to test 1.2522. Upside, 1.2770 caps for now, and possible break here to attract 1.2831, 20 Aug high.

Res: 1.2770, 1.2831, 1.2880, 1.2903

Sup: 1.2649, 1.2608, 1.2586, 1.2522

GBP/USD

Attempts to complete a third phase higher in a corrective structure from 1.5371, 24 Aug low. Earlier daily false break higher out of a rising channel dominates for an eventual return to weakness. Only regain of 1.5670/1.5700 zone would return to strength.

Res: 1.5617, 1.5670, 1.5687, 1.5700

Sup: 1.5482, 1.5460, 1.5425, 1.5400

USD/JPY

Completed a multiday bear configuration to extend the underlying downtrend. 83.58 has been reached so far, ahead of the current corrective bounce which should precede a fresh push lower to test key trendline support at 83.25.

Res: 84.87, 85.11, 85.42, 85.68

Sup: 84.50, 84.04, 83.58, 83.25

USD/CHF

Probes lower to breach previous 1.0257 low, following reversal after an upside failure ahead of key 1.0463, 19 Aug lower high. Risk is set at 1.0230, ahead of this year’s interim low at 1.0130. Immediate resistance now stands at 1.0327/35.

Res: 1.0327, 1.0335, 1.0380, 1.0400

Sup: 1.0230, 1.0182, 1.0162, 1.0130

Market Analysis by www.windsorbrokers.com

Forex Daily Market Review Aug 26, 2010

By eToro – A combination of a better than expected German IFO report
(106.7 compared to the expected 105.7) and an increase in
an appetite for US equities pushed the Euro up on the day,
as it reclaimed the 1.27 level. The Euro is still on the defensive
and will likely test 1.25 level.

Click here to read the full review

Forex Market Analysis provided by eToro

Disclaimer: Trading in the Foreign Exchange market might carry potential rewards, but also potential risks. You must be aware of the risks and are willing to accept them in order to trade in the foreign exchange market. Don’t trade with money you can’t afford to lose.

Yen and Franc to Continue to Strengthen

By Russell Glaser – Traders are waiting for signs of intervention from the Swiss National Bank (SNB) or the Bank of Japan (BOJ) to halt the appreciation of the Swiss franc and the Japanese yen. Until the central banks take action in the open markets, continued strengthening of the currencies should prevail.

Today’s leading economic releases:

USD – Unemployment Claims -12:30 GMT

Weak unemployment continues to drag on the U.S. economy. The past 3 releases have been higher than the expected outcome. This week’s data should be no exception.
Expected: 488K. Previous: 500K.

USD – Jackson Hole Symposium – All Day

U.S. central bankers will gather in Jackson Hole, Wyoming, to discuss the state of the U.S. economy, monetary policy, and inflation. Developments that come from the meeting may shed light on the Fed’s next plan of action for the U.S. economy and monetary policy.

• Support and resistance for the EUR/USD are found at the levels of 1.2470 and 1.2730.

• Until the Swiss National Bank (SNB) intervenes in the open market, the bullish trend for the franc should continue and the USD/CHF will target the 2010 low at 1.0125.

Forex Market Analysis provided by ForexYard.

© 2006 by FxYard Ltd

Disclaimer: Trading Foreign Exchange carries a high level of risk and may not be suitable for all investors. There is a possibility that you could sustain a loss of all of your investment and therefore you should not invest money that you cannot afford to lose. You should be aware of all the risks associated with Foreign Exchange trading.

Yen Reaches 15-Year Low

Source: ForexYard

Volatility was high today as the Japanese yen fell to its lowest level in the past 15 years. This has taken place as traders test the resolve of the Japanese government not to intervene in the currency markets to prevent a consistent rise in the value of the yen.

Economic News

USD – Dollar Trades Sideways

The US dollar was mixed today versus the majors, rising against the yen but falling versus the British pound and the Swiss franc. Traders are anticipating market intervention from both the Japanese and the Swiss central banks following the sharp appreciation of the yen and the franc.

The EUR/USD traded near its opening price of 1.2655. The GBP/USD was higher at 1.5480, from an opening day price of 1.5429. The USD/CHF was lower at 1.0300, after opening the day at 1.0315.

Highlighting the volatility in yesterday’s trading was the movement of the Dow Jones Industrials Average. The Dow was down by more than 100 points after global bourses were lower. Disappointing US data also sank traders’ sentiment following the release of core durable goods orders, which fell 3.8% on expectations of a rise of 0.6%. Poor housing numbers were also released as new home sales recorded only 276K on expectations of 333K. However, the Dow came back and by the end of the day closed up 0.2%.

Today traders will be following US weekly unemployment claims that are expected to post 488K new applications for unemployment benefits. Also on the calendar is the Federal Reserve’s Jackson Hole Symposium. The yearly meeting of central bankers may provide a forum for further debate of US monetary policy, including when to raise US interest rates that remain close to 0%. Support and resistance for the EUR/USD are found at the levels of 1.2470 and 1.2730.

EUR – When Will the SNB Intervene on Behalf of the Franc?

Traders are waiting for intervention from the Swiss National Bank (SNB) to halt the appreciation of the franc versus the euro.

The Swiss franc (CHF) continues to strengthen as the currency is typically used as a safe haven in times of economic stress. Yesterday the franc rose following disappointing US new home sales numbers and weak US core durable goods orders. The franc is currently trading at a high versus the dollar since January and a new all time high versus the euro.

To counter the rapid appreciation of the franc, traders are watching for signs that the SNB will begin selling francs to halt the rise of the currency. As of now, the SNB has not intervened. This has allowed traders to push the Swiss franc to new highs versus the dollar and the euro. Until the SNB intervenes, the bullish trend for the franc should continue, and the USD/CHF will target the 2010 low of 1.0125.

JPY – When Will the Bank of Japan Intervene on Behalf of the Yen?

Yesterday the yen found some relief from the appreciation the Japanese currency has experienced versus the dollar and the euro. But this should only be a temporary pause in the appreciation of the yen as the Bank of Japan inches closer to intervention in the foreign exchange markets.

The USD/JPY rose to 84.64, from an opening day price of 84.38. The EUR/JPY was also higher at 107.20, after opening yesterday’s trading at 106.79.

The Bank of Japan (BOJ) continues to ramp up its rhetoric for intervention in the currency markets. Finance minister Yoshihiko Noda is beginning to lose his credibility in his attempts to talk the yen down. As the verbal intervention appears to be failing, the BOJ is inching closer to actual intervention in the market or other possible steps of a monetary policy easing which would be considered a step of last resort to weaken the yen.

Crude Oil – Crude Oil Rises Despite Negative Inventory Data

The price of spot crude oil rose today despite sluggish equity markets and rising crude oil inventories. Crude oil prices finished higher on the day at $72.75, from an opening day price of $71.88.

The US Energy Information Administration released its weekly crude oil inventory level report that showed crude oil inventories rose 4.1M barrels. Market expectations were for a rise of only 0.1M barrels.

The rise in the price of spot crude oil was the first significant gain the price has made in the last 17 trading days. This sudden appreciation caught the market off guard going against the downward trend. Also adding to the confusion was the large rise in inventories, another sign that demand has yet to pick up.

The next support and resistance levels for spot crude oil trading are $70.75 and $74.15.

Technical News

EUR/USD

Many indicators on this pair appear to be floating in neutral territory, but the direction of these indicators all point upwards. The price has just left the over-sold territory on the daily RSI, suggesting that we may see upward momentum gaining in the days ahead. Going long may be preferable today.

GBP/USD

This pair seems poised for a steady downward movement. The hourly and weekly RSI has the price in the over-bought territory, highlighting downward pressure. The Stochastic (slow) on the hourly, 4-hour, and weekly charts all show fresh or impending bearish crosses. Going short may be wise today.

USD/JPY

Technically speaking we should expect to see upward corrections to the sustained downward movement we see on the USD/JPY. However, the technical evidence for such a move is lacking. Almost all indications are neutral, and the few which are not neutral are indeed showing a potential for further downward movement. For example, the 4-hour Stochastic (slow) currently shows a fresh bearish cross. It appears as if staying with the downtrend is the best choice in today’s trading.

USD/CHF

The price of this pair appears to have pushed the RSI of the 4-hour and weekly charts into the over-sold territory, suggesting upward pressure. A recent bullish cross on the weekly Stochastic (slow) supports this notion. Going long with tight stops could be a wise tactic today.

The Wild Card

CAD/CHF

The sharp downturn in this pair has resulted, at last, in the technical indicators showing potential for a correction. The 4-hour, daily and weekly RSIs all float in the over-sold territory and just recently a bullish cross formed on the daily Stochastic (slow). All of this evidence points towards a beneficial opportunity for forex traders looking for a great opening price at the low point of a movement. Going long on this pair now seems to have the most potential for profits today.

Forex Market Analysis provided by ForexYard.

© 2006 by FxYard Ltd

Disclaimer: Trading Foreign Exchange carries a high level of risk and may not be suitable for all investors. There is a possibility that you could sustain a loss of all of your investment and therefore you should not invest money that you cannot afford to lose. You should be aware of all the risks associated with Foreign Exchange trading.

Platinum Flag Formation Foreshadows Sharp Drop

printprofile

I’m going to make a prediction here, then explain why I assume this. My prediction is this: Platinum prices are currently testing the lower boundary of a flat channel and, due to a number of factors which will be explained, the price is forecast to climb higher, with target prices at $1,565 and $1,600. However, upon reaching these price targets, we may expect a sharp decline in price, below the lower border of the flat channel.

Here’s why I make this forecast. First, as stated, the price is trading within a flat range with clear highs and lows, drawn in red lines on the chart (see below). It’s clear to see that the price is also moving upward at the moment, which supports this notion.

Second, the Fibonacci lines drawn on the chart demonstrate that the 23.6% support line (near $1,520 an ounce) has proven difficult for the price to breach. This level appears to represent one of the strongest psychological support lines for this commodity, and seems to highlight the fact that this commodity’s minimum accepted price by investors is around $1,500. For a variety of reasons, traders simply won’t allow the price to fall below that price.

Third, both of our oscillators – the RSI and Stochastic (slow) – agree with an upward movement. When the price fell towards $1,500, the RSI entered the over-sold territory and is now mirroring the price’s movements upward; which also suggests that momentum is building in an upward direction. The Stochastic (slow) has also recently touched the over-sold region and crossed the averages, representing a bullish cross. All of this together supports the idea of an upward move towards $1,565 an ounce, or possibly higher.

Platinum – Daily Chart
Platinum - daily

But don’t forget that I also said there is an expected sharp drop following the success of reaching this higher target. This is where I want to draw your attention to the long, sharp drop in price which occurred in May. We can call this sharp drop a flagpole, since it appears to have created the conditions for a flag formation.

Flags are precisely what you see above: a flat channel following a sharp movement. Channels are usually confirmed when three tops/bottoms have successfully formed. This verifies the trend. We can see above that we have two tops/bottoms, so we should expect to see one more, which indeed appears to be forming right now. Once the flag formation/channel has been confirmed, 9 times out of 10 we would then see the flag come to an end and the previous direction (i.e. the direction of the flagpole) continue. So, if I’m right, the price should climb towards $1,565, and perhaps even $1,600, after which the price may drop sharply, roughly the same size as the previous flagpole (meaning a price around $1,300).

So that concludes the analysis on Platinum, but before I end I want to provide a parallel with the EUR/USD. As I’m sure we’re all aware, commodities are priced in USD. This means that the EUR/USD typically provides similar movements to commodity prices.

Here is the EUR/USD daily chart with the same Fibonacci lines and oscillators.

EUR/USD – Daily Chart
EURUSD - Daily Chart

The EUR/USD is currently consolidating towards 1.3000. The market has been fluctuating back and forth between risk appetite and risk aversion. This has created the consolidation pattern you see in this chart above. As you can see from the red lines drawn, the price has just touched the lower border of this trend (which is also a significant support level on the Fibonacci) and then bounced off. It is now ascending towards the upper border with a target around 1.3200, after which it will likely descend back towards roughly 1.2800.

As you may have assumed, a rising EUR/USD represents a declining USD, which also supports the idea of rising commodity prices (since they would be getting cheaper). Additionally, if the price of the EUR/USD does hit 1.3200 and then declines, this would mirror the same movement in Platinum prices once they reached $1,565, or $1,600.

More on the EUR/USD: after a consolidation trend like that seen above finishes, it is usually followed by a sharp movement, but the direction is traditionally unclear, at least from a technical standpoint. This gives us the unique opportunity to also use Platinum prices to predict the direction of the sharp movement of the EUR/USD after it consolidates at 1.3000. We know from the “flag formation” on Platinum that a downward movement is expected, at least from a technical point of view. This also means that after the consolidation point is reached on the EUR/USD that a strengthening dollar is being forecast, and the EUR/USD may drop towards 1.2300 or even 1.2200.

Let’s do a quick recap to finish:

1) I’m predicting that Platinum prices are going to rise, then fall sharply after hitting $1,565, or $1,600.
2) Technical oscillators like the RSI and Stochastic (slow) support this notion.
3) There is a flag formation on Platinum which supports the idea that prices will fall sharply after climbing towards the aforementioned targets.
4) The EUR/USD is also consolidating and is currently expected to move higher, which makes commodity prices rise from being cheaper in USD.
5) The EUR/USD may drop sharply towards 1.2300 or lower after it consolidates around 1.3000, due to what we can predict from the Platinum flag formation.

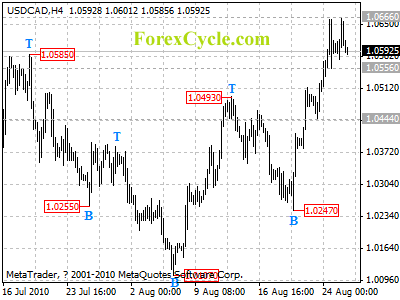
USDCAD formed a minor consolidation

Being contained by 1.0676 (Jul 6 high) resistance, USDCAD formed a minor consolidation in a range between 1.0556 and 1.0666. Key support is at 1.0556, as long as this level holds, uptrend could be expected to continue and further rise to 1.0750 is still possible after consolidation. However, a breakdown below 1.0556 will indicate that a cycle top has been from at 1.0666 level on 4-hour chart, then pullback towards 1.0400 could be seen.

usdcad

Daily Forex Analysis

DIY Forex Trading School

By Warren Seah – Is it possible to teach yourself forex trading? This is a guide about teaching beginners how to trade the forex market. Welcome to the DIY Forex Trading School!

Step 1 Learn About the Psychology to Trading

The key to trading successfully in the forex market a lot depends on how you handle after a loss. It is how you dealt with the loss of money that differentiates between a novice trader and a professional trader.

Trading is managing the two components of our human emotions – the fear and greed. Understanding these two human emotions is very important because the market is human driven. This will mean to a certain extent, based on greed and fear, a person will be able to predict with some accuracy on how the market performs.

Step 2 Trade with a Plan

It is important that one person understands how many types of market condition are there. There are three market conditions, trending, ranging and consolidation. Having understands the different market conditions, it should be decided by the traders what strategies will perform the best in the current conditions.

As market conditions are constantly changing, a trader must possess a sound idea of the various investment strategies and adapting to the fast changing financial markets.

It is a common saying- if you fail to plan, you plan to fail. Even though you have a plan, it does not mean you will win all the time but if you fail to plan, it is guaranteed that you will lose in the long term. Trading is after all a probability games. Having a plan before you start trading increase your probability to win.

A trading plan consists of five components. These five components will be discussed in my other articles. Trading plan seeks to conquer and eliminate trading with human emotions. It encourages trading in a logical and systematic way without the two human emotions.

Step 3 Minimise Risk With Proper Money Management

Even with a plan, a trader will still fail if he does not follow a strict money management. A sound money management will restrict the money loss up to certain predefined level so that any loss incurred will not ever bring the trader out of business.

Trading the market is about surviving the market today so that you can come back to trade tomorrow, isn’t it? As long as you have the money, the market will present plenty of opportunities for you. However, if you lose all your money in any single trade, you cannot capitalise on future opportunities anymore.

A general guide will be to risk not more than 2% of your equity in any single trade. And 6% of account equity is the maximum amount of risk you undertake in any single month. Abiding by these two rules will ensure you stay in the market for as long as you can regardless of how much you have in your account.

Step 4 Repeat step 1 to 4 with discipline and never give up.

Trade consistently and have a good record keeping for trading assessment later. Never attempt to change the plan while you are trading. Stick to the plan and trade with a demo account until you are very confident with the trading strategy.

Step 5 Trading Assessment and Optimisation

Review and make improvements to your trading plan after trading for 3 months or 200 executed trades whichever comes first. This is to ensure that the result of trading is reliable based from results obtained from large no of trades.

One of the mistakes that many traders makes is that they make changes to a trading plan over a short period of time without giving the plan enough time to show its facts. This is because every systems will have its losing cycle and profiting cycle.

Look forward to more guides from DIY Forex Trading School. And it is always handy to get a few good trading books from the book stores to learn the basics about forex trading. This guide is designed in a simple and easy way and intended to provide practical insights to learning forex trading. Hence, certain information about the forex market are not covered.

About the Author

Warren Seah – Warren examines commercial trading systems and has since started researching and analysing systems to uncover good systems which bring in consistent profits.

Click Here For More Guides On Forex Trading School

http://www.FxEAReview.com

FOREX: Durable Goods rise, New Home Sales fall to new record low. Dollar mixed in Fx Trade.

By CountingPips.com

Economic news out of the US today showed that new orders for durable goods increased by less than expected while new home sales fell to the lowest level on record in the month of July. New orders for durable goods, products manufactured in the U.S. and considered to last more than three years, edged higher by 0.3 percent in July to a total of $193.0 billion. This follows a 0.1 percent decrease in orders for June, according to the data released by the U.S. Commerce Department. July’s advance reverses two consecutive months of decreases in May and June.

Market forecasts had been expecting that durable goods orders would advance by approximately 3.0 percent for the month.

New orders for durable goods, excluding transportation, decreased unexpectedly by 3.8 percent in July following an increase of 0.2 percent in June. This data was worse than the market forecasts which were predicting an increase of 0.5 percent for durables minus transportation.

New Home Sales decline to a new low

New Home Sales in the United States decreased more than expected and registered a new record low level, according to a separate report released by the Department of Commerce today. Purchases of new single family homes fell by 12.4 percent  in July to an annual rate of 276,000 new homes sold. The July data brings new home sales to the lowest level on record since the government started keeping records in 1963.

Market forecasters were expecting no change in the monthly sales level for an annual rate of 330,000 new homes sold following a 12.1 percent increase in June. On an annual basis, July’s rate of new homes sold was 32.4 percent lower than the July 2009 sales level.

Leading the decrease in July was a 25.4 percent drop in new homes sold in the the West while the Northeast registered a 13.9 percent decline in sales. Sales in the South fell by 8.7 percent while the Midwest saw a decrease by 8.3 percent from June to July. On an annual basis, all four regions had declines of more than 20 percent from the July 2009 period with the West showing the largest decrease by 54.6 percent over that time.

FOREX: US Dollar is mixed in foreign exchange trading

The U.S. dollar has been trading mixed in the forex markets against the other major currencies following the US economic releases today. The dollar has advanced today versus the Japanese yen and the New Zealand dollar while trading lower against the euro and the British pound sterling. The Swiss franc, Australian dollar and Canadian dollar are all trading close to unchanged against the American currency near the end of the US trading session.

The U.S. stock markets, meanwhile, ended on a positive note today with the Dow Jones increasing by approximately 19.61 points, the Nasdaq rising by 17.78 points and the S&P 500 up by 3.46 points.  Oil increased by $1.10 to $72.73 while gold advanced by $8.40 to trade at the the $1240.10 per ounce level.

Tomorrow’s economic schedule includes the Australian conference Board leading index, the Switzerland employment level for the second quarter and the US weekly initial jobless claims.

8 Trading Habits From Warren Buffett

By Warren Seah – Dos and Don’t For Trading the Forex Market – Wisdom From Warren Buffett

1. Investing With Knowledge

Don’t do anything until you know what you are doing. – Jimmy Rogers

Do

The knowledge in this context doesn’t mean you need an educational degree in finance and economics to invest in the markets. It means learning about the potential markets you are interested to invest in. Knowing and understand them before you put money into the markets.

Don’t

Doesn’t realise that a deep understanding of what he is doing is an essential prerequisite to success. Rarely realizes that profitable opportunities exist within his own area of expertise.

2. Predefined Trading Plan

The secret is for a trader to develop a system with which he is compatible. – Ed Seykota

Do

Has developed his own investment philosophy which is suited to his own personalities and objectives. As a result, no two investors in the market trade in the same manner.

Don’t

Has no plan, uses other people’s system without own’s research. Do not have his own investment philosophy. What it happen is that you see the person change from one systems to another, and failing to understand the importance of writing a plan.

3. Researched And Tested Strategy

If I’m interested company, I’ll buy 100 shares of all its competitors to get their annual reports. – Warren Buffett

Do

Developed and tested one’s strategy for the pass 5 to 10 years to determine the viability of the systems. Characteristics of the systems are also understood before one put real money into investment strategy.

Don’t

Has no system. Or has adopted someone’s else’s without testing and adapting it to his own personality. (When such a system doesn’t work, he adopts another one blindly. Which doesn’t work for him either.)

4. Capital Preservation

If you don’t bet, you can’t win. If you lose all your chips, you can’t bet. – Larry Hite

Dos

First priority is to ensure your investment equity can survive and invest for another day. The market will always be there as long as your investment equity is available. If you protect your money and make it the number one priority in investment, you can survive long enough in the market to profit from the opportunities.

Don’t

Investment aim is “to make a lot of money.” As a result, failed to keep them.

5. Follow His Investment Plan

For me, it’s important to be loyal to my system. When I’m not… I’ve made a mistake. – Gil Bake

Do

Stick to his rules with discipline as long as its within the boundaries stated in his system plan. The fact is most investments do not win all the time. As investors, we need to be aware that there is drawdown period for any investment strategy.

Don’t

Lack of discipline to follow the rules as layout in the trading plan. (When such a system doesn’t work, he adopts another one. Which doesn’t work for him either.)

6. Learn From Mistakes

One learns the most from mistakes, not successes. – Paul Tudor Jones

Do

Always treats mistakes as opportunities to improve oneself and never commit the same mistake again. An investor will never stop learning.

Don’t

Blame, justify and give excuses about the systems, people or circumstances that are at fault. While overlooking that he can improve his trading results if he identified them as mistakes and learn from them.

7. Almost Never Talks to Anyone About What He is Doing

My idea of a group decision is to look in the mirror. – Warren Buffett

Do

Not concern about what he’s doing. Not interested or concerned with what others think about his investment decisions.

Don’t

Always asking for people’s opinions and finding the latest ‘Hot Tip’

8. Be a Risk Averse Investors

Do

Believe that risk can be managed, and always be prepared to beat a hasty retreat.

Don’t

Thinks that big profits can only be made by taking big risks.

About the Author

Warren Seah – Warren examines commercial trading systems and has since started researching and analysing systems to uncover good systems which bring in consistent profits.

Click Here To Read More On Auto Forex System Reviews

http://www.FxEAReview.com