Gold Tops and Declines

Gold has topped out and is trading back around $1130/oz following the precious metal’s solid topside breakout.  Gold is heading lower following a negative reaction to U.S. data revealing a large decline in Pending Home Sales.  Today’s discouraging U.S. housing figure sent investors towards the Dollar for safety, knocking the risk trade and dragging gold lower with it.  The precious metal was outperforming lately despite the Dollar’s strength.  However, gold is playing along today and some profit taking isn’t surprising since the precious metal was getting awfully close to its psychological $1150/oz level and previous 2010 highs.  Meanwhile, the markets could end the trading session on a volatile note with an important EU meeting tomorrow followed by key U.S. employment data.  The U.S. will release its Non-Farm Employment Change and headline Unemployment Rate figures.  Although the ADP printed about in line with expectations on Wednesday, the advance number has been known to be somewhat unreliable in the past.  Therefore, investors should keep an eye on the Dollar’s reaction to tomorrow’s news and data events.

Technically speaking, we’ve formed two new makeshift downtrend lines running through 3/3 levels to give investors an idea of present resistance.  Gold is still well above downtrend lines running through 2/19 and 1/11 highs, meaning there aren’t any foreseeable noteworthy downtrend lines in play right now.  As for the downside, gold has multiple uptrend lines serving as technical cushions along with 3/2 lows.  Additionally, the highly psychological $1100/oz level could serve as a reliable technical cushions should it be tested.

Present Price: $1128.95/oz

Resistances: $1131.07/oz, $1134.88/oz, $1138.68/oz, $1140.96/ oz, $1143.46/oz, $1146.29/oz

Supports: $1126.71/oz, $1123.03/oz, $1120.42/oz, $1117.76/oz, $1114.72/oz, $1110.53/oz

Psychological: $1100/oz, $1125/oz, $1150/oz, January Highs, March Lows

(click to enlarge)

Market Commentary provided by Fast Brokers.

Disclaimer: FastBrokers’ market commentary is provided for information purposes only and under no circumstances should be regardedneither as an investment advice nor as a solicitation or an offer to sell/buy any financial product. FastBrokers assumes no responsibility or liability from gains or losses incurred by the information herein contained.

Risk Disclosure: There is a substantial risk of loss in trading futures and foreign exchange. Please carefully review all risk disclosure documents before opening an account as these financial instruments are not appropriate for all investors.

USD/JPY Surges After Days of Steady Decline

The USD/JPY is experiencing a large topside movement during the U.S trading session following yesterday’s sizable pullback in the currency pair.  There are presently no visible headlines giving a concrete reason for the Yen’s relative weakness.  However, there is something at work right now considering the extent of the Yen’s pullback.  Perhaps oversold conditions are driving the USD/JPY higher, though the gains seem a bit abrupt to be derived from oversold factors.  Hence, investors should keep an eye on the news wire for information detailing the Yen’s weakness.  Meanwhile, we are witnessing broad based strength in the Dollar following disappointing U.S. Pending Home Sales data.  Although Japan will be quiet on the data wire tomorrow, the U.S. will release Non-Farm Employment Change and headline Unemployment Rate figures.  Hence, the FX markets could end the trading week on a volatile note.

Technically speaking, today’s recovery is a welcome development considering the extent of the USD/JPY’s decline over the past week or so.  In fact, the USD/JPY almost tested 88 before jolting back up above 89.  However, downward pressure does remain on the currency pair since the BoJ and DPJ are still in disagreement over the necessity of additional liquidity injections.  The USD/JPY still faces multiple downtrend lines along with previous March highs and the highly psychological 90 level.  As for the downside, the USD/JPY does have multiple uptrend lines serving as technical cushions along with 3/2 and 3/3 lows.  Additionally, the psychological 90 level could have an influential role over near-term price action.

Present Price: 89.11

Resistances: 89.14, 89.19, 89.28, 89.35, 89.41, 89.50

Supports: 89.04, 88.93, 88.84, 88.78, 88.71, 88.64, 88.57

Psychological: 90, 89, March highs and lows

(click to enlarge)

Market Commentary provided by Fast Brokers.

Disclaimer: FastBrokers’ market commentary is provided for information purposes only and under no circumstances should be regardedneither as an investment advice nor as a solicitation or an offer to sell/buy any financial product. FastBrokers assumes no responsibility or liability from gains or losses incurred by the information herein contained.

Risk Disclosure: There is a substantial risk of loss in trading futures and foreign exchange. Please carefully review all risk disclosure documents before opening an account as these financial instruments are not appropriate for all investors.

GBP/USD Consolidates Above 1.50

The Cable is holding strong above it highly psychological level following solid gains yesterday.  UK Services PMI came in much stronger than analyst expectations and registered the highest reading since February 2007.  The recovery in services is exactly what the doctor ordered since the UK is a service-oriented economy.  The Cable also derived strength from a positive reaction to Greece’s new austerity measures.  However, today’s UK HPI number registered a surprising decline, dipping 1.5%, the largest decline since May 2009.  Hence, yesterday’s optimism has been dampened by discouraging housing data.  Speaking of which, U.S. Pending Home Sales just printed much lower than analyst expectations, sending the Dollar higher as investors divest from the risk trade.  Meanwhile, the UK’s BoE meeting came to an uneventful conclusion.  The central bank opted to keep its policy unchanged despite some speculation that they might increase QE funding.  Although, the BoE did leave the door open for more liquidity should conditions warrant action.  It seems the central bank is content with playing it safe before elections considering the reaction we saw in the Pound on Monday after polls revealed a tight race.  The UK will release PPI data tomorrow and investors are expecting a flat reading.  It will be interesting how producer prices fair considering how hot CPI was last month.  Investors will also focus on the U.S. with the release of Non-Farm Employment Change and the headline Unemployment Rate.  However, a negative reading may not have too extreme of an impact since investors expect harsh winter weather may have curtailed hiring.  Regardless, U.S. employment data always has the potential to move FX markets, so investors should keep a close eye on tomorrow’s data wire.

Technically speaking, the Cable has our 1st and 2nd tier uptrend lines serving as technical cushions along with intraday and 3/3 lows.  Additionally, the psychological .150 level could work in the Cable’s favor shout it be retested.  As for the topside, the Cable faces multiple downtrend lines.  Our top tier downtrend line does run through 2/26 highs, meaning a breakout could yield substantial near-term gains should fundamental and psychological factors work in the Cable’s favor.

Present Price: 1.5078

Resistances: 1.5091, 1.5112, 1.5131, 1.5153, 1.5170, 1.5182

Supports: 1.5065, 1.5040, 1.5013, 1.4994, 1.4975

Psychological: 1.50, March lows

(click to enlarge)

Market Commentary provided by Fast Brokers.

Disclaimer: FastBrokers’ market commentary is provided for information purposes only and under no circumstances should be regardedneither as an investment advice nor as a solicitation or an offer to sell/buy any financial product. FastBrokers assumes no responsibility or liability from gains or losses incurred by the information herein contained.

Risk Disclosure: There is a substantial risk of loss in trading futures and foreign exchange. Please carefully review all risk disclosure documents before opening an account as these financial instruments are not appropriate for all investors.

EUR/USD Weakens Following ECB Decision

The EUR/USD is trading off of intraday highs after the ECB kept its benchmark intact and tightened some alternative liquidity measures as expected.  Trichet also added that the ECB feels an IMF intervention to help Greece would be unwise.  Speaking of Greece, citizens are protesting again, this time occupying a governmental financial building.  Today’s protests come a day after Greece announced further austerity measures to pacify other EU members.  Markets greeted Greece’s new austerity measures positively by sending the EUR/USD a leg higher.  However, uncertainties remain in Greece, particularly how citizens well handle the deep budget cuts coming into effect.  Additionally, there remains the possibility of similar debt issues popping up in Italy, Spain, and Portugal.  Regardless, yesterday’s rally in the EUR/USD was encouraging, and the currency pair continues to consolidate above its highly psychological 1.35 area.  Meanwhile, investors are awaiting U.S. Pending Home Sales and Factory Orders data.  U.S. weekly Unemployment Claims printed a bit stronger than anticipated and productivity remains at a heightened level.  The EU was quiet on the data wire today, leaving the ECB in the spotlight.  Although the EU will release German Factory Orders data tomorrow, investors will likely focus on the U.S. with the release of Non-Farm Employment Change data along with the headline Unemployment Rate.  The ADP number printed near expectations yesterday, though the advanced number has a reputation of being somewhat unreliable.  That being said, the FX markets could end the trading week on a volatile note.

Technically speaking, the EUR/USD faces multiple downtrend lines along with 3/3and 2/17 highs.  As for the downside, the EUR/USD has several uptrend lines serving as technical cushions along with 3/3, 2/26, and 3/1 lows.  Meanwhile, the psychological 1.35 area could continue to have an impact on price movements.

Present Price: 1.3632

Resistances: 1.3641, 1.3654, 1.3676, 1.3694, 1.3709, 1.3724, 1.3737

Supports:  1.3619, 1.3606, 1.3589, 1.3574, 1.3557, 1.3542

Psychological: March Lows, 1.35

(click to enlarge)

Market Commentary provided by Fast Brokers.

Disclaimer: FastBrokers’ market commentary is provided for information purposes only and under no circumstances should be regardedneither as an investment advice nor as a solicitation or an offer to sell/buy any financial product. FastBrokers assumes no responsibility or liability from gains or losses incurred by the information herein contained.

Risk Disclosure: There is a substantial risk of loss in trading futures and foreign exchange. Please carefully review all risk disclosure documents before opening an account as these financial instruments are not appropriate for all investors.

Stock Trading: The Line Is Drawn In the Sand In the Equity Markets

By Adam Hewison – To many technicians, it is very clear where the equity markets will reverse, and for those folks who don’t follow the technicals, this is a key reversal area in the S&P 500, the NASDAQ, and the Dow.

In my new short video I show you the exact levels that I think will reverse this market, if in fact it’s ever going to reverse to the downside.

Currently the major trend remains positive for all the indices and we would only become negative on the these markets should the key levels I show you  today, are broken.

See the New Video Here…

As always our videos are free to watch and there are no registration requirements. I would really like to hear back from you with regards to your thoughts on this video.

Your comments are welcome on our blog.
All the best,

Adam Hewison
President, INO.com
Co-creator, MarketClub

EUR/GBP on Course for Bearish Correction

By Anton Eljwizat – The sustained upward movement of the EUR/GBP pair doesn’t seem to be receiving much resistance lately. As I will demonstrate below, the price of EUR/GBP may very well be heading for a correction, and it might have the potential of reaching towards 0.8995 in the coming days. Forex traders can take advantage of this imminent downward movement by entering short positions at an excellent entry price.

• The chart below is the daily EUR/GBP chart by ForexYard.

• The technical indicators that are used are the Relative Strength Index (RSI), Slow Stochastic and MACD.

• Point 1: There is a “doji” candlestick formed in the chart, indicating that a reversal should take place.

• Point 2: The Relative Strength Index (RSI) indicates that the price of this cross currently floats in the overbought territory, signaling downward pressure.

• Point 3: The Slow Stochastic indicates a bearish cross, signaling that the next move may be in a downward direction.

• Point 4: The MACD signals a bearish course for the pair is imminent, as the MACD oscillator is set to go reverse course anytime soon.

EUR/GBP Daily Chart

Forex Market Analysis provided by Forex Yard.

© 2006 by FxYard Ltd

Disclaimer: Trading Foreign Exchange carries a high level of risk and may not be suitable for all investors. There is a possibility that you could sustain a loss of all of your investment and therefore you should not invest money that you cannot afford to lose. You should be aware of all the risks associated with Foreign Exchange trading.

Australian Economy Grows at a Faster than Expected Rate in the 4th Quarter

By Ashley Smith – Australia’s economy grew at a faster than expected rate last quarter, climbing 0.9% from the 3rd quarter. The better than expected result help solidify the notion that the Australian economic recovery is sustainable, underscoring the central bank’s decision yesterday to boost interest rates for the 4th time to 4.00%.

The GDP figures lend support to the central bank’s decision to raise interest rate as evidence mount that the monetary stimulus is no longer required, boosting expectations that a continuation of tightening of the monetary policy is expected. Faster than anticipated growth was key reason policy makers increased the overnight cash rate target to 4 % yesterday while signaling for a possibility of further future hikes.

The Australian Dollar traded near its strongest level in a decade against the New Zealand Dollar as Australian economic growth proves to be much stronger than that of New Zealand. Australia’s currency traded at NZ$1.3037 from NZ$1.2980 yesterday. The Aussie rose to 90.58 U.S. cents after touching 90.84 cents, the highest since Feb. 23. The currency was little changed at 80.05 Yen.

Forex Market Analysis provided by Forex Yard.

© 2006 by FxYard Ltd

Disclaimer: Trading Foreign Exchange carries a high level of risk and may not be suitable for all investors. There is a possibility that you could sustain a loss of all of your investment and therefore you should not invest money that you cannot afford to lose. You should be aware of all the risks associated with Foreign Exchange trading.

Dollar Falls vs. EUR on Positive ISM Data

Source: ForexYard

The U.S. dollar traded lower Wednesday as investors moved to higher-yielding currencies and riskier assets after U.S. data was better than expected. ISM service data showed the U.S. services sector grew in February at its fastest pace in more than 2 years, reducing the appeal of the greenback as a relatively safe investment.

Economic News

USD – Dollar Pulls Back on Greek Cuts

The U.S. dollar dropped versus the EUR and other major currencies Wednesday as Greece outlined tax changes and budget cuts to help reduce its deficit, easing concerns about a debt-fueled crisis and reducing the relative appeal of the U.S. currency.

The Dollar also turned lower versus the Japanese currency, slipping 0.4% to buy 88.47 yen. The U.S dollar may fall for a 3rd day against the JPY on speculation job losses in the U.S. will encourage the Fed to keep borrowing costs unchanged.

The USD fell for a 2nd day against the EUR as traders increased bets the Federal Reserve will keep its target interest rate near zero to sustain a recovery in the world’s biggest economy. The U.S. currency weakened after Fed Bank of Dallas President Richard Fisher said borrowing costs should remain low until the economy picks up, which won’t happen for some time.

EUR – The EUR at 2 Week High as Greece Debt Concern Ease

The EUR was firmer on Thursday, as investors encouraged by Greece’s fresh austerity measures to reduce its deficit cut some of the record short positions in the single currency. Greece announced plans for a further $6.5 billion in pay cuts and tax hikes to reduce its deficit, easing worries about the country’s debt crisis.

The European currency traded near a 2 week high against the U.S dollar on easing concerns the European Union’s biggest budget gap will derail a regional recovery after Greece announced tax increases and deeper spending cuts. The EUR traded at $1.3703 from $1.3697 yesterday when it reached $1.3736, the strongest since Feb. 17

However, gains in the EUR were tempered on speculation the European Central Bank will maintain credit easing measures at a policy meeting today. Economists expect the ECB to keep the benchmark rate at 1% as in previous months.

JPY – Yen Advances to 2 Month High vs. Dollar

The Japanese yen climbed against the U.S dollar amid speculation Japanese companies were buying the currency. The yen strengthened to 88.48 versus the U.S. currency, the highest level since Dec. 14, from 88.85 yesterday.

The Japanese currency rose to its highest in more than 2 months against the greenback on Wednesday as investors cut long positions versus other currencies. Investors fret about a stronger yen because it eats into exporter profits when repatriated.

OIL – Oil Trades above $80 on Economic Hopes

Crude oil prices gained more than 1% to close above $80 a barrel Wednesday, taking direction from a dropping U.S. dollar and data showing fewer U.S. job losses, which overshadowed a surprisingly high increase in crude-oil stockpiles. Wednesday marked the first day since Jan. 12 that the most active contract has hit $81 intraday, and the first day in a week that the contract has closed at or above the $80 level.

For the past several weeks, Crude prices have been unable to get much past $80 a barrel, hemmed in by concerns over supplies outstripping fragile demand. Weekly inventory data from the Energy Information Administration (EIA) did little to assuage those concerns. In keeping with a trend reported by industry group American Petroleum Institute late Tuesday, the EIA showed a bigger increase in crude-oil stockpiles than expected. Analysts said that with the fundamentals weak and consistent resistance above the $80 level, Oil may start to trade lower over the next few days.

Technical News

EUR/USD

The daily chart is showing mixed signals with its RSI fluctuating at the neutral territory. However, there is an impending bearish cross forming on the 4-hour chart’s MACD indicating a bearish correction might take place in the nearest future. When the downwards breach occurs, going short with tight stops appears to be preferable strategy.

GBP/USD

The GBP/USD has gone increasingly bullish in the past 2 days, and currently stands at the 1.5070 level. The daily chart’s RSI supports this currency cross to rise further today. However, the 4-hour chart’s Stochastic Slow signals that a bearish reversal might take place today. Entering the pair when the signs are clearer seems to be the wise choice today.

USD/JPY

The price of this pair appears to be floating in the over-sold territory on the 4-hour chart’s RSI indicating a downward correction may be imminent. The downward direction on the daily chart RSI also supports this notion. Going long might be a wise choice.

USD/CHF

The pair has been range-trading for a while now, with no specific direction. The Daily chart’s Slow Stochastic providing us with mixed signals. The 4 hour charts do not provide a clear direction as well. Waiting for a clearer sign on the hourlies chart might be a good strategy today.

The Wild Card

Silver

Silver prices rose significantly in the last week and peaked at $17.10 an ounce. However, the 8- charts’ RSI is floating in an overbought territory suggesting that a recent upwards trend is loosing steam and a bearish correction is impending. This might be a good opportunity for forex traders to enter the trend at a very early stage.

Forex Market Analysis provided by Forex Yard.

© 2006 by FxYard Ltd

Disclaimer: Trading Foreign Exchange carries a high level of risk and may not be suitable for all investors. There is a possibility that you could sustain a loss of all of your investment and therefore you should not invest money that you cannot afford to lose. You should be aware of all the risks associated with Foreign Exchange trading.

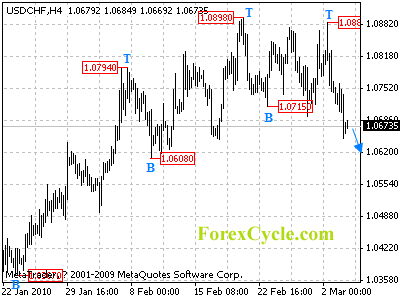
USDCHF’s fall extends to 1.0648

USDCHF’s fall from 1.0887 extends to as low as 1.0648. Deeper decline is expected later today and target is to test 1.0608 key support, a breakdown below this level could indicate that the uptrend from 1.0132 has completed at 1.0898 already. However, as long as 1.0608 support holds, the price action from 1.0898 is treated as consolidation of uptrend, another rise is still possible to 1.1000 area.

usdchf

Daily Forex Analysis

FOREX: US Dollar falls on risk. EUR/USD rises above 1.3700 today.

By CountingPips.com

The U.S. Dollar has fallen versus its global currency rivals so far today in forex trading as investor’s risk appetite has hit renewed levels. The dollar has been losing ground versus the euro, British pound, Swiss franc, Australian dollar, Canadian dollar and Japanese yen while gaining ground against the New Zealand dollar, according currency data by Oanda at 3:47 pm EST.

The euro has surged versus the dollar for the second straight day as the EUR/USD pair has extended to trading above the 1.3700 level. This pair touched a high of 1.3736 before pulling back and has traded at its highest exchange rate since February 17th. The euro has been helped out by news that Greece has pledged budget cuts and new taxes to help shore up some of its debt obligations.

The U.S. stock markets, meanwhile, have traded a bit lower today after a positive start with the Dow Jones down by 3 points, the Nasdaq decreasing over 1 point and the S&P 500 at about even at the time of writing.  Oil has climbed higher by $1.09 to trade at $80.77 while gold has gained by $5.80 to trade at the $1,142.70 per ounce level.

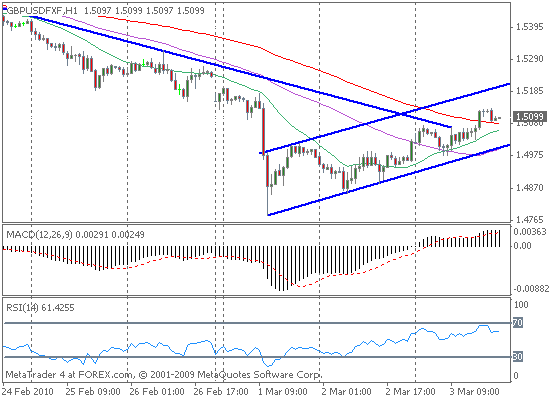
GBP/USD Chart – The British pound sterling has been gaining for a second consecutive day versus the American dollar as the GBP/USD has come off the 1.5000 psychological level to the upside to reach above 1.5100. The GBP/USD had fallen to a low point at 1.4784 on Monday due to concerns of a possible hung parliament emerging in the next election. This prompted speculation that a divided parliament could hamper Britain’s economic policy and growth.

Forex Trade, GBP/USD fx chart

U.S. Economic News: ADP Employment cuts 20k and ISM Service-Sector data rises

U.S. employment fell by 20,000 workers in January but marked the lowest monthly job decline in a year, according to the new ADP National Employment job report out today. U.S. nonfarm private employment fell by 20,000 workers in February following the revised decline of 60,000 jobs lost in January. The January jobs data was originally estimated to have fallen by 22,000 workers while February’s decline marks the 25th straight job declining month. Today’s data matched the 20,000 job decrease that market forecasters were expecting.

The employment data, despite the decrease, has improved in each of the last eleven months and today’s report marked the best monthly result since January of 2008 when the private sector added jobs.

The service-providing sector showed an increase of 17,000 jobs in February and increased for the second straight month. The goods-producing sector decreased by 37,000 jobs as construction jobs fell for the 37th straight month with a decline of 41,000 workers while the manufacturing sector had a gain of 3,000 jobs for the first rise since January 2008.

Medium sized businesses added jobs in February with an increase of 8,000 jobs. Large businesses lost 10,000 jobs in February and small businesses dropped 18,000 jobs.

The market-moving US Nonfarm Payrolls report for February is to be released Friday at 12:30 pm GMT with market forecasts predicting a decline of 30,000 jobs after January’s decrease of 20,000 jobs.

U.S. ISM Non-manufacturing Business expands

U.S. non-manufacturing business activity rose for the second straight month in February and increased to its highest level since December 2007, according to a report released today by the Institute for Supply Management.

The Non-manufacturing Index (NMI) registered a score of 53.0 percent in February from a score of 50.5 percent in January. Today’s data surpassed market forecasts which were expecting an index score of a 51.0 percent.

The NMI equally weights the index scores of business activity, new orders, supplier deliveries and employment and an index score below 50 is considered contracting or declining while a score above 50 is considered growth or expansion. Contributing positively to the report were increases in new orders, business activity/production, employment and supplier deliveries.