GBP/USD Charges Higher Amid Broad Dollar Depreciation

By Fast Brokers – The Cable has leapt past our 3rd tier downtrend line, and is trading just above the psychological 1.65 level as we witness a broad-based selloff of the Dollar.  We recognize similar, aggressive movements in both the EUR/USD and USD/JPY confirming investor distaste for the Greenback.  As we explained in today’s EUR/USD commentary, today’s volatility in the FX market is mostly based on concern that America’s massive injection of liquidity will ultimately result in a large depreciation of the Dollar as investors hedge against potential hyperinflation.  We believe the concern is a result of talks at the G20 summit.  Meanwhile, it’s widely known that gold has hit the highly psychological $1000/oz mark again.  The recent gold rush is likely a result of the same fear surrounding future inflation.  The multiple inflection points of our trend lines in both the GBP/USD and EUR/USD turned out to be a reliable sign for future volatility.  Investors are sending a resounding technical message regarding their preference for the uptrend following a season of summer doldrums.  Meanwhile, volatility should remain high as the week progresses considering we will receive a wealth of economic data from Britain, China, and the U.S. along with a monetary policy decision from the BOE on Thursday.

Despite today’s positive showing in Britain’s Manufacturing Production number, the GBP/USD’s gains may be capped from here on out as investors eagerly await Thursday’s BOE monetary policy decision.  The BOE has been proactive regarding its alternative liquidity package as policy makers try to stymie the immediate threat of deflation.  The BOE could remain in an aggressive monetary stance as they try to limit the Pound’s appreciation by injecting more liquidity so as not to derail the economic recovery taking root.  Either way, volatility may not peak until we receive Thursday’s wave of news and data.

The BOE’s recent injection of liquidity has surely impacted the GBP/USD.  While the EUR/USD has broken through August highs, the Cable’s August highs remain well out of reach.  Therefore, the GBP/USD has a more complicated path ahead if the currency pair opts to head higher over the near-term as we anticipate.  The first technical obstacles to the topside will be the psychological 1.65 level and the lid of the 8/13-8/21 trading range.  The GBP/USD should experience more exciting topside movements beyond these barriers.  As for the downside, the Cable has intraday lows and our 3rd tier downtrend line to fall back on.

Present Price: 1.6520

Resistances: 1.6552, 1.6570, 1.6593, 1.6611, 1.6635

Supports: 1.6520, 1.6498, 1.6478, 1.6460, 1.6442, 1.6417

Psychological: 1.65

Market Commentary provided by Fast Brokers.

Disclaimer: FastBrokers’ market commentary is provided for information purposes only and under no circumstances should be regardedneither as an investment advice nor as a solicitation or an offer to sell/buy any financial product. FastBrokers assumes no responsibility or liability from gains or losses incurred by the information herein contained.

Risk Disclosure: There is a substantial risk of loss in trading futures and foreign exchange. Please carefully review all risk disclosure documents before opening an account as these financial instruments are not appropriate for all investors.

EUR/USD Flies as FX Markets Come to Life

By Fast Brokers – The EUR/USD is screaming higher and we are witnessing the return to volatility forewarned by the multiple inflection points of our trend lines on both the EUR/USD and GBP/USD. Investors started the fall with the bang and we may finally be The Dollar is depreciating swiftly across the board as investors react to the surge in gold and a wave of statements predicting a large, medium-term flight from the Dollar due to the massive liquidity injected into the system to abate the credit crunch. The recent gold rush has proven to be a signal that investors are eager to divest from the Dollar in fear that hyper inflation may be around the bend. While we were speculating China might bring the topic of a new monetary standard to the forefront at the G20 meeting, it seems the global economy as a whole is beginning to step in unison regarding this very sensitive issue. Today’s reaction in the FX markets is a fundamental shift because investors are beginning to trade on the psychology of a resoundingly weaker Dollar instead of focusing on economic data. These two developments are energizing the bulls and giving them ammunition to finally select a new direction. Today’s movements are a resounding technical message with the EUR/USD and GBP/USD rising in unison as the USD/JPY retests previous September lows.

The EUR/USD has broken through our important 3rd tier downtrend line and is presently testing the psychological 1.45 level. The currency pair is setting fresh 2009 highs and appears to be leaving the August trading range behind. While the EUR/USD could experience a little hesitation at 1.45 in light of the extent of today’s upward movement, it seems the currency pair is headed for a new leg higher. We left our trend lines as is on our chart for today so you can view the currency pair’s reaction to the inflection points. All we need is a confirmation in heightened buy-side volume to solidify a new near-term uptrend. The next technical resistances to the topside are the EUR/USD’s psychological 1.45 level and December 2008 highs. As for the downside, August highs should serve as a support should they be tested.

Germany released disappointing Industrial Production number today and is taking a bite out of the Euro’s relative strength considering Britain’s Manufacturing Production data eclipsed analyst expectations. Volatility should only heat up as the week progresses considering tomorrow’s release of the Beige Book and the wealth of U.S., Chinese, and British economic news on Thursday. China’s Industrial Production number will be in focus since the recovery’s attention has been pinpointed on the resilience of China’s economy during the downturn. Any further cooling in China’s economic growth could take some wind out of the EUR/USD’s sails. On the other hand, a continual rise in China’s Industrial Production would only lead investors further away from the Dollar. Regardless, the EUR/USD’s movement today is a strong technical indicator in favor of the uptrend and we could see gains accelerate over the near to medium-term.

Present Price: 1.4479

Resistances: 1.4480, 1.4506, 1.4525, 1.4546, 1.4582

Supports: 1.4454, 1.4430, 1.4408, 1.4388, 1.4363

Psychological: 1.45

Market Commentary provided by Fast Brokers.

Disclaimer: FastBrokers’ market commentary is provided for information purposes only and under no circumstances should be regardedneither as an investment advice nor as a solicitation or an offer to sell/buy any financial product. FastBrokers assumes no responsibility or liability from gains or losses incurred by the information herein contained.

Risk Disclosure: There is a substantial risk of loss in trading futures and foreign exchange. Please carefully review all risk disclosure documents before opening an account as these financial instruments are not appropriate for all investors.

Prechter Stands Alone Again… He’s Done the Math

By Neil Beers

So Bob Prechter is bearish again.

That may be no surprise to some, but recall that Prechter was about the only bull on February 23 of this year when he covered the short position he had recommended on July 17, 2007. That was nearly two years later and 800 points lower in the S&P. And the Daily Sentiment Index (DSI) reading for the S&P had gotten down to only 3% bulls!

His February 2009 Elliott Wave Theorist explained, “The market is compressed, and when it finds a bottom and rallies, it will be sharp and scary for anyone who is short.” Elliott Wave analysis, the DSI, and other indicators suggested it was time for a Primary-degree bear market rally. And that is what we got.

Now in his August 2009 Theorist, Bob explains what “the prudent thing to do” in the markets is, based on the same Elliott wave pattern and sentiment indicators — plus the Dow’s 3/8 Fibonacci retracement from the March 9 low.

For more analysis from Robert Prechter, download a free 10-page July issue of Prechter’s Elliott Wave Theorist.

What’s so special about Fibonacci? And why is a certain level of Fibonacci retracement so significant in conjunction with The Wave Principle? Well…

In its broadest sense, the Wave Principle suggests the idea that the same law [the Golden Ratio] that shapes living creatures and galaxies is inherent in the spirit and activities of men en masse. Because the stock market is the most meticulously tabulated reflector of mass psychology in the world, its data produce an excellent recording of man’s social psychological states and trends. This record of the fluctuating self-evaluation of social man’s own productive enterprise makes manifest specific patterns of progress and regress. What the Wave Principle says is that mankind’s progress (of which the stock market is a popularly determined valuation) does not occur in a straight line, does not occur randomly, and does not occur cyclically. Rather, progress takes place in a “three steps forward, two steps back” fashion, a form that nature prefers. More grandly, as the activity of social man is linked to the Fibonacci sequence and the spiral pattern of progression, it is apparently no exception to the general law of ordered growth in the universe. … The briefest way to express this principle is a simple mathematical statement: the 1.618 ratio.

-Elliott Wave Principle, chapter 3

Fibonacci ratios in conjunction with The Wave Principle can help you anticipate trend changes. They allow you to calculate specific price levels of when and where a wave is likely to end. In this case, where the rally from the March 9 low is likely to end. There are several Fibonacci retracements that appear most commonly, so the market could of course move higher before it settles on the next wave down, “but we are no longer compelled to wait.”

Bob Prechter’s August Elliott Wave Theorist published a week and a half early: he did so to give subscribers time to prepare for what’s ahead. The issue provides a list of levels that mark Fibonacci and Elliott-wave related retracements for the rally. He analyzes which one is the most likely end point, and even explains how you can make the most of the waning rally.

You don’t have to be taken by surprise. Get the latest Elliott Wave Theorist and you’ll see where the rally is likely to end. Think about the difference this knowledge can make for you.

For more analysis from Robert Prechter, download a FREE 10-page July issue of The Elliott Wave Theorist. It challenges current recovery hype with hard facts, independent analysis, and insightful charts. You’ll find out why the worst is NOT over and what you can do to safeguard your financial future.


Neil Beers has a bachelors degrees in political science and philosophy, and a masters in classical languages. His broad range of study and focus on ancient and modern thought led him to Elliott Wave International to research and write about the Wave Principle, Socionomics, and human social behavior.

Forex Market to Move on News Coming from Europe and Canada

Source: ForexYard

In forex trading, the USD is set to have relatively quiet news today. This lack of major news indicates that the other major currencies, such as the GBP, EUR and CAD, may be the market movers today and traders should pay close attention to each of their respective economic news releases.

Economic News

USD – Dollar Falls as Labor Day Holiday Takes Its Toll

The U.S. Dollar fell against a number of its major crosses due to U.S. markets being closed. Looking at Monday’s trading as a whole, the Labor Day holiday in the U.S. took its toll on the American currency. In early trading yesterday, the USD fell to a near 2 week low vs. the British Pound. This was after Kraft Foods stated that it made an offer to buy British chocolate maker Cadbury. Despite the low trading volume on Monday, it seems that risk appetite was high, and high-yielding currencies became more attractive. The Dollar Index dropping by 0.2% to 78.00 yesterday is evidence of this.

The USD/JPY cross fell by 25 pips yesterday to the 92.85 level, as many traders ditched the U.S. currency for the Yen due to the improving global economy and the thin trading of Labor Day. The Australian Dollar hit a 1 year high vs. the U.S. Dollar on Monday. The AUD was helped due to rising Gold and Crude Oil prices as of late, which Australia’s currency is highly dependent. In addition, Australia’s currency is in much greater shape than that of America. The Canadian Dollar made some inroads into the greenback. By the end of yesterday’s trading, the EUR/USD pair closed unchanged at 1.4332.

Looking ahead to today’s trading, there is the U.S. Consumer Credit figures at 19:00 GMT. The other releases that are expected to affect the main USD crosses are the British Manufacturing Production at 08:30 GMT, the German Industrial Production result at 10:00 GMT and Canadian Building Permits figures from at 12:30 GMT. The volume today is likely to be high following yesterday’s bank holidays in both the U.S. and Canada. We might see the EUR/USD and GBP/USD close over 100 pips away from the opening. If you want to make big profits today, buy into the USD’s crosses now.

EUR – EUR Trading Dominated By Optimistic Data

On Monday, EUR trading was driven by German Factory Orders rising for the 5th consecutive month in July by a higher than forecast 3.5%. This was much needed confidence for Europe’s largest economy. Major benchmark indexes rose in all the western European markets. The German DAX climbed by 1.5%, and the British FTSE 100 added 1.7%. Despite the positive figures from Germany, Europe’s biggest economy is still a long way away from returning to desirable levels. It can be said that the recent G20 Meetings helped return confidence to the European currency.

The EUR snatched a 3rd consecutive day of gains against the British currency, as the pair rose by 30 pips to close at the 0.8777 level. This was largely due to German industrial data helping the EUR, which was much needed boost for the European currency. The EUR/USD cross finished trading unchanged at the 1.4232 level. This was owed to the U.S. Labor Day bank holiday. The GBP/USD pair rose in earlier trading yesterday, but ended up 60 pips lower at the 1.6343 level. The GBP declined yesterday, due to an equity market rally, which led to traders dropping the cable.

Today, there is much economic news that is expected to determine the value of the both the EUR and GBP. There is the British Manufacturing Production at 08:30 GMT, the German Industrial Production at 10:00 GMT, and the British Nationwide Consumer Confidence at 23:01 GMT. There is likely to be a continuation of much of Monday’s trends. However, the volatility may increase a lot, as regular trading returns to the forefront. It is advisable to buy into the main EUR, GBP, and CHF crosses, as today’s trading kicks in.

JPY – JPY Expected to Slide

The Yen fell to its lowest level in a week vs. the EUR. However, the EUR/JPY eventually finished yesterday’s trading 30 pips lower at the 133.18 level. In the coming days, it seems that the Japanese currency may slide as global equities are expected to rise. Analysts expect this to reduce demand for the JPY as a safe-haven. This behavior was already seen on Monday, as the JPY dropped vs. the AUD and the NZD.

The recent election victory of the Democrat Party has led to much speculation amongst investors that the JPY may slide in the coming weeks and months. Many people believe that this inexperienced party will increase taxes too high, and will be unable to handle Japan’s finances well. Therefore, these analysts conclude that there may be a downward spiral of the Japanese currency in the near future.

Crude Oil – Crude Oil Eyes OPEC Meeting

Crude Oil finished trading virtually unchanged at $68.12. This behavior was largely owed to the U.S. markets being closed on Monday. Therefore, there was lower than usual volatility in both the forex market and the commodity market. Furthermore, in mid-trading many investors ditched Crude Oil for equities, which was initiated by the announcement of the attempted takeover bid by Kraft Foods of Cadbury.

OPEC is set to meet on Wednesday 9th September, and is expected to maintain the production target of 24.845 million barrels a day in Vienna, according to Kuwaiti Oil Minister Sheikh Ahmed Al-Sabah. As trading volume returns back to normal today, there is likely to be very high fluctuations in the price of Crude Oil. Traders will be keeping one eye on tomorrow’s OPEC meeting, and another eye on USD strength.

Technical News

EUR/USD

The pair has been range trading between the 1.4200 and the 1.4360 levels in the past several days. The daily chart seems to be showing misleading data. However, the 4-hour chart offers a more accurate picture. The RSI of the 4-hour chart shows the pair sitting in the overbought territory, signaling that a downward correction in the coming hours is imminent. Entering the pair at an early stage seems to be a wise choice today.

GBP/USD

The hourly chart is showing mixed signals with its Slow Stochastic fluctuating at the neutral territory. However, there is a bearish cross forming on the daily chart’s Slow Stochastic indicating a bearish correction might take place in the nearest future. When the downwards breach occurs, going short with tight stops appears to be preferable strategy.

USD/JPY

There is a fresh bullish cross forming on the 4- hour chart’s Slow Stochastic indicating a bullish correction might take place in the nearest future. The upward direction on the hourly chart’s Slow Stochastic also supports this notion. When the upward breach occurs, going long with tight stops appears to be preferable strategy.

USD/CHF

The pair has been range-trading for a while now, with no specific direction. The Daily chart’s Slow Stochastic providing us with mixed signals. The 4 hour charts do not provide a clear direction as well. Waiting for a clearer sign on the hourlies chart might be a good strategy today.

The Wild Card – Silver

Silver prices rose significantly in the last month and peaked at $16.41 per ounce. However, there is a bearish cross on the daily chart’s Slow Stochastic suggesting that a recent upwards trend is loosing steam and a bearish correction is impending. This might be a good opportunity for forex traders to enter the trend at a very early stage.

Forex Market Analysis provided by Forex Yard.

© 2006 by FxYard Ltd

Disclaimer: Trading Foreign Exchange carries a high level of risk and may not be suitable for all investors. There is a possibility that you could sustain a loss of all of your investment and therefore you should not invest money that you cannot afford to lose. You should be aware of all the risks associated with Foreign Exchange trading.

Dollar Expects Low Volatility Today

Source: ForexYard

Today is a quiet news day for the U.S. and Canada, as there are no economic data releases on the calendar today. However, Britain and Euro-zone appear to be releasing the bulk of today’s news, which means we may see a day of trading with low liquidity and therefore increased volatility. Day-traders can take advantage of these intense trading days by swinging within the larger-than-normal price fluctuations.

Economic News

USD – USD Downtrend to Continue; Labor Day Causes Thin Trading

The US Dollar experienced some intense trading sessions last week. Following Friday’s Non-Farm Payroll data the USD quickly rose from the better-than-expected results, but ended the day significantly lower against its primary rivals as many investors dumped the greenback in exchange for riskier assets. In fact, the USD dropped against the EUR to above the 1.4300 price level, and the 1.6400 level against the Pound Sterling.

This weekend’s G20 Summit also added to the Dollar’s bearishness at the start of this week’s trading, many analysts have said, as hawkish statements from world leaders has spurred a rally in market optimism and risk appetite. Supporting this notion is the downtrend of the Japanese Yen against all of its rivals, signaling a sell-off in safe-haven currencies – a category which the USD still falls in as well.

With US and Canadian banks celebrating Labor Day, the forex market will be experiencing thin trading today. Without these economic giants pumping liquidity into the market, most current trends will remain as they are for the next day or two, and traders can benefit by jumping into these trends before they finally come to an end.

EUR – EUR Appreciates on Growing Investor Confidence

The EUR gained support last Friday following the US’s Non-Farm Payroll data which showed the US jobs sector contracting less than anticipated and enticing traders into riskier assets. The EUR, towards the close of trading last Friday, rose above the 1.4300 price level against the USD, and climbed against the GBP back towards 0.8730, while also clawing its way back to a week high against the JPY, upwards of the 133.40 price level.

Investor confidence in the Euro-Zone has been on the rise for the past few months and September appears to be set for being one of the better months for the 16-nation currency. Some reports have shown this confidence level to have reached a 13-month high, marking this month as the potential turning point in the global recession. The recent strength of the EUR supports this notion as it has begun to appreciate against all of its primary currency rivals.

As for today, the Euro-Zone and Britain will be the leading economies today considering that the US and Canada are on holiday to celebrate Labor Day. With low levels of liquidity, current trends will likely continue, but news about Germany’s manufacturing sector could put a damper on recent EUR strength if it comes out much worse than expected.

JPY – JPY Takes a Dive from Positive US Employment Reports

While gaining in value steadily over the past two weeks against all of its primary currency counterparts, the JPY faced a severe downturn at the end of last week’s trading. Dropping as low as 93.15 against the USD, 133.45 against the EUR, and even as low as 153.00 versus the GBP, the JPY has taken a hit as a result of the growing market optimism following Friday’s employment reports from the US and Canada.

With these two massive economies missing from the market today due to the Labor Day holidays in both, the EUR and JPY may in fact be today’s leading currencies. However, with the expected low level of liquidity, and lack of significant economic events, the current downtrend for the JPY will likely continue throughout the trading day. Traders still have an opportunity to enter this trend at a relatively early stage and make healthy profits.

Crude Oil – Crude Oil Price Consolidating Towards Volatile Movement

Despite the drop in the value of the US Dollar last Friday, the price of Crude Oil has actually depreciated to $68 a barrel. This commodity currently trades inside a consolidation trend with a target level of $67.50 as the breaking point. With USD traders pricing in a downward move for the greenback, it is only natural to expect a corresponding upward movement from Crude Oil in the days ahead.

As for today, however, the forex market will likely remain inside of its current trends due to the low levels of liquidity being anticipated as a result of the bank holidays in the US and Canada. As a result, the current consolidation trend being experienced in the price of Crude Oil will likely continue, with a small downtrend in the works for today’s early trading hours.

Technical News

EUR/USD

The daily chart is showing mixed signals with its RSI fluctuating at the neutral territory. However, there is a fresh bearish cross forming on the 4-hour chart’s Slow Stochastic indicating a bearish correction might take place in the nearest future. Going short might be a wise choice.

GBP/USD

There is a bearish cross forming on the 4- hour chart’s Slow Stochastic indicating a bearish correction might take place in the nearest future. The downward direction on the daily chart’s Slow Stochastic also supports this notion. When the downward breach occurs, going short with tight stops appears to be preferable strategy.

USD/JPY

The typical range trading on the hourly chart continues. The daily chart Slow Stochastic is floating in neutral territory. However, the 4-hour chart’s RSI is already floating in the overbought territory, suggesting a downward correction may be imminent. When the downwards breach occurs, going short with tight stops appears to be preferable strategy.

USD/CHF

The pair has recorded much bearish behavior in the past two days. However, the technical data indicates that this trend may reverse anytime soon. For example, the 4-hour chart’s Stochastic Slow signals that a bullish reversal is imminent. An upward trend today is also supported by the hourly chart’s RSI. Going long with tight stops may turn out to pay off today.

The Wild Card – Gold

Gold prices rose significantly in the last week and peaked at $992.65 for an ounce. However, the daily chart’s RSI is floating in an overbought territory suggesting that a recent upwards trend is loosing steam and a bearish correction is impending. This might be a good opportunity for forex traders to enter the trend at a very early stage.

Forex Market Analysis provided by Forex Yard.

© 2006 by FxYard Ltd

Disclaimer: Trading Foreign Exchange carries a high level of risk and may not be suitable for all investors. There is a possibility that you could sustain a loss of all of your investment and therefore you should not invest money that you cannot afford to lose. You should be aware of all the risks associated with Foreign Exchange trading.

USD/JPY’s Bounce Loses Steam

By Fast Brokers – The USD/JPY’s bounce is losing momentum due to inadequate buy-side activity.  The USD/JPY failed to close above our 1st tier uptrend line and September highs on the 4-hours while our 2nd tier downtrend line hangs in the distance.  Investors were acting on oversold conditions, and rightly so.  The psychological impact of the DPJ’s victory is wearing off and attention should return to economic fundamentals.  Movements in the EUR/USD and GBP/USD are constrained by consolidation as investors continue to debate the viability of the global economic recovery.  Therefore, the USD/JPY may enter a consolidative phase of its own as investors decide where to take the Dollar.  Regardless, there remains a strong downward pressure on the USD/JPY.  Ultimately, the USD/JPY’s fate will likely depend on the S&P futures.  The S&P futures continue to float around 1000 and lack a definite near-term trend.  However, once the S&P futures do make a technically significant movement, investors will likely see a comparable response in the USD/JPY, possibly a retracement beneath July lows.

Next week is chalk full of data, including Japan’s Core Machinery Orders on Wednesday and Final GDP on Thursday.  Investors will also be paying close attention to the wave of Chinese economic data on Thursday since Japan has been relying on China’s demand for exports.  Investors will also receive key economic data from the U.S. along with a BOE monetary policy decision on Thursday.  Hence, next week could be a return to volatility with the summer coming to a close, especially since the EUR/USD and GBP/USD are both experiencing multiple trend line inflection points soon.

Present Price: 92.86

Resistances:  92.97, 93.17, 93.33, 93.44, 93.59

Supports:  92.77, 92.68, 92.55, 92.43, 92.27

Psychological: 90, 95

Market Commentary provided by Fast Brokers.

Disclaimer: FastBrokers’ market commentary is provided for information purposes only and under no circumstances should be regardedneither as an investment advice nor as a solicitation or an offer to sell/buy any financial product. FastBrokers assumes no responsibility or liability from gains or losses incurred by the information herein contained.

Risk Disclosure: There is a substantial risk of loss in trading futures and foreign exchange. Please carefully review all risk disclosure documents before opening an account as these financial instruments are not appropriate for all investors.

GBP/USD Stabilizes above our 3rd Tier Uptrend Line

By Fast Brokers – The GBP/USD is stabilizing further above our 3rd tier uptrend line, yet can manage to break free of our 2nd tier downtrend line.  These two trend lines are colliding soon, and we notice multiple inflection points occurring in the EUR/USD.  Hence, the two currency pairs are implying there could be a jolt of volatility soon.  However, trading should be light today since many traders are taking a long weekend for the Labor Day holiday.  Meanwhile, the Pound continues to enjoy a relative strength as the EUR/GBP slides lower.  Investors were relieved by the solid Services PMI number yesterday after the weak economic data combined with the BOE’s monetary shock.  However, a higher than expected U.S. headline Unemployment Rate is capping movements to the topside.  The S&P futures are back above 1000, yet we expect the psychological zone to keep equities in check until there is a technically significant movement in either direction.  The S&P’s gravitation towards 1000 is keeping the GBP/USD locked within a reasonable trading range right now.

Britain’s Halifax HPI release was pushed back to Monday, and we expect the data to come in at or above analyst expectations since the UK’s housing market is holding up well.  We expect market volatility could increase next week.  Although we’ve been chomping at the bit for some volatility, a key technical movement may finally occur with the Labor Day holiday marking the official end of summer.  Additionally, we’ll receive some key economic data throughout the week, most notably China’s Industrial Production number and a BOE monetary policy decision on Thursday.  There has been a lot of chatter concerning whether China’s economy is slowing down, and the wave of data on Thursday may help clear the air.  Meanwhile, investors will be keen to see how the BOE addresses its alternative liquidity program.  With inflection points approaching in both the GBP/USD and EUR/USD, the ingredients are on the table to make a volatile week.

Technically speaking, although the GBP/USD has experienced some encouraging strength lately, the currency pair still has our 2nd and 3rd tier downtrend lines to deal with.  Our 3rd tier downtrend line is a key for attaining more sizable gains towards 1.65 and August 21st highs.  Furthermore, as long as our 3rd tier downtrend line bears overhead a medium-term downtrend line will weigh on the currency pair.  A strong downward force remains with analysts cautioning about overbought equity market.  Should the S&P futures opt to make a large leg down the GBP/USD would likely follow suit.  As for the downside, the GBP/USD has built a little breathing room, most notably our 2nd and 3rd tier uptrend lines and September lows.  Additionally, even if our uptrend liens should fail the currency pair has the highly psychological 1.60 level to fall back on.  We will have to wait and see how the next week unfolds since it seems investors are content heading into the holiday weekend with a consolidative pattern.

Present Price: 1.6330

Resistances: 1.6360, 1.6376, 1.6408, 1.6443, 1.6469, 1.6520

Supports: 1.6324, 1.6300, 1.6267, 1.6239, 1.6212

Psychological: 1.65, 1.60

Market Commentary provided by Fast Brokers.

Disclaimer: FastBrokers’ market commentary is provided for information purposes only and under no circumstances should be regardedneither as an investment advice nor as a solicitation or an offer to sell/buy any financial product. FastBrokers assumes no responsibility or liability from gains or losses incurred by the information herein contained.

Risk Disclosure: There is a substantial risk of loss in trading futures and foreign exchange. Please carefully review all risk disclosure documents before opening an account as these financial instruments are not appropriate for all investors.

EUR/USD Continues its Consolidation Between our Trend Lines

By Fast Brokers – The EUR/USD is consolidating between our trend lines as they creep towards their respective inflection points.  The EUR/USD is trading lower this morning after America’s headline Unemployment Rate came in two basis points higher than analyst expectations.  However, the EUR/USD is bouncing off of our 1st tier uptrend line, and it appears the currency pair may opt to stay within the bounds of our trend line trading range. The U.S. markets will be closed on Monday for Labor Day, and trading should be thin today since many traders will take a long weekend.

The S&P futures are trading back above the 1000 mark again.  The futures are exhibiting a form of resilience one would expect from such a psychological level.  The S&P’s gravitation towards 1000 is preventing the EUR/USD and other major Dollar crosses from breaking out in either direction.  Meanwhile, the EUR/USD may stay relatively range bound until market optimists or pessimists win out.  Investors are still very uncertain in regards to where the market is headed in the near-term.  The S&P futures continue to hover around 1000 despite the fact that many analysts are calling for a modest pullback in equities.

The EU has a relatively light data week ahead and will leave the headlines to the U.S., China and Britain.  Next Wednesday and Thursday could prove to be volatile sessions since China will release its Industrial Production data along with a BOE monetary policy decision.  It is less certain how the BOE will approach its liquidity program as compared to the ECB.  Hence, we could witness a pickup in volatility as the summer comes to a close.  Investors will receive Germany Factory Orders on Monday and analysts expect a cool-down in growth from 4.5% to 2%.

Technically speaking, our trend lines are approaching their inflection points.  The EUR/USD has interacted properly with our trend lines during its recent consolidation.  Hence, we believe the inflection points should mark an increase in volatility.  Our 3rd tier uptrend and downtrend lines play the largest trend-setting role on our chart.  If our 3rd tier downtrend line fails, we anticipate a retest of August highs.  On the flipside, a retracement below our 3rd tier uptrend line could result in a retest of August lows.  Meanwhile, the 1.40 and 1.45 psychological patiently wait in opposite directions.  Investors should keep a close eye on the S&P futures.   If the S&P futures should continue their downward momentum and head below technical supports, the EUR/USD would likely exercise its positive correlation with U.S. equities, and vice versa.

Present Price: 1.4226

Resistances: 1.4246, 1.4266, 1.4287, 1.4301, 1.4326

Supports: 1.4224, 1.4208, 1.4197, 1.4168, 1.4154

Psychological: 1.40, 1.45

Market Commentary provided by Fast Brokers.

Disclaimer: FastBrokers’ market commentary is provided for information purposes only and under no circumstances should be regardedneither as an investment advice nor as a solicitation or an offer to sell/buy any financial product. FastBrokers assumes no responsibility or liability from gains or losses incurred by the information herein contained.

Risk Disclosure: There is a substantial risk of loss in trading futures and foreign exchange. Please carefully review all risk disclosure documents before opening an account as these financial instruments are not appropriate for all investors.

US Jobs decline less than expected in August, Unemployment rate rises. USD mixed in Forex Trading.

By CountingPips.com

The U.S. Nonfarm Payrolls data released today showed that jobs fell less than expected and declined the least since August 2008. The Department of Labor report showed that private employers cut 216,000 jobs in August following July’s revised 276,000 decrease. August marked the twentieth consecutive month that companies have shed workers but the decline was the least since jobs fell by 175,000 workers in August 2008.

Video: In-Depth Look – Jobless Rate Jumps To 9.7%

The unemployment rate unexpectedly increased by 0.3 percent to 9.7 percent in August and reached the highest level since June 1983 when it was 10.1 percent.

July’s employment data was revised higher to a loss of 276,000 jobs after originally showing a decline of 247,000.  According to the Department of Labor, there has been a loss of 7.4 million jobs and a 4.8 percent increase in the unemployment rate since the start of the recession in December 2007.

The August job decline was better than market forecasts that were expecting a loss of approximately 230,000 jobs but the unemployment rate rose higher than the 9.5 percent that was expected.

The decline in jobs was spread throughout most economic sectors with the exception of the education & health services sector which saw 52,000 jobs created. The goods-producing sector lost 136,000 jobs for the month as the manufacturing sector cut 63,000 jobs and the construction sector lost 65,000 jobs. The service-providing sector lost 80,000 total jobs in August with professional & business services shedding 22,000 workers and retail trade cutting 10,000 workers. The leisure & hospitality sector lost 21,000 workers while government hiring  declined by 18,000 jobs for the month.

U.S. Dollar mixed after Employment News.

The U.S. dollar has been mixed in forex trading today against the other major currencies after the employment report. The dollar is showing gains on the day so far against the Swiss franc and Japanese yen while showing losses versus the British pound, Australian dollar, New Zealand dollar and Canadian dollar.  The dollar has been almost unchanged in up and down trading against the euro around the 1.4256 exchange rate in the U.S. trading session at 11:44am EDT.

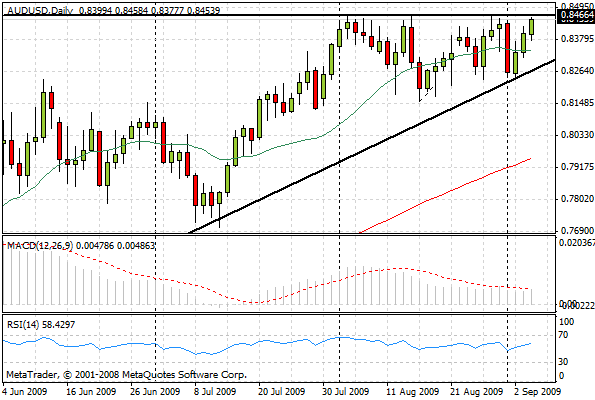
AUD/USD Chart – The Australian Dollar advancing for the third day in a row against the US Dollar in Forex Trading today.  The AUD/USD is trading at the top of an ascending triangle formation on the Daily Chart and breaking through the upside resistence will propel the AUD/USD to its highest exchange rate since September 2008.

AUD/USD Forex Chart
AUD/USD Forex Chart

eToro Daily Market Review 04.09

Market Movers of the Day

Europe

*Euro-zone Purchasing Manager Index Composite for August surprised for the better rising to 50.4

*Euro-zone Retail Sales dropped 0.2% in July

*ECB left as expected its benchmark interest rate at 1%

*ECB Trichet’s speech

*UK Purchasing Manager Index Services better than expected at 54.1

Americas

*US Initial Jobless Claims worse than expected at 570K

*US Continuing Jobless Claims rose to 6.23 million

*US ISM Non-manufacturing Business rose more than forecasted to 48.4

The Overall Sentiment

US stock markets gained momentum as Chinese shares advanced the most in six months but the positive sentiment softened as US Initial Jobless Claims figure rose more than market expectations. US ISM Non-manufacturing Business climbed more than predicted adding to signs the economy is starting to recover but the data showing rising unemployment pushed markets down erasing some of the earlier gains. The S&P ended up 0.9% after losing four days in a row and the Dow climbed 0.7%. The European Central Bank left its benchmark interest rate at 1% and the Euro fell as Trichet stated in his speech that the ECB is not considering exiting its stimulus policies in the near future. Europe’s Purchasing Manager Index Composite climbed in August indicating that the Euro-zone is emerging from recession but declining Retail Sales figures dimmed optimism suggesting a slow-paced recovery. The Pound rose as UK’s Purchasing Manager Index of services industries climbed more than market forecasted. The Canadian dollar remained at low levels against its US peer as Oil was little changed and markets are awaiting the unemployment figures. Gold continued to rally toward the $1000 mark trading above $995 reaching its highest level in seven months. Silver advanced as well trading above $16.  

The Day Ahead

The day will start with Switzerland’s Consumer Price Index providing a measure of the country’s inflation. In Canada the Unemployment Rate is expected to reach its highest level in more than ten years rising to 8.8% from a previous reading of 8.6%. The main attraction for the day will be the stream of data coming from the US at 12:30 GMT. Nonfarm Payrolls is known to provoke high volatility on its release and is expected to show its smallest drop in a year at -223K. A larger decline could bring risk aversion into play pushing the Dollar higher and a smallest one could spur risk appetite driving high-yielding currencies up and weakening the Dollar. The Unemployment Rate is expected to rise to 9.5% from 9.4% a month before.  The Average Hourly Earnings and Average Weekly Hours reports will indicate the current state of the labor markets and labor cost inflation. The last figure for the day will be Canada’s Ivey PMI which will indicate the current readiness of organizations to spend money and their confidence in the direction of the Canadian economy.

Technical Analysis

EUR/GBP DAILY

EUR/GBP moved in range from June to August creating a channel between 0.8450 and 0.8700. The cross managed to break above the upper boundary of the channel consolidating around 0.88. It corrected in the last sessions toward the 0.87 level which could act this time as a support for EUR/GBP to regain the bullish momentum.

EUR/CHF DAILY

After trading in a bearish trend since mid-June, EUR/CHF found support slightly above 1.51 and developed an uphill trend. Reaching the critical resistance area just over 1.5350 corrected all the way down to the 1.51 support line once again. The cross presents a good opportunity to enter a Long position with a close Stop-Loss and the flexibility to go Short if the support line is broken.

Market Analysis provided by eToro

Disclaimer: Trading in the Foreign Exchange market might carry potential rewards, but also potential risks. You must be aware of the risks and are willing to accept them in order to trade in the foreign exchange market. Don’t trade with money you can’t afford to lose.

© 2009 eToro Blog. Powered by Etoro Forex News.