Later today the RBA will meet to decide on its rate policy, setting up the most important economic event for the month for the AUD.
It also could give us the most volatility because there’s no fully formed consensus on what the RBA will do. Some analysts argue that a rate cut is a sure thing, while others say the market is getting ahead of itself.
The bank cut the reference rate as recently as their last meeting, so this would be the first back-to-back cut in over a decade. However, the market is arguing that further stimulus is needed.
In the last policy statement, Governor Lowe somewhat agreed. He said that it was “unrealistic to expect that lowering interest rates by a quarter of a percentage point will materially shift the path we look to be on.”
Evidently, a rate cut is in the cards, the question is how soon. Many are citing that statement as evidence for a cut in July, while others point to the bank’s history to argue that the bank will pause for at least a month.
What Are the Real Expectations?
The odds favor a rate cut. Just under 70% of surveyed analysts are betting the RBA will take action this time around. This would take the rate down to a historic low of 1.0%. The theory is that since the bank doesn’t think that just a quarter of a point is enough, they’ll get the second cut done right away and then see if the policy takes effect.
Expectations are for a total of two rate cuts this year. Further action by the RBA is not priced in until 2020. Barring any unexpected events, we shouldn’t expect the RBA to take any unconventional actions.
Running Out of Room
In that line of thinking, the Bank had stated previously that they see the lower bound of rates at 0.5%, indicating they are running out of ammunition. Given the slowing economy and lack of pickup in inflation, the bank might want to try to take strong action right way, in order to leverage two consecutive hikes.
It should also be noted that the last hike was arguably delayed by a month due to the election. This has led to some analysts saying the bank is behind the curve. Especially with strong rumors that the US and EU will also be cutting this month.
And the Dissenters?
The argument from the minority is that the difference between July and August from a policy perspective is small, and the bank might want to gauge the reaction to the first hike. The other factor is that over the next couple of weeks, we will be getting Q2 data. And, of course, there is reason to get all the latest info before making a move.
The most recent development is the conclusion of the G20 meeting. There, Presidents Trump and Xi came to an agreement to restart trade talks. The market is hopeful that this will reduce some of the trade stress on the global economy.
And the market?
Just a week ago, the odds of a rate cut were in the low 90 percent. But, since then, they have been trickling back. Without a clear consensus, it’s hard for the market to price in the action (or lack thereof) of the bank. Therefore, we should expect extra volatility no matter what.
However, with the odds higher for a cut than for a hold, we ought to see a stronger reaction should the bank decide to not act.
In addition to the rate cut, there will be quite a lot of scrutiny on the Monetary Policy Statement that comes out with it. Analysts will want to know whether the Bank is settling in to see what will happen over the next months, or whether it is still looking for more action.
Last week was a great week for trading as we locked in profits on a trade and raised our stops to protect the rest of our open positions. Take a look at how my trading system identifies trends, trades, and targets in the chart below.
If you want to become profitable technical traders join my educational trading newsletter and trade alerts complete with entry, targets and stop pricing.
Today we closed two winning trades at the open, and entered a NEW trade this morning markets are getting very tradable again. So ride my coattails as I navigate these financial market and build wealth while others lose nearly everything they own during the next set of crisis’.
Soon I will be adding this trading system chart in the member’s area where it updates through the day for you to follow alone and trade with me. I should mention that the newsletter pricing will be going up soon. If you subscribe before the price increase you are grandfathered in at the old/lower rate.
Thibaut Lepouttre, editor of the Caesars Report, considers the implications of the deal recently negotiated with OceanaGold for exploration of gold projects in Nevada.
Introduction
Over the past few years, we noticed one common thing in the mining sector: Most companies prefer to fall back on the so-called Tier 1 destinations in safe mining jurisdictions like North America and Australia.
One of those companies that has been pulling the “safe jurisdictions card” is OceanaGold Corp. (OGC:TSX; OGC:ASX),as it wanted to reduce the importance of the Didipio copper-gold mine in the Philippines in its asset portfolio. The company made a first strong move into North America with the acquisition of Romarco Minerals, which was bringing its Haile gold mine into production but has shifted gears and is going down the development curve by entering into exploration joint venture agreements with juniors.
One of those companies is Bravada Gold Corp. (BVA:TSX.V), which owns numerous prospects and projects in Nevada, a jurisdiction that’s probably as safe as it gets. Bravada was a bit “dormant” in the past few years as this small company was waiting for better times in the gold sector, but we feel the recently announced deal with OceanaGold is a good move for the company. Oceana will need to spend CA$13 million (US$10 million) on exploration to earn a 75% stake in the project, and that minimum spending requirement on this single project is a multiple of Bravada Gold’s current market capitalization.
There’s another reason why we are giving Bravada Gold another good look. CEO Joe Kizis was the person who brought the DeLamar project to Integra Resources Corp. (ITR:TSX.V; IRRZF:OTCQB). Unlike the upper management of Kinross Gold Corp. (K:TSX; KGC:NYSE), which failed to properly identify the exploration potential at the Idaho-based property, Kizis does seem to have a good nose for potentially valuable projects and this nose, in combination with his field experience on Nevada properties and his extensive in-state network, were important considerations for us as well.
Zooming In on the Main Projects
Bravada has approximately a dozen projects in its asset portfolio, and while all those projects seem to have their own merit for being part of the portfolio, we will just highlight two of them. The Highland project is the project OceanaGold will be spending its money on, while Bravada Gold will use the cash from the recently upsized private placement to drill its SF project.
Highland
We will discuss the joint venture terms with OceanaGold later in this article, but there are some very good reasons why OceanaGold was so keen on securing a right to earn into the Highland property in Nevada.
The project does have a rich history, as the first gold occurrences were discovered in the early 1900s, which was followed by a short period of gold production wherein just a handful of ounces were produced right before the Second World War started.
But what mainly attracted Bravada (and its joint venture partner OceanaGold) to this project is the sinter-based exploration theory.
Sinter zones (high silica rock) are formed by hot springs and have been encountered along ancient surfaces on top of some existing gold deposits (which are “hidden” underground and sometimes remain completely undetected). Those sinters usually do not “contain” gold, which has been “left behind” as the fluids made their way to the surface. So if youd complete a sampling program of the sinter zones, the assay values wouldn’t be too exciting.
What matters is that these sinter zones that appear on the surface could very well point toward the existence of one of those hidden gold deposits, usually 200¬400 meters deeper as the gold deposited at the right chemical environment along the way to the surface hot spring and developed high-grade gold-bearing veins. So detecting and defining these sinter zones could help a company to zoom in on high-priority drill targets to find the gold zones.
Just an elusive theory? Not really.
There’s a very good reason why specifically OceanaGold has shown a lot of interest in Highland’s sinter model. Oceana owns the Waihi mine in New Zealand, which has been mined and explored for several decades and in the past few years. The company has been successful in deploying its sinter-focused exploration theory at Waihi, and now wants to deploy its knowledge in Nevada.
In fact, OceanaGold has been deploying the sinter-based exploration theory all over New Zealand’s northern island in an attempt to increase its project and resource base in the country. So if any company understands the importance of and how to deal with a sinter-based exploration theory, OceanaGold would probably top that list.
SF
The SF project (which hosts a Carlin-type exploration target) is located directly east of the Cortez mining district in Nevada, on the Battle Mountain Gold Trend. The geological structures of the property weren’t well understood in the past few years, but when a neighbor encountered short zones of gold mineralization with grades of in excess of 0.3 g/t gold, Bravada Gold was finally able to put a few additional pieces of the puzzle together and overhauled its exploration theory.
According to Bravada Gold: “Recently published data on Nevada stratigraphy and structure has led to a reinterpretation of stratigraphy and structure at SF, greatly upgrading an untested target.”
Of specific interest are the rocks encountered at SF: the Wenban and Horse Canyon formations are the host rocks for, for instance, the Goldrush deposit, while two other Barrick Gold Corp. (ABX:TSX; GOLD:NYSE)-owned projects, Pipeline and Cortez Hills, also occur in the same geological setting.
Of course, these are just two projects from Bravada Gold’s extensive portfolio, but as these will receive most of the attention over the next few months, we feel it was worth highlighting these specific two projects.
What Attracted Oceanagold to the Highland Project?
Just one month after signing a letter of intent (LOI) with OceanaGold, Bravada Gold was able to convert the LOI into a binding agreement, which allows OceanaGold to acquire a 75% stake in the Highland gold-silver project located just a few kilometers north of the Bruner gold deposit in Nevada’s Walker Lane gold trend.
OceanaGold can earn an initial 51% stake in the property by completing some initial cash payments to Bravada Gold, which will subsequently be used to make the advanced minimum royalty payments to the vendors of the property while a final US$200,000 payment from OceanaGold can be made in cash or shares.
On top of that, Oceana will be required to spend at least US$4 million (US$4M) on exploration before establishing the 51% stake. And this means OceanaGold will be spending 170% of Bravada Gold’s entire market cap just to acquire a little over half of one project (indicating the perceived value of the remaining 49% of the project already exceeds Bravada’s current market capitalization).
Should OceanaGold like what it sees, it will be able to acquire an additional 24% stake in the property for US$6M in exploration expenditures, whereafter a 75/25 joint venture will be established.
Some people don’t appreciate the fact Bravada Gold is giving up a majority stake in one of its most important properties, but let’s just leave emotions out of this decision and look at the numbers. OceanaGold needs to spend US$10M, or approximately CA$13M, on the ground to establish a 75% stake. This basically means Oceana needs to spend roughly three times Bravada’s current market capitalization on exploration for its initial stake in just one of the projects in Bravada’s asset portfolio. And the choice between this and seeing Bravada dilute its share count by several hundreds of percents is an easy one. In some cases it really is better to own 25% of a project that effectively is being advanced by a smart partner than retaining 100% of something that’s just gathering dust on the proverbial shelf.
For OceanaGold, the Highland project just is a good match. It meets the requirement of a project being located in a Tier 1 country, and as Oceana has proven it knows its way around sinter zones and connecting those zones to epithermal systems, the exploration joint venture appears to be a good match.
Bravada Gold Is Increasing Its Current Financing
Exploring costs money, and Bravada Gold is currently wrapping up a private placement. The company already closed a first tranche of the placement in May, raising CA$567,000, but has now extended and increased the size of the placement as Bravada is now aiming to raise an additional CA$300,000 (to end up at CA$870,000).
The $0.07 units consist of one common share as well as a full warrant, allowing the warrant holder to acquire an additional share of Bravada Gold at CA$0.12 for a period of four years after closing. Should Bravada Gold (and/or OceanaGold) effectively be successful in the upcoming exploration campaign, the CA$0.12 warrants could act as a “secondary” financing, as the 12.43M units that are expected to be issued would represent an additional CA$1.5M in cash hitting Bravada’s treasury. But, of course, before these warrants even come in play, Bravada will need to convince the market it effectively has the goods, and a successful exploration program at SF would be very helpful.
Conclusion
Bravada Gold has a lot of horses in its stable, and future exploration programs on, for instance, Wind Mountain, which currently contains 900,000 ounces of gold and almost 25 million ounces of silver (in a low-grade resource estimate that could become interesting again with the gold price exceeding $1,400/ounce) will depend on Bravada’s ability to raise money.
One could expect news flow in the second half of the year to be dominated by the exploration activities on both the SF project and the Highland project.
Thibaut Lepouttre is the editor of the Caesars Report, a newsletter and mining portal based in Belgium that covers several junior mining companies with a special focus on precious metals and base metals. Lepouttre has a Bachelor of Law degree and two economics masters degrees that have forged his analytical approach to the mining sector. Considered a number cruncher, Lepouttre focuses on the valuations of companies and is consistently on the lookout for the next undervalued mining company.
Disclosure: 1) Thibaut Lepouttre: I, or members of my immediate household or family, own securities of the following companies mentioned in this article: a long position in Bravada Gold. My company has a financial relationship with the following companies referred to in this article: Bravada Gold. I determined which companies would be included in this article based on my research and understanding of the sector. Additional disclosures are below. 2) The following companies mentioned in this article are billboard sponsors of Streetwise Reports: None. Click here for important disclosures about sponsor fees. 3) Statements and opinions expressed are the opinions of the author and not of Streetwise Reports or its officers. The author is wholly responsible for the validity of the statements. The author was not paid by Streetwise Reports for this article. Streetwise Reports was not paid by the author to publish or syndicate this article. Streetwise Reports requires contributing authors to disclose any shareholdings in, or economic relationships with, companies that they write about. Streetwise Reports relies upon the authors to accurately provide this information and Streetwise Reports has no means of verifying its accuracy. 4) This article does not constitute investment advice. Each reader is encouraged to consult with his or her individual financial professional and any action a reader takes as a result of information presented here is his or her own responsibility. By opening this page, each reader accepts and agrees to Streetwise Reports’ terms of use and full legal disclaimer. This article is not a solicitation for investment. Streetwise Reports does not render general or specific investment advice and the information on Streetwise Reports should not be considered a recommendation to buy or sell any security. Streetwise Reports does not endorse or recommend the business, products, services or securities of any company mentioned on Streetwise Reports. 5) From time to time, Streetwise Reports LLC and its directors, officers, employees or members of their families, as well as persons interviewed for articles and interviews on the site, may have a long or short position in securities mentioned. Directors, officers, employees or members of their immediate families are prohibited from making purchases and/or sales of those securities in the open market or otherwise from the time of the interview or the decision to write an article until three business days after the publication of the interview or article. The foregoing prohibition does not apply to articles that in substance only restate previously published company releases.
In part I of this research post, we highlighted how the shifting landscape of the US real estate market may be setting up an incredible trading opportunity for technical traders. It is our belief that the continued capital shift which has been driving foreign investment into US assets, real estate, and other investments may be shifting away from US real estate as tell-tale signs of stress are starting to show. Foreclosures and price drops are one of the first signs that stress exists in the markets and we believe the real estate segment could be setting up for an incredible trade opportunity.
SRS, the Proshares Ultrashort Real Estate EFT has recently completed a unique “washout low” price bottom that we believe may become an incredible trading opportunity for technical traders. If the US Fed pushes the market into a panic mode, sellers will become even more desperate to offload their homes and buyers will become even more discerning in terms of selecting what and when to buy.
Our opinion is that the recent “washout low” price bottom in SRS is very likely to be a unique “scouting party” low/bottom that may set up a very big move to the upside over the next 4 to 12+ months. If our research is correct, the continued forward navigation for the US Fed, global central banks and the average consumers buying and selling homes is about to become very volatile.
If SRS moves above the $25.50 level, our first upside Fibonacci price target and clears the $24.25 previous peak set in April 2019, it would be a very clear indication that a risk trade in Real Estate is back in play. Ideally, price holding above the $21.65 level would provide a very clear level of support negating any future price weakness below $21.50.
This weekly SRS chart highlights what we believe to be the optimal BUY ZONE and the upside price targets near $28 to $29. Since the bottom in 2009-10, after the credit market crisis, we have not seen any substantial risk in the Real Estate market for over 8+ years. Now, though, it is our opinion that this risk trade is very real and that technical trader should be aware of this potential move and what it means to protect assets and wealth.
If our research proves to be accurate and any future move by the US Fed will prompt a “rush to the exits” by home sellers, then there is really only one course of action left for us to consider. Either the Fed will reduce rates, buying some at-risk sellers a bit of time before a rush to sell overwhelms the markets and prices begin a fast decline in an attempt to secure quick buyers; or the Fed will leave rates at current levels where at-risk sellers will continue to attempt to offload their homes to any willing buyers before declining prices and panicked sellers start the “race to the bottom” in terms of pricing.
CONCLUDING THOUGHTS:
Real Estate has already run through the price advance cycle and the price maturity cycle. There is really only one cycle left to unfold at this point – the “price revaluation cycle”. This is where the opportunity lies with our suggested SRS trade setup.
We believe this bottom in SRS will result in a few more weeks of trading near price support (above $20 and below $22.50) where traders will be able to acquire their positions. The bigger move will happen as risk becomes more evident – very similar to what has recently happened in Gold. Once that risk is visible to traders/investors, the upside potentials ($28+ to $42+) won’t seem so illogical any longer.
I can tell you that huge moves are about to start unfolding not only in real estate, but metals, stocks, and currencies. Some of these super cycles are going to last years. Brad Matheny goes into great detail with his simple to understand charts and guide about this. His financial market research is one of a kind and a real eye-opener. PDF guide: 2020 Cycles – The Greatest Opportunity Of Your Lifetime
As a technical analysis and trader since 1997, I have been through a few bull/bear market cycles. I believe I have a good pulse on the market and timing key turning points for both short-term swing trading and long-term investment capital. The opportunities are massive/life-changing if handled properly.
I urge you to visit my Wealth Building Newsletter and if you like what I offer, join me with the 1 or 2-year subscription to lock in the lowest rate possible, get a FREE BAR OF GOLD and ride my coattails as I navigate these financial market and build wealth while others lose nearly everything they own during the next set of crisis’.
The US dollar traded strongly higher over the European morning on Monday as the positive input from the outcome of the G20 summit over the weekend was felt. Trump and Xi Jinping agreed to restart trade talks, along with Trump signaling a reversal of the ban on US companies dealing with Huawei. The moves have been welcomed by USD bulls, seeing the index trading back above the 95.72 level to trade 96.13 last.
Euro Sells off on USD Strength
EURUSD has been sharply lower today owing to the resurgent US dollar which has kicked EURUSD back down below the 1.1329 level as of writing. USD strength, along with expectations of forthcoming ECB easing are weighing on EUR currently.
GBP Lower on Weak Manufacturing
GBPUSD has come back under heavy pressure over early trading on Monday also. A fresh wave of USD buying has swung back into gear putting downward pressure on GBP which has been exacerbated this morning by a weaker than expected UK manufacturing PMI reading which sees the sector remaining in a contractionary territory over June. GBPUSD trades 1.2645 last continuing to move lower from 1.2771 level.
SPX500 Hits Fresh All-Time Highs
Risk assets have traded higher today also, riding the wave of optimism unleashed by positive developments at the G20 meeting. Along with progress around the US/China trade situation, Trump also made a historic move by becoming the first US president to set foot in North Korea. Trump met North Korean leader Kim Jong Um on Sunday and accompanied him a short distance into the Northern Territory, in an encouraging display of the improving relations between the two leaders. SPX500 trades 2973.03 last, having broken out to fresh all-time highs.
JPY & Gold Down
Safe havens have been the obvious losers from the early flows this week. The rally in risk sentiment has seen both JPY and gold falling lower against USD. The sell-off in gold has seen price falling back under the 1389.73 level, as the decline from 1434.00 gathers pace in the wake of this latest trade war optimism. USDJPY has seen a similar important technical break with the price jumping back above the 108.15 level and breaking the bearish trend line also.
Oil Boosted by Trade Hopes
Oil prices have started the week on a solid footing too given the fresh hopes for a US/China trade deal.The breakdown in talks in May hit oil hard, echoing the decline seen in oil last year as a result of the trade war. With recent EIA reports reflecting growing drawdowns in US crude stores, along with lingering tensions between the US and Iran, crude looks likely to stay well bid. Price is currently challenging the 60.15 resistance level which is holding for now.
Commodity Currencies Can’t Climb
USDCAD has been higher also this morning although only slightly so. Strength in USD has been offset by higher oil prices which continue to support CAD. USDCAD trades 1.3103 last as the market remains stagnant, caught between these two opposing market forces.
AUDUSD has been sharply lower today with price breaking back down below the .70 level. The moves are likely to largely be linked to the collapse in gold prices, along with a higher USD, which have capped the recent upside in AUDUSD.The RBA is not expected to ease further this week though we could get a signal of further easing to come, which should keep AUD weighed over the week.
Getting ready for the publication of the USDA report
U.S. The Department of Agriculture (USDA) reported that by the end of May this year, frozen beef stocks in the United States were 13% lower than the same period in 2018. Will the Fcattle quotations increase?
According to the USDA, the daily slaughter of cattle (cattle) in the United States last week amounted to 122 thousand heads, which is almost 2% more than last year. We also note that by June 1 of this year, the number of cattle in the US feedlots reached a historical maximum of 11.7 million heads, which was 2% on June 1, 2018. Meanwhile, in May, deliveries of cows to feedlots decreased by 3% from last year’s level. If this trend of reduction has lasted in June, then the livestock as of July 1 may decrease. This is able to push quotes up. June data will be published on July 19.
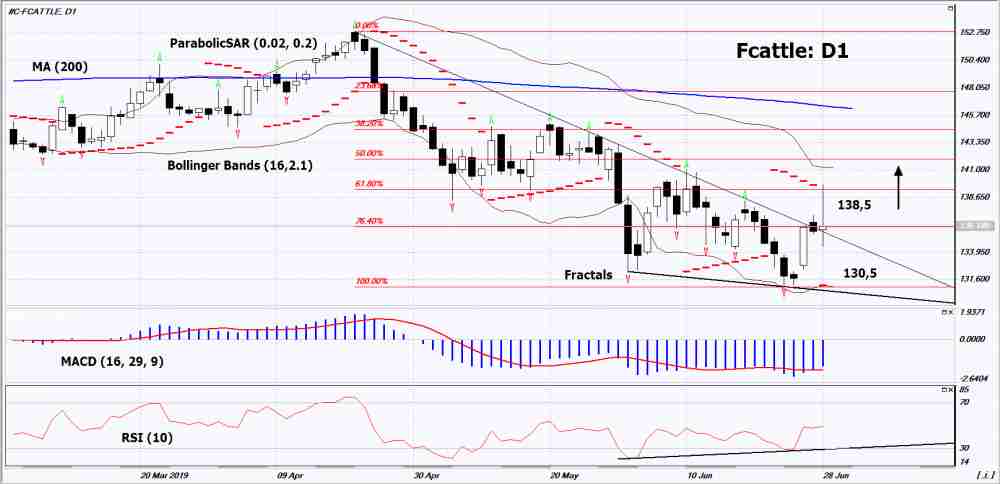
On the daily timeframe Fcattle: D1 broke up the downtrend resistance line. Various technical analysis indicators have generated uptrend signals. Further growth of quotations is possible in case of reduction in the number of cattle at feedlots in the USA.
The Parabolic indicator indicates an uptrend signal.
The Bolinger bands narrowed, indicating volatility decrease.
The RSI indicator is near the 50 mark. It has formed a divergence to increase.
The bullish momentum may develop in case if Fcattle exceeds its last upper fractal: 138.5. This level can be used as an entry point. The stop loss can be placed lower than the last minimum (since April 2018), the Parabolic signal, the lower Bollinger line and the last lower fractal: 130.5. After placing the order, the stop loss shall be moved following the signals of Bollinger and Parabolic to the next fractal minimum. Thus, we are changing the potential profit/loss to the breakeven point. More risk-averse traders may switch to the 4-hour chart after the trade and place a stop loss moving it in the direction of the trade. If the price meets the stop level (130,5) without reaching the order (138,5), we recommend to cancel the order: the market sustains internal changes that were not taken into account.
The G20 summit held in Japan over the weekend was once again upstaged by the meeting which took place along the sidelines between Trump and Chinese premier Xi Jinping.
The fresh outbreak of tariff increases between the two main global economies sent equities plunging. And the market was hoping that the leaders would come to an agreement as they had done at the end of 2018 in Argentina.
Trump Agrees to Refrain From Further Tariffs
Fortunately, these hopes were not in vain. Trump and Xi were able to quell rising investor uncertainty with a new pact.
Following the meeting between the two leaders, Trump told reporters:
“We’re right back on track. We’ll see what happens.”
Trump added that the pair had agreed to re-commit to trade negotiations. The President also removed the cloud that has been hanging over the markets recently by confirming that he would not be tariffing the remaining $300 billion of Chinese goods entering the US each year. He stated:
“I promised that for at least the time being we’re not going to be lifting tariffs on China. We won’t be adding an additional tremendous amount — we have $350 billion left that could be tariffed, taxed — we’re not going to be doing that.”
Trump Unexpectedly Backpedals on Huawei
While many were hoping for some compromise over tariffs, the market was taken by surprise by Trump’s change of heart over Huawei.Back in May, Trump had added Huawei to the “Entity List,” a list of companies which US firms are prohibited from dealing with without government approval.
The move was a major blow to the Chinese firm and markets reacted fearfully with heavy selling in equities. However, at the meeting over the weekend, Trump declared that “US companies can sell their equipment to Huawei.” In return, China agreed to purchase a “tremendous amount” of US food and agricultural products.
Trump Makes History & Meets Kim In North Korea
In a further surprise twist, in the wake of the G20 summit, Trump broke historic ground by becoming the first US president to set foot on North Korean soil. Following a spontaneous tweet where Trump suggested the possibility of the two leaders meeting, Kim extended the invitation to Trump.
The two leaders met at the demilitarized zone. Kim then escorted Trump for a short distance onto the North Korean side. The display has buoyed the markets and is an encouraging sign for Trump trying to achieve de-nuclearization of North Korea.
Equities are firming in response to news that the two leaders might meet again soon.
Market Soars on Trade War Optimism
The market reaction to these developments has been one of strong optimism. Risk assets are surging higher while safe-haven assets such as gold and JPY have fallen. The SPX500 hit fresh record highs shortly after the open, trading above the prior 2939.87 level to hit highs of 2976.03.
XAUUSD, meanwhile, has continued its sharp reversal lower from the 1433.48 level to trade 1388.19 last as safe haven flows dry up. However, the key to the follow through on these moves will be whether Trump and Xi are able to keep optimism alive.
Consequently, the market will now be paying close attention to the first set of trade talks following the meeting. Given that the negotiations after the November 2018 G20 meetings failed, the markets are wondering how long this optmism will last. Investors everywhere are hoping that this time, the superpowers finally reach a deal.
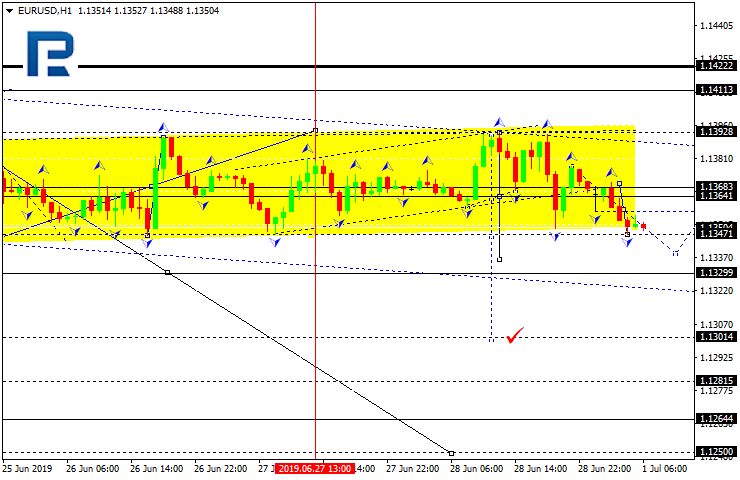
EURUSD has completed another descending structure towards the downside border of the consolidation range; right now, it is still trading downwards. Possibly, the pair may form a new consolidation range to break 1.1353. The short-term downside target is at 1.1313.
GBPUSD, “Great Britain Pound vs US Dollar”
GBPUSD has almost completed the correction. By now, it has finished another descending impulse; at the moment, it is consolidating above 1.2688. According to the main scenario, the price is expected to continue trading downwards with the short-term target at 1.2648.
USDCHF, “US Dollar vs Swiss Franc”
USDCHF is trading upwards to reach 0.9833. After that, the instrument may start another correction towards 0.9767 and then form one more ascending structure with the target at 0.9877.
USDJPY, “US Dollar vs Japanese Yen”
After reaching the target at 108.40, USDJPY is consolidating. If later the price breaks the range to the downside, the instrument may start a new correction towards 107.55; if to the upside – resume trading upwards with the target at 108.80.
AUDUSD, “Australian Dollar vs US Dollar”
After reaching the target at 0.7020, AUDUSD is forming the first descending impulse; it has broken the ascending wave’s channel. Possibly, the pair may form the descending wave with the first target at 0.6924.
USDRUB, “US Dollar vs Russian Ruble”
USDRUB has completed the correction at 62.95. Possibly, today the pair may grow to reach 63.43 and then fall to return to 62.95, thus forming a new consolidation range. If later the price breaks the range to the upside, the instrument may continue trading upwards to reach 65.00; if to the downside – form a new descending structure with the target at 62.30.
XAUUSD, “Gold vs US Dollar”
Gold has completed the descending structure at 1386.50. Today, the pair may start a new correction to reach 1407.33 at least. Later, the market may continue trading downwards with the short-term target at 1350.50.
BRENT
Brent is trading upwards. Possibly, the pair may reach 67.01 and then start another correction towards 65.35. After that, the instrument may form one more ascending structure with the target at 69.30.
Attention! Forecasts presented in this section only reflect the author’s private opinion and should not be considered as guidance for trading. RoboForex LP bears no responsibility for trading results based on trading recommendations described in these analytical reviews.
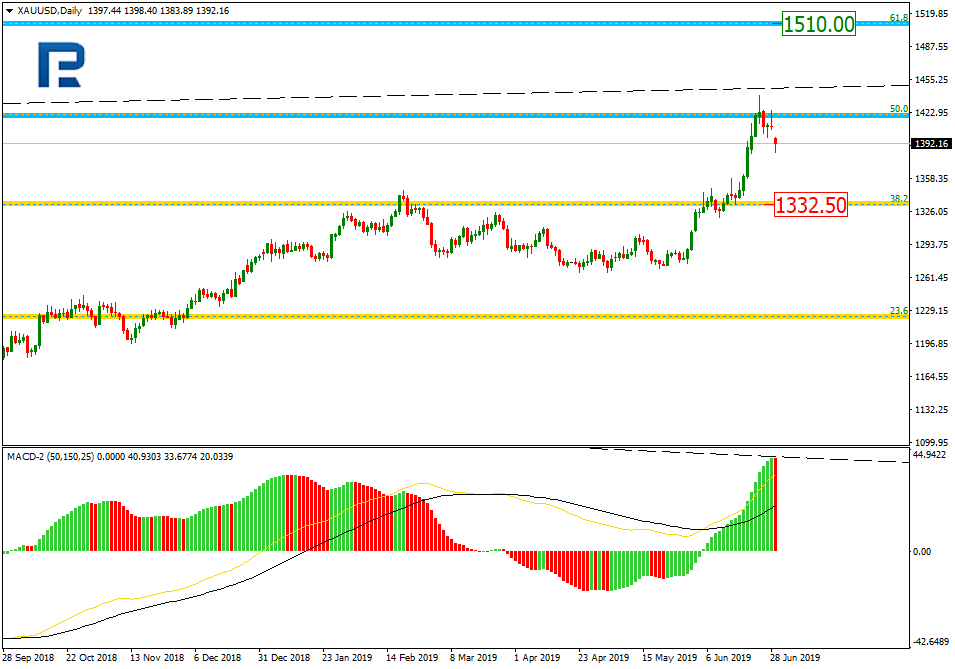
As we can see in the daily chart, the divergence made XAUUSD made reverse after reaching long-term 50.0% fibo and start a new decline. The downside target is short-term 38.2% fibo at 1332.50. Right now, it’s too early to think about a reverse. After finishing this descending correction, the price is expected to start another rising wave towards 61.8% fibo at 1510.00.
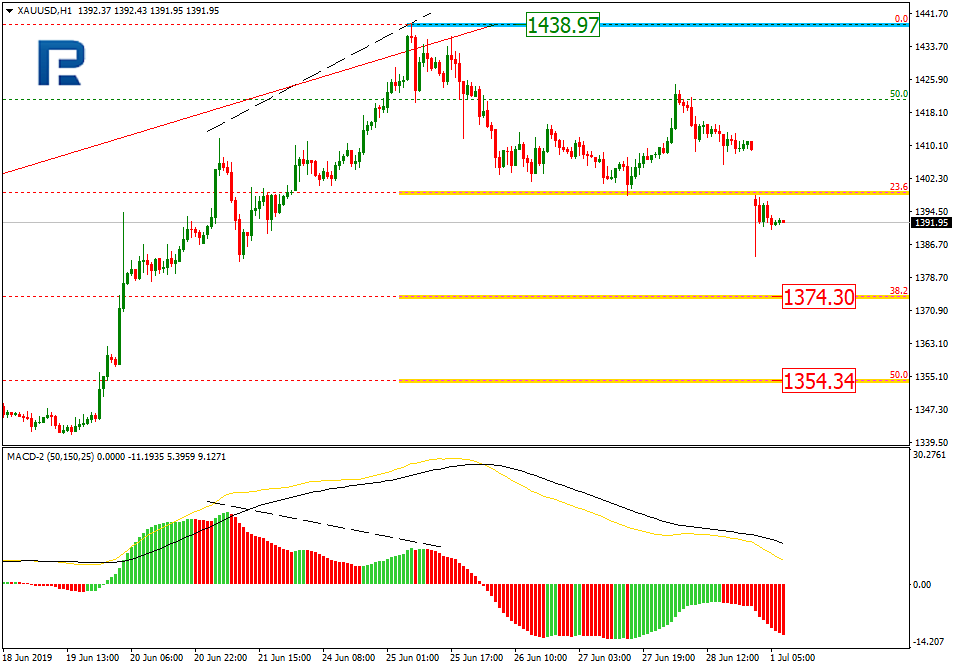
The H1 chart shows more detailed structure of the current correction. After breaking 23.6% fibo, the instrument may fall towards 38.2% and 50.0% fibo at 1374.30 and 1354.34 respectively. The resistance is the high at 1438.97.
USDCHF, “US Dollar vs Swiss Franc”
As we can see in the daily chart, after reaching 50.0% fibo, USDCHF is forming a new pullback. The resistance is at 23.6% fibo at 0.9988. After completing the pullback, the price may fall towards 61.8% fibo at 0.9588.
In the H1 chart, the correctional up trend continues; the pair has already reached 38.2% fibo and may continue growing towards 50.0 and 61.8% fibo at 0.9854 and 0.9892 respectively. The support is the low at 0.9693.
Attention! Forecasts presented in this section only reflect the author’s private opinion and should not be considered as guidance for trading. RoboForex LP bears no responsibility for trading results based on trading recommendations described in these analytical reviews.
The currency markets open to the new trading month of July. The major themes driving the currencies this morning include the weekend G20 summit.
Investors were waiting for a major breakthrough in the US-China trade talks. However, both parties agreed to continue with trade talks without announcing any major deals. The markets still remain hopeful that the two sides will reach an agreement.
Eurozone Inflation Rises in June
The flash estimates on the inflation data for the eurozone showed some optimism. Headline inflation increased 1.2% on the year ending June 2019. This was in line with market expectations. The core inflation rate also rose by 1.1% on the year in June, beating estimates of a 1.0% increase. The inflation data comes a few weeks ahead of the ECB meeting.
Euro Settles Flat Below $1.1400
The common currency held flat for a third consecutive day. This comes as price briefly tested the 1.1400 level before giving up the gains. We expect the currency pair to remain muted in the near term. The longer-term range of 1.1400 and 1.1200 remains in play. A breakout from this level will potentially confirm the upside bias in price.
WTI Crude Oil Dips Ahead of OPEC Meeting
Crude oil prices gave up some of the gains by Friday’s close. This comes ahead of the two-day OPEC meeting that starts today in Vienna, Austria. Some news reports indicate that OPEC will continue with its existing production cuts. Both Venezuela and Iran are currently cut off from the international oil markets due to the US-led sanctions. This raises concerns of a potential shortfall in OPEC production.
Will Crude Oil Correct Lower?
The current declines in crude oil remain somewhat muted compared to the price action over the past week. Still, the technical outlook remains somewhat bearish in the short term. If oil prices break down below the 57.50 level where support is likely to be formed, further declines could come. Alternately, to the upside, a continuation will see oil prices rising to test the $60 handle.
Gold Closes May with Solid Gains
The precious metal posted solid gains in May, rising over 7.8% on the month. Gold was the second best commodity, next to crude oil. The gains in gold, however, saw prices turning flat near the highs. For two consecutive days, gold prices have closed flat despite being a bit volatile.
Will Gold Continue to Extend Declines?
Friday’s price action indicates that there is scope for gold prices to post a decline. This was evident from the lower opening this morning. The minor support is at the 1404 level. If this level gives way, then gold could potentially post declines much lower. The next main support is seen at 1354 which could be tested in the near term. Alternately, if gold continues to consolidate near the current levels, we expect to see flat price action for the short term.