A study description and expected data readouts this year are provided in a ROTH Capital Partners report.
In a July 8 research note, ROTH Capital Partners analyst Yasmeen Rahimi reported that Enanta Pharmaceuticals Inc. (ENTA:NASDAQ) kicked off Q2/19 by launching the Phase 1a/b study of its core assembly inhibitor EDP-514 in hepatitis B.
Rahimi reviewed the study purpose and design. This first part of the trial is to evaluate safety and tolerability of once-daily EDP-514 in 98 healthy subjects. This will be carried out in two phases. In the first, a single administration of EDP-514 or placebo will be tested at six different increasing doses for eight days. Also, a two-part cohort will assess the potential effect of taking EDP-514 with and without food. In the second phase, participants will receive a multiple ascending dose or placebo for 14 days.
The study will also measure the pharmacokinetics of the inhibitor, “which we believe is important for confirming EDP-514’s compelling preclinical profile,” Rahimi noted. “Confirmation of good pharmacokinetics will strengthen the case for EDP-514 being able to hit the viral target as hard as possible.”
After the trial component in which EDP-514 is evaluated in healthy people, expected to be completed in December 2019, Enanta will then test the inhibitor in hepatitis B patients who have nucleos(t)ide analogue suppression.
Also expected from the U.S. biopharma in H2/19, specifically Q3/19, is a topline data readout for the FXR agonist EDP-305 in nonalcoholic steatohepatitis (NASH), “an important but underappreciated NASH catalyst,” Rahimi indicated.
Results from that trialARGON-1, Phase 2, 125 patients, 12 weeks and placebo controlledcould be announced at the end of this month. “We see H2/19 as a key catalyst period for Enanta as it moves beyond hepatitis C,” commented Rahimi.
ROTH has a Buy rating and a $130 per share price target on Enanta, whose stock is currently trading at around $88 per share.
Disclosure: 1) Doresa Banning compiled this article for Streetwise Reports LLC and provides services to Streetwise Reports as an independent contractor. She or members of her household own securities of the following companies mentioned in the article: None. She or members of her household are paid by the following companies mentioned in this article: None. 2) The following companies mentioned in this article are billboard sponsors of Streetwise Reports: None. Click here for important disclosures about sponsor fees. 3) Comments and opinions expressed are those of the specific experts and not of Streetwise Reports or its officers. The information provided above is for informational purposes only and is not a recommendation to buy or sell any security. 4) The article does not constitute investment advice. Each reader is encouraged to consult with his or her individual financial professional and any action a reader takes as a result of information presented here is his or her own responsibility. By opening this page, each reader accepts and agrees to Streetwise Reports’ terms of use and full legal disclaimer. This article is not a solicitation for investment. Streetwise Reports does not render general or specific investment advice and the information on Streetwise Reports should not be considered a recommendation to buy or sell any security. Streetwise Reports does not endorse or recommend the business, products, services or securities of any company mentioned on Streetwise Reports. 5) From time to time, Streetwise Reports LLC and its directors, officers, employees or members of their families, as well as persons interviewed for articles and interviews on the site, may have a long or short position in securities mentioned. Directors, officers, employees or members of their immediate families are prohibited from making purchases and/or sales of those securities in the open market or otherwise from the time of the interview or the decision to write an article until three business days after the publication of the interview or article. The foregoing prohibition does not apply to articles that in substance only restate previously published company releases.
Disclosures from ROTH Capital Partners, Enanta Pharmaceuticals Ltd., Flash Note, July 8, 2019
Regulation Analyst Certification (“Reg AC”): The research analyst primarily responsible for the content of this report certifies the following under Reg AC: I hereby certify that all views expressed in this report accurately reflect my personal views about the subject company or companies and its or their securities. I also certify that no part of my compensation was, is or will be, directly or indirectly, related to the specific recommendations or views expressed in this report.
ROTH makes a market in shares of Enanta Pharmaceuticals, Inc. and as such, buys and sells from customers on a principal basis.
ROTH Capital Partners, LLC expects to receive or intends to seek compensation for investment banking or other business relationships with the covered companies mentioned in this report in the next three months.
Bob Moriarty of 321 Gold explains why he is a fan of this PGE explorer with a project in Montana.
A couple of weeks back I was calling for a correction in gold. All of a sudden everyone was talking about gold and how high it was going to go. Bullish sentiment hit an absurd extreme. I got it right; the correction began the next day.
Investors tend to forget that even in the most bullish of markets, corrections are common and desirable. Since the high, sentiment has dropped a lot more than price. I see the bull resuming its run very soon. Late July tends to be one of the best times to be taking new positions in resource stocks.
There is a lot of low hanging fruit out there and there are many penny dreadfuls that are going to go up a lot higher than investors realize. One of my favorites in the palladium/platinum space has come down a lot since I wrote about them in February of 2018. At today’s price I find the company very attractive.
To fairly understand the incredible potential of Group Ten Metals Inc. (PGE:TSX.V; PGEZF:OTCQB; 5D32:FSE) first it is valuable to learn about their next-door neighbor in Montana, Sibanye-Stillwater. A South African company bought the Stillwater Mining Company in 2017 for a cost of $2.2 billion. For that they picked up a mining reserve of 20 million ounce Pt+Pd at a cost of $110 per ounce.
Fast-forward two years. Sibanye-Stillwater embarked on a major drill program and expanded the reserves to an incredible 80 million ounces at a grade of 16.8 g/t and put a third mine into production on the project.
In a masterpiece of timing, the Chairman of Group Ten, Greg Johnson, put together the Stillwater West project in June of 2017 just before the Sibanye purchase under a mostly share deal. It calls for PGE to own 100% of the project subject to a 2% NSR that can be bought down to 1% for a $2 million payment.
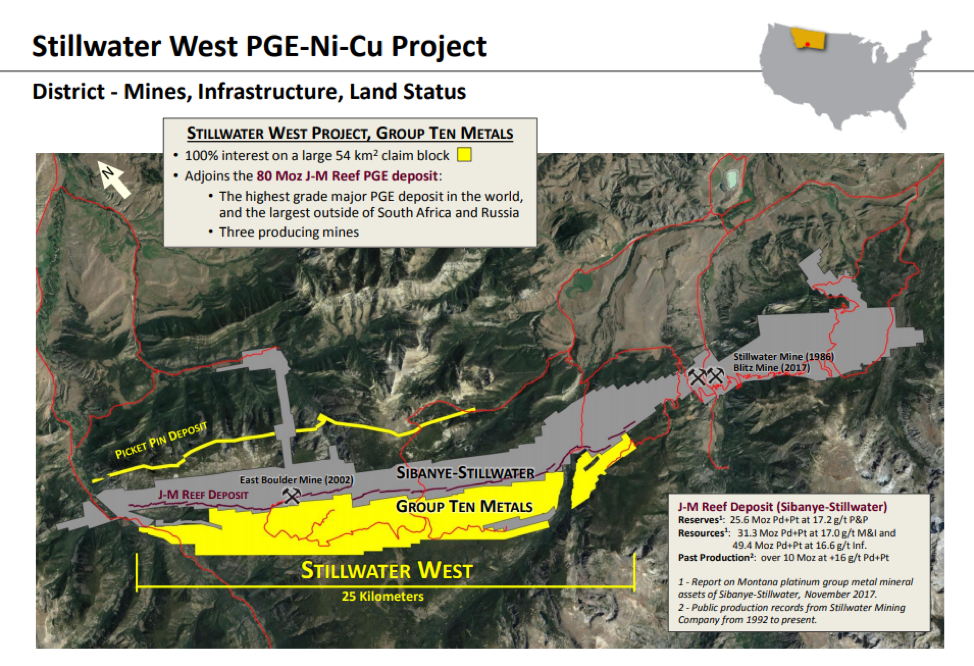
The agreement gave Group Ten a 25 km package of the lower Stillwater stratigraphy directly south of the Sibanye’s JM Reef deposit within the Stillwater Complex. The JM Reef is the largest PGE deposit outside of South Africa or Russia and is the highest grade PGE in the world.
Group Ten is the first company to have consolidated the lower Stillwater Complex into a single package. This allows PGE to put together all historic data so they can conduct a systematic exploration program. The company has spent the last eighteen months assembling and studying the data from 11,000 meters of drilling and groundwork.
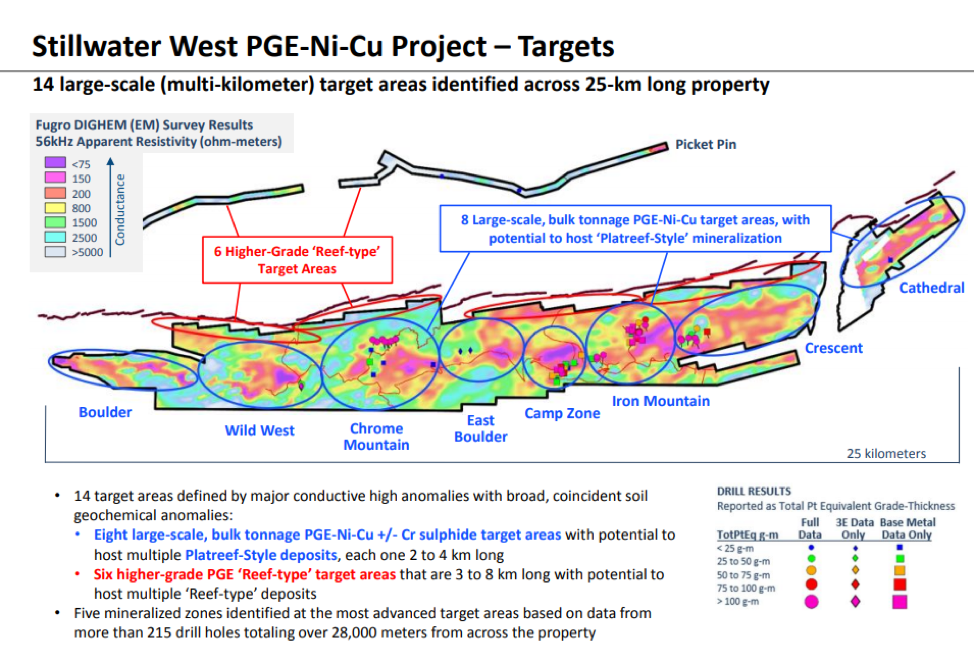
Progress to date has defined 14 large-scale projects that include 8 bulk tonnage “Platreef-Style” targets. These bulk tonnage areas compare in size to the 3-6 km individual deposits at Platreef. These Platreef PGE prospects are some of the largest and most profitable to mine PGE properties in the world. The industry is discovering that the bulk tonnage properties are far more valuable than the historic deep, narrow reef, high-cost mines in the Bushveld Complex in South Africa.
In 2019 Group Ten wants to focus on the three most advanced targets, Chrome Mountain, Camp Zone and Iron Mountain. Past drilling has shown continuous mineralized zones. Historic drill data shows PGE, nickel and copper with results of 50 to 200 meters of thickness with similar grade to the deposits of the Platreef in South Africa.
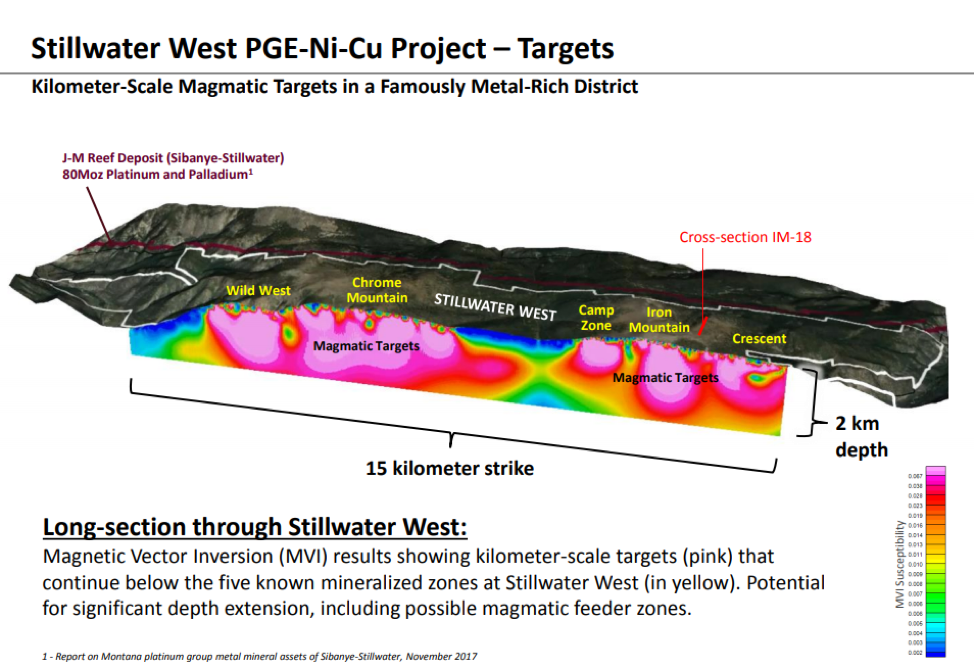
3D Modeling of the deposit indicates the magmatic layers at Stillwater West start at surface and may extend to kilometers of depth. Mineralization varies in thickness and depth with areas of thickening and higher grade termed “ballrooms” at Stillwater on the JM Reef and called “potholes” in the Bushveld. Platreef deposits are typically 2-6 km in width, which is comparable to the individual geophysical and geochemical targets at Stillwater West.
Company President and CEO Michael Rowley has laid out a staged drill program for 2019 to hit the best grade areas within the three most advanced projects. The company sees a potential for a multi-million ounce resource of platinum, palladium and gold with potentially more than a billion pounds of nickel and copper.
The initial drill program will cost $1 million to $1.5 million for a 5,00010,000 foot program necessary to define an initial 43-101 resource. With some additional funding the program could be expanded. Drilling should begin in August and continue through October. The company has brought in $350,000 in early warrant exercise and is in discussions with existing warrant holders to hopefully exercise the remainder of the outstanding $2.5 million in warrants. Should those warrants not be exercised, Group Ten would almost certainly do a private placement shortly.
I happen to be a giant fan of platinum right now. It is at the greatest discount to gold in history and is absurdly cheap. I don’t know how cheap palladium is, it has had a giant run. But all of the metals are about to embark on a historic run. There are only a handful of Pt/Pd junior companies to choose from and it sure looks to me as if Group Ten is the most attractive. Starting in September or so there will be assays coming out from the drill program. Sooner or later the market will get it and bid up the shares.
I was a buyer of shares in the open market at higher prices and I don’t mind adding to my position in here and averaging down. The company has excellent management, a brilliant technical team and one of the most undervalued mineral projects I have ever seen. Greg Johnson has done this before with great success.
Group Ten is an advertiser and naturally that makes me biased. I do own shares bought in the open market. Do your own due diligence.
Group Ten Metals PGE-V $0.15 (Jul 10, 2019) PGEZF OTCBB 62.1 million shares Group Ten website.
Bob and Barb Moriarty brought 321gold.com to the Internet almost 16 years ago. They later added 321energy.com to cover oil, natural gas, gasoline, coal, solar, wind and nuclear energy. Both sites feature articles, editorial opinions, pricing figures and updates on current events affecting both sectors. Previously, Moriarty was a Marine F-4B and O-1 pilot with more than 832 missions in Vietnam. He holds 14 international aviation records.
Disclosure: 1) Bob Moriarty: I, or members of my immediate household or family, own shares of the following companies mentioned in this article: Group Ten Metals. My company has a financial relationship with the following companies mentioned in this article: Group Ten Metals is an advertiser on 321 Gold. I determined which companies would be included in this article based on my research and understanding of the sector. 2) The following companies mentioned are billboard sponsors of Streetwise Reports: Group Ten Metals. Click here for important disclosures about sponsor fees. As of the date of this article, an affiliate of Streetwise Reports has a consulting relationship with Group Ten Metals. Please click here for more information 3) Statements and opinions expressed are the opinions of the author and not of Streetwise Reports or its officers. The author is wholly responsible for the validity of the statements. The author was not paid by Streetwise Reports for this article. Streetwise Reports was not paid by the author to publish or syndicate this article. The information provided above is for informational purposes only and is not a recommendation to buy or sell any security. Streetwise Reports requires contributing authors to disclose any shareholdings in, or economic relationships with, companies that they write about. Streetwise Reports relies upon the authors to accurately provide this information and Streetwise Reports has no means of verifying its accuracy. 4) The article does not constitute investment advice. Each reader is encouraged to consult with his or her individual financial professional and any action a reader takes as a result of information presented here is his or her own responsibility. By opening this page, each reader accepts and agrees to Streetwise Reports’ terms of use and full legal disclaimer. This article is not a solicitation for investment. Streetwise Reports does not render general or specific investment advice and the information on Streetwise Reports should not be considered a recommendation to buy or sell any security. Streetwise Reports does not endorse or recommend the business, products, services or securities of any company mentioned on Streetwise Reports. 5) From time to time, Streetwise Reports LLC and its directors, officers, employees or members of their families, as well as persons interviewed for articles and interviews on the site, may have a long or short position in securities mentioned. Directors, officers, employees or members of their immediate families are prohibited from making purchases and/or sales of those securities in the open market or otherwise from the time of the interview or the decision to write an article until three business days after the publication of the interview or article. The foregoing prohibition does not apply to articles that in substance only restate previously published company releases. As of the date of this article, officers and/or employees of Streetwise Reports LLC (including members of their household) own securities of Group Ten Metals, a company mentioned in this article.
In June, the gold price finally broke above the $1,400 level after five long years. So, who was responsible for pushing the gold price to a new high since 2013? Well, if we look at the data, it most certainly wasn’t the physical gold investor. And, according to several dealers I spoke with, physical gold retail investors took advantage of the $1,400+ price to sell metal rather than be big buyers… which I found quite interesting.
However, if we understand the psyche of the smaller retail investor, it’s not all that surprising. The retail physical gold investor tends to buy more metal when there is fear, financial instability, or extreme price volatility in the markets. So, if it wasn’t the physical gold investor responsible for the $1,400+ price move… then who was? It was the Paper Gold Buyer.
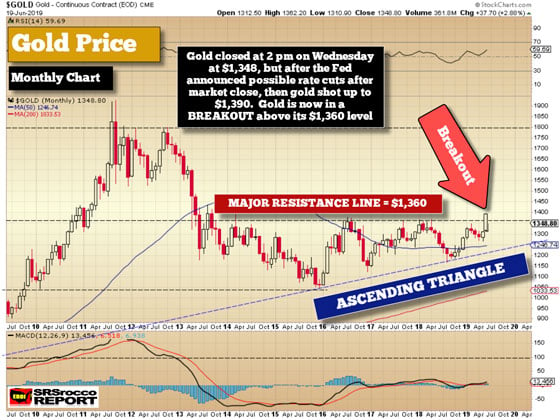
Thus, in a strange and odd sort of way, we can thank the Paper Gold Buyer for pushing gold above the critical $1,360 level that I wrote about in my article, FINALLY… GOLD BREAKS OUT THROUGH KEY 5-YEAR RESISTANCE LEVEL. Here we can see gold finally pushing through the key $1,360 level in this monthly chart:
As I mentioned in several articles, Traders, Hedge Funds, and Institutions look at crucial support and resistance levels, whether or not precious metals investors follow Technical Analysis. So, when gold finally broke above that $1,360 level, it shut up all the way to $1,440 before correcting. While the Technical Analysis pointed to a breakout above $1,360, it was the announcement by the Fed of possible rate reductions that caused Traders, Hedge Funds and Institutions to push gold to five-year highs.
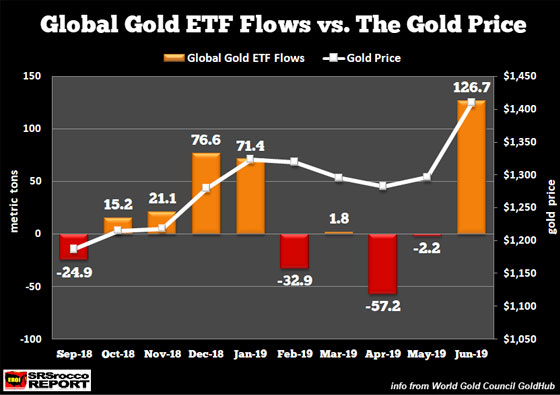
And, if we look at the Global Gold ETF Flow data put out by the World Gold Council, June 2019 had the highest amount of inflows for the past seven years:
We can see that when the broader markets were crashing in December 2018, the gold price shot up as well as the inflows into the Global Gold ETFs. However, after the Fed came back in and reassured the markets, along with the record 4 trillion Yuan pumped into the domestic Chinese market in January 2019 by China’s Central Bank (source: Mike Pento interview Greg Hunter), the gold price subsided in the following months as did the demand for Gold ETFs.
It wasn’t until the Fed did an about-face in June and announced that it would seriously consider cutting rates in July did the gold price spike above $1,400… due to huge paper gold demand on the COMEX and Global Gold ETFs. According to the World Gold Council, Global Gold ETFs experienced a 126.7 metric ton net inflow in June, the highest monthly amount in seven years.
Now, I don’t know if all the physical gold made it into these Gold ETF’s last month or if the custodians hold all the gold they report in their inventories. I am not a paper gold investor, but I look at what happens in the Global Gold ETFs as a BAROMETER of price and the market.
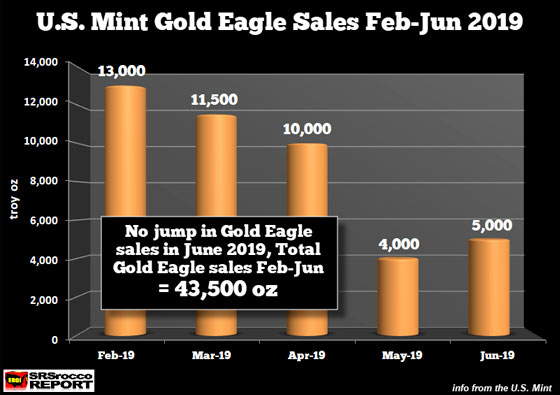
So, what did the retail physical gold investor do as the price hit a new high after five years? Well, it seems as if they took this opportunity to sell a lot of metal, quite the opposite of the Paper Gold Buyer. And we can see this in the very weak demand for the U.S. Mint Gold Eagles. The U.S. Mint reported sales of only 5,000 oz of Gold Eagles in June:
As we can see, Gold Eagle sales have been trending lower since the beginning of the year. I omitted sales in January because they usually are quite high due to the new issue being released. Regardless, demand for Gold Eagles continues to be weak, suggesting that the physical gold investor is not motivated to buy at this time.
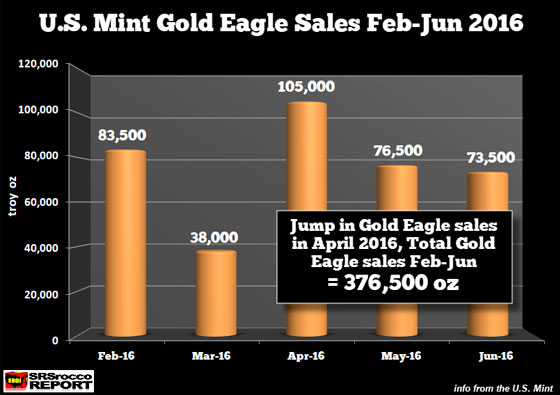
Of course, the figures reported by the U.S. Mint are for the Authorized Purchases, who sell to the public, but they are a good indicator of the overall demand by the physical investor. For example, when the announcements for England’s Brexit vote (to leave the European Union) as well as the Chinese Government Yuan-denominated gold benchmark in April 2016, the U.S. Mint Gold Eagle sales surged:
Sales of U.S. Gold Eagles rose to 105,000 oz, up from 38,000 during the previous month. Also, the gold price bottomed in January 2016 at $1,097 and surged nearly $200 to $1,285 by April. However, as the gold price increased to $1,366 in July 2016, Gold Eagle sales fell to only 38,500. So, it doesn’t seem like the short-term price rises are the primary motivation for the physical retail gold investor. Rather, retail physical gold investors tend to buy more when there is Fear, Financial Instability, or significant price volatility… such as gold reaching new highs or lows.
Also, if we compare the five months of Gold Eagle sales from 2016 to 2019, we see a striking difference:
Gold Eagle Sales Feb-Jun 2016 = 376,500 oz
Gold Eagle Sales Feb-Jun 2019 = 43,500 oz
Gold Eagle sales were more than eight times higher in Feb-Jun 2016 than they are this year. This suggests that the physical retail gold buyer is not the key driver of price; it’s been the paper gold buyer. That being said, I believe we are going to finally see a RECORD amount of physical gold buying when we see a huge increase in FEAR and FINANCIAL INSTABILITY as the economy and markets finally head over the cliff.
Precious metals investors need to understand that there are two Gold Markets… one physical and one paper. While we attribute manipulation and market rigging to the paper gold market, it has also been the leading driver of price, whether we like it or not. Sure, if investors could only purchase physical gold and not the hundreds of thousands or millions of COMEX Paper contracts and Gold ETF shares, then we would see a much higher gold price… but the entire market is set up that way.
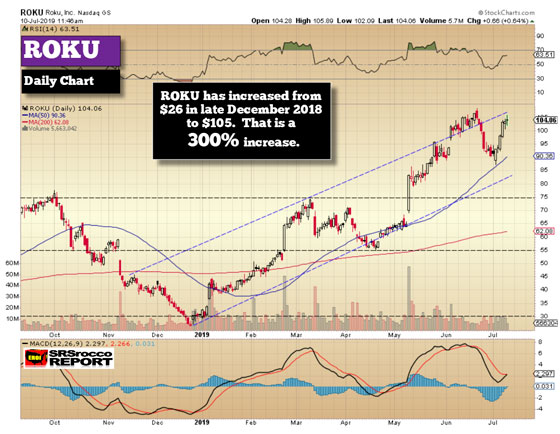
For instance, the U.S. Government creates money to either issue or buy back U.S. Treasuries. So, there isn’t just manipulation of gold and silver; IT’S EVERYWHERE. And, as I have mentioned, why would investors buy gold and silver right now when they can make 200-300% in stocks such as ROKU:
ROKU’s stock price is up 300% from its low in December 2018. ROKU still hasn’t made any real money, even though analysts say that it will take five years for the company to be profitable. I can assure you, that when the markets finally correct and the economy heads into an overdue recession (or possible depression), ROKU will not be making profits.
The gold price shot up today after Fed Chair Powell announced that a rate cut in July was still possible. Thus, the markets took Powell’s commentary as being very Dovish, which pushed the Dow Jones Index up 180 points at the high. This is the sort of insanity now that has taken over the market.
Lastly, when the Fed and Central Banks lose control of the markets, watch as physical gold and silver buying reach levels never seen before. While its highly likely the paper gold buyers will breaking new records in the COMEX and GOLD ETFs, the real winners will be acquiring the PHYSICAL METAL.
The Money Metals News Service provides market news and crisp commentary for investors following the precious metals markets.
Our researchers rely on a number of proprietary tools and cycle forecasting technology. Additionally, we use custom index charts to help measure price cycles, trends, support & resistance and many other aspects of the markets. Recently, we posted an article relating to the US Dollar and foreign currencies using custom index techniques. In the past, we’ve highlighted our Custom Price Cycle index that we use to gauge market sentiment, topping and bottoming setups. All of these tools are essential for our team of researchers while they attempt to identify trade setups and larger market events.
Currently, we are highlighting a number of our custom index chart that suggest a market top may only be 3 to 5 weeks away and the setup of this market top may surprise many traders. We posted a good forecast chart here also.
First, we’ll highlight our Smart Money Custom Index chart on a Monthly charting basis. As you can see since the ultimate price bottom in 2009, and using the price range from 2015 to 2016 (the rotation prior to the 2016 Presidential Elections) as the basis for the forward envelope, our Smart Money index shows the markets have rallied to levels just above the envelope in January 2018, then rotated lower to levels near the lower envelope levels in December 2018. This extended price rotation suggests the entire year of 2018 prompted a massive price rotation event that likely resulted in a price revaluation cycle.
Our researchers believe the strength of the US Dollar will continue to drive foreign investments into the US stock market and prompt a rally to levels near the middle of this price envelope before stalling and topping in August or September of 2019. This top formation should result in a price decline in the US stock market of at least 16% with a maximum decline level of somewhere between 24% to 28% overall. We’ll get into more detail about that later in this article.
We want our readers to understand this Custom Price Cycle chart highlights the level at which the price bottom will likely form, near the lower level of the current price envelope, and suggests the current price rally will likely attempt to breach key psychological price levels ($300: SPY, $3000: ES, $30k: INDU) before this new price top completes.
After these new price highs are reached above the key psychological price levels, we believe the new price top will immediately begin to form with a short period of sideways price action, then a price decline back below these psychological levels and likely initiating a downward price decline of at least 11 to 13%. It is our opinion that this downward price decline in the US stock market will align with increased global market weakness and currency devaluations that are likely to be much greater in scale and scope than the US stock market price decline.
We believe the US Dollar will continue to stay strong while staying above $95~96 throughout most of this price decline. We believe the strength in the US Dollar may be a catalyst for the future global market price declines and may also play out in future activities in precious metals and commodities.
The strength of the US Dollar, while foreign markets are contracting, would present a very ominous event as debt, credit and future operational standards of many foreign corporations, nations, governments, and consumers could come under severe pressures.
This Custom Price Cycle chart, below, highlights the current price setup of the US stock market in relation to previous high and low points. The closer we come to the upper price channel, the more likely we are to see price setup and seek out a price top formation. Although, history has shown that price can move up to these upper levels and continue to trend in an upward price channel for many weeks and months. So, at some point in the future, we would expect to see this Custom Price Cycle chart revert back to 2017 type price activity where price continually attempts to stay near the upper price channel levels with very mild price rotations.
Currently, though, we believe the US stock market is only 3 to 5 weeks away from a major price topping formation and that the downside price move will likely result in a, roughly, -16% to -25% downside price rotation before the end of 2019. We believe US earnings will push this Custom Price Cycle chart to levels near or above the upper price channel level and that will drive the US Dollar higher as well as a shift in capital deployment prior to the end of September. The shift will be away from technology and mid-caps and into the safety of cash, metals and large-cap equities.
This shift in capital investments will likely transpire over many weeks before a serious price breakdown begins. In other words, we expect a top formation to setup somewhere between August 15 and September 16. This top formation will likely result in 3~6 weeks of sideways downward pricing pressure before a larger price breakdown happens. We believe the larger price breakdown will coincide with some external economic event and result in a migration of capital away from risk and into cash/metals/safety. Right now, our estimate is that this external economic event may be a currency devaluation event (Asian currencies breaking down and putting pressure throughout Europe and the rest of the developing world).
It is very likely that some issue related to the US/China trade deal prompts this currency devaluation move or that some extended credit/debt crisis event becomes more evident to investors. We believe the Asian currencies are particularly at risk for this event and that European and development market currencies will likely collapse as a result of the Asian/European currency price declines.
The US technology sector could be uniquely vulnerable should this event unfold as we suspect. Foreign markets and investor are heavily invested in the US technology sector. Many of these investors have moved their capital into the US Technology sector to avoid risks related to their home country’s currencies and to take advantage of the US Dollar strength. A decline in the US stock market, of any level greater than 10%, could send a shock-wave through the global markets and cause investors to shift away from risk and into safety.
Expect to see the volatility index to start rising and for the price of options to jump as well. I posted this VIX chart and cycle analysis a couple of days ago and its good for another few weeks in terms of its direction.
IN CONCLUSION:
Our researchers believe we are only a few weeks away from this event and those Q2 US earnings will push the US stock market above these psychological price levels. It is this event, the push above the key psychological price levels ($ 300: SPY, $ 3000: ES, $ 30k: INDU) that will likely trigger the topping event and set off a chain reaction event that we have described.
Pay very close attention to how the foreign currency market reacts over this time-span and pay very close attention to Gold/Silver and the US Dollar. We believe this topping price formation is going to unfold just as we are suggesting and we believe this will be an incredible opportunity for skilled technical traders.
We’ll keep you informed as this plays out with Wealth Building & Global Financial Reset Newsletter if you like what I offer, join me with the 1 or 2-year subscription to lock in the lowest rate possible and ride my coattails as I navigate these financial market and build wealth while others lose nearly everything they own during the next financial crisis. Join Now and Get a Free 1oz Silver Round or Gold Bar Shipped To You!
I can tell you that huge moves are about to start unfolding not only in metals, or stocks but globally and some of these supercycles are going to last years. A gentleman by the name of Brad Matheny goes into great detail with his simple to understand charts and guide about this. His financial market research is one of a kind and a real eye-opener. 2020 Cycles – The Greatest Opportunity Of Your Lifetime
As a technical analysis and trader since 1997, I have been through a few bull/bear market cycles. I believe I have a good pulse on the market and timing key turning points for both short-term swing trading and long-term investment capital. The opportunities are massive/life-changing if handled properly.
IM GIVING THEM AWAY WITH 2-YEAR MEMBERSHIPS
So kill two birds with one stone and subscribe for one or two years to get your FREE BULLION and enough trades to profit through the next metals bull market and financial crisis!
China’s trade balance tends to rock markets everywhere! So even if you don’t follow the Yuan, this is still an important bit of data to keep track of.
The Chinese government has recently been talking up the issue of services exports. And this could change how the world views the Asian giant’s trade policy.
With the drama of the ongoing US-China trade issue getting all the headlines, let’s drill down to the underlying figures to get a better sense of how the market could react to the upcoming data release. The figure is extra important this time around because it’s the last major data ahead of the release of China’s Q2 GDP next Monday.
What We Are Expecting
The consensus among analysts is that the June balance of trade will come in at a surplus of $44.7B, up from the prior month’s $41.7B. This would bring it back in line with the average it has been maintaining for the last couple of years before the trade war started.
China’s trade balance has a history of showing extreme volatility around the end of the year. This is due to the effect of holidays both in China and in their major export markets. The balance then flattens for the rest of the year. If this level were to solidify around the $40B mark, it would be the first increase in annualized trade balance since 2014.
The Components
Last month, we had a surprise with the trade balance doubling expectations. This was driven primarily by the disconnect between exports and imports.
Exports rose by a modest 1.1%, while imports fell precipitously by -8.5%. This drop was primarily seen in metal commodities with a significant drop in copper and iron ore. (At the same time, iron ore and copper prices were reaching the peak of their cycle so far.)
The increase in exports might be a one-off, though. The reason for the beat of expectations is that companies were rushing to get their sales through customs before Trump’s tariff hikes would take effect. Now that the two countries are once again in a truce, the export number might slip. This is because shipments that would otherwise have left during June were already accounted for in May.
This would imply that the expectations of an increase in the trade surplus would not be met.
Cash Flows
Of course, the whole point of trade is to make money. And the issues relating to the cash flow are the ones that drive the currency markets. According to estimates, China holds about $3T in US “carry trade” assets, the product of the trade surplus and taking advantage of the interest rate differential between the PBOC and the Fed.
However, the Fed has been engaged in a tightening cycle. Meanwhile, its Chinese counterpart has been reluctant to follow suit due to weakness in the domestic economy. So, that differential has been closing.
To make matters worse, the decline of nearly 11% since March in the Yuan has made this trade unappetizing if not outright unprofitable.
With the continuation of the trade war, and the Fed less likely to cut rates as aggressively following the June NFP, there is increasing pressure for Chinese holders to liquidate their assets and demand dollars.
If exports slip again, this would put more pressure on the yuan. In turn, this would make the carry trade less interesting, opening the possibility of a vicious cycle.
Expectations are for Chinese exports to have dropped -7.7% since the prior year.
By CentralBankNews.info Serbia’s central bank lowered its policy rate by 25 basis points to 2.75 percent to support economic growth amid subdued inflationary pressures and an “increasingly likely” new round of monetary easing by the U.S. Federal Reserve and the European Central Bank (ECB). It is the first rate cut by the National Bank of Serbia (NBS) since April 2018, when it wrapped up a 5-year easing cycle from May 2013 after cutting cut the key rate by 8.75 percentage points. The central bank’s executive board said domestic and international economic developments, along with the future prospects, had set up the conditions for the rate cut, and the rate is now at the lowest level since NBS adopted inflation targeting as its monetary strategy in January 2009. After adopting inflation targeting, NBS was faced with inflation that topped 10 percent during 2011, 2012 and 2013. But in 2014 inflation finally fell and has now been below the bank’s target of 3.0 percent, plus/minus 1.5 percentage points for the last six years. In May inflation dropped to 2.2 percent from 3.1 percent in April, which NBS last month said was the peak for the year, after which inflation is expected to embark on a downward path and move within its target tolerance band – albeit in the lower part – until the end of this year and in 2020. Low and stable inflation confirms an environment of subdued inflationary pressures along with inflation expectations that fell in June to below the target midpoint. Internationally, slower economic growth and lower than expected inflation are the main characteristics, which is why the ECB and Fed first decided to slow their pace of rate hikes and now appear increasingly likely to embark on new monetary easing, NBS said. “A slower pace of normalization or a new round of monetary easing should have a positive impact on conditions in the international financial market and on capital flows to emerging markets,” NBS said, underscoring its oft-raised concern that Serbia could face higher borrowing costs in the event of disruptions in global financial markets that lead to a reversal of capital flows.
The National Bank of Serbia published the following statement:
“At its meeting today, the NBS Executive Board voted to cut the key policy rate to 2.75%.
Having analysed economic developments at home and abroad and prospects going forward, the Executive Board assessed that conditions have been met to cut the key policy rate to 2.75%, its new lowest level in the inflation targeting regime. The NBS thereby provides additional support to economic growth. Inflation has been kept firmly under control for the sixth year in a row. In accordance with the Executive Board’s announcements, in May it declined to 2.2% y-o-y. As underscored by the Executive Board, inflation will continue to move within the target tolerance band, most probably in its lower part, until the end of this and in the course of next year. Subdued inflationary pressures are also confirmed by the still low and stable core inflation, as well as financial and corporate sector inflation expectations, which declined further in June and are currently below the target midpoint.
Developments in the international environment are marked by slower economic growth and lower than expected inflation, which is why the ECB and the Fed first announced a slower pace of rate hikes, while now they appear increasingly likely to embark on a new round of monetary easing. The ECB extended the period over which it would keep its key interest rates on hold (at least through mid-2020) and announced other accommodative measures as well. Similarly, the Fed hasn’t raised the target range for the federal funds rate since last December, though market expectations of a rate cut until the end of the year are gaining traction. A slower pace of normalisation or a new round of monetary policy easing should have a positive impact on conditions in the international financial market and on capital flows to emerging markets. Besides, the global oil price declined and futures indicate it is likely to stay close to the current level by the end of the year as well.
The Executive Board stressed that the Serbian economy’s resilience to potential negative effects from the international environment has increased owing to the narrowing of internal and external imbalances and favourable macroeconomic prospects going forward. As in the past two years, public finances are posting a surplus, and in the first five months of 2019 the current account deficit has been fully covered by net FDI inflow. The Executive Board expects this year’s economic growth to be driven by domestic demand, i.e. investment and consumption, and that FDIs, which contribute to the increase in production and export capacities, will result in a gradual narrowing of external imbalances in the medium term.
The next rate-setting meeting will be held on 8 August 2019.”
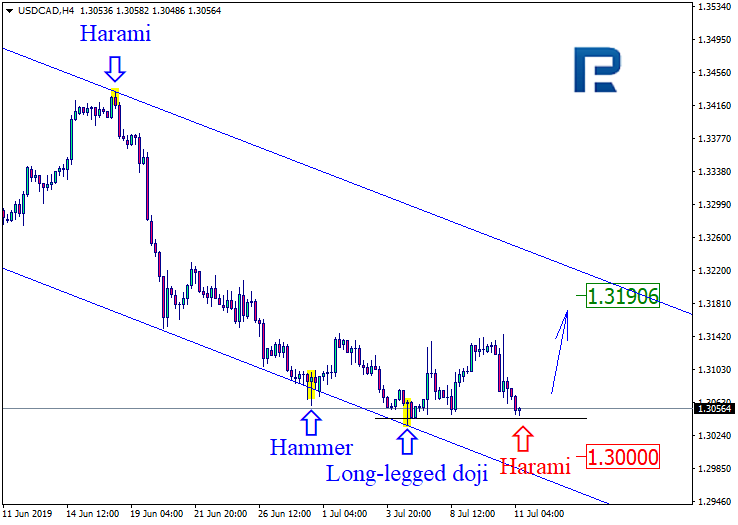
As we can see in the H4 chart, USDCAD is still testing the support level and forming Harami pattern while trading downwards. Possibly, after completing this reversal pattern, the price may rebound from the support level and start a new growth with the target at 1.3190. However, we shouldn’t ignore a possibility that the instrument may move sideways without reversing, break the support level, and continue its decline to reach 1.3000.
AUDUSD, “Australian Dollar vs US Dollar”
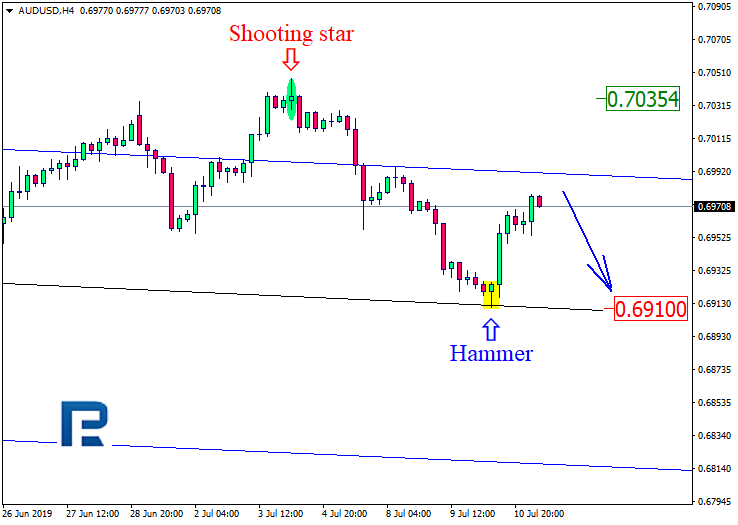
As we can see in the H4 chart, after testing another support level and forming Hammer reversal pattern, AUDUSD has rebounded towards the channel’s upside border. The current situation implies that the instrument may test the border, rebound from it, and resume falling towards 0.6910. However, we shouldn’t ignore a possibility that the instrument may break the resistance level and continue growing to reach 0.7035.
Attention! Forecasts presented in this section only reflect the author’s private opinion and should not be considered as guidance for trading. RoboForex LP bears no responsibility for trading results based on trading recommendations described in these analytical reviews.
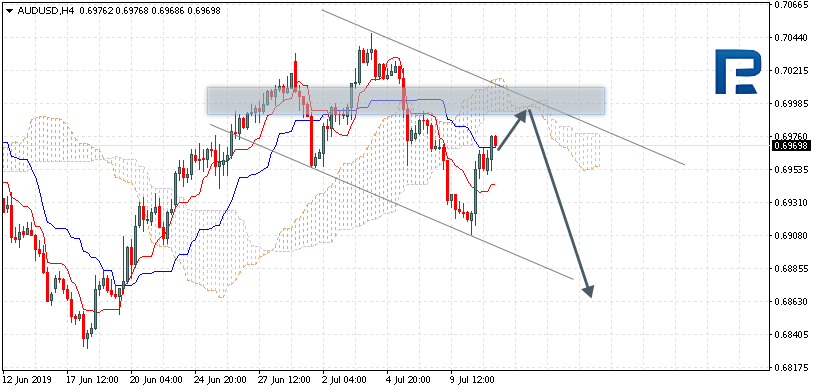
AUDUSD is trading at 0.6969; the instrument is moving below Ichimoku Cloud, thus indicating a descending tendency. The markets could indicate that the price may test the cloud’s downside border at 0.6995 and then resume moving downwards to reach 0.6865. Another signal to confirm further descending movement is the price’s rebounding from the descending channel’s upside border. However, the scenario that implies further decline may be cancelled if the price breaks the cloud’s upside border and fixes above 0.7020. In this case, the pair may continue growing towards 0.7085.
NZDUSD, “New Zealand Dollar vs US Dollar”
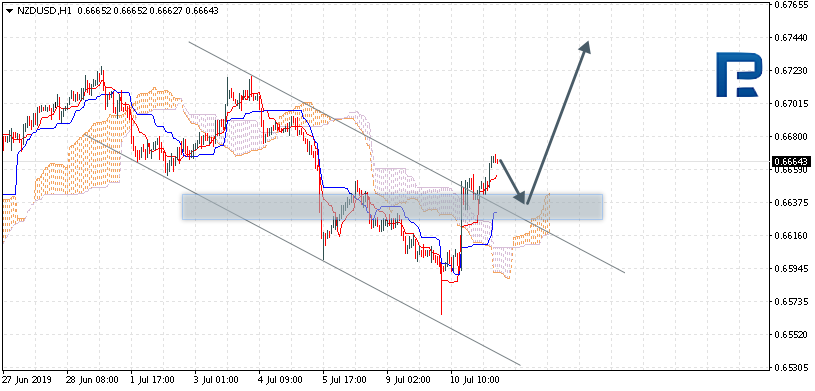
NZDUSD is trading at 0.6664; the instrument is moving above Ichimoku Cloud, thus indicating an ascending tendency. The markets could indicate that the price may test the cloud’s upside border at 0.6635 and then resume moving upwards to reach 0.6745. Another signal to confirm further ascending movement is the price’s rebounding from the descending channel’s upside border. However, the scenario that implies further growth may be cancelled if the price breaks the cloud’s downside border and fixes below 0.6595. In this case, the pair may continue falling towards 0.6505.
USDCAD, “US Dollar vs Canadian Dollar”
USDCAD is trading at 1.3055; the instrument is moving below Ichimoku Cloud, thus indicating a descending tendency. The markets could indicate that the price may test the cloud’s upside border at 1.3095 and then resume moving downwards to reach 1.2935. Another signal to confirm further ascending movement is the price’s rebounding from the resistance level. However, the scenario that implies further decline may be cancelled if the price breaks the cloud’s upside border and fixes above 1.3155. In this case, the pair may continue growing towards 1.3245.
Attention! Forecasts presented in this section only reflect the author’s private opinion and should not be considered as guidance for trading. RoboForex LP bears no responsibility for trading results based on trading recommendations described in these analytical reviews.
In this interview with Maurice Jackson of Proven and Probable, the president and CEO of this company describes the most recent developments at its Montana prospect.
Maurice Jackson: Joining us today is Michael Rowley, president and CEO of Group Ten Metals Inc. (PGE:TSX.V; PGEZF:OTCQB; 5D32:FSE), which is known for platinum, palladium, nickel, copper and cobalt in the Stillwater district in Montana.
Glad to have you back, sir. Michael, I can only imagine the excitement that your team and mostly prudent shareholders must be feeling as the press releases continue to show hit after hit of high-grade mineralization on your flagship Stillwater West Project. Today’s interview will be no different as we have more exciting results to provide shareholders. But before we begin, Mr. Rowley, please introduce us to Group Ten Metals and the opportunity the company presents to the market.
Michael Rowley: Thank you, Maurice; glad to be back. We are indeed looking forward to starting our work on the ground this year, which we expect will be a break out year for Group Ten with our first drill program following a year of compilation and targeting work.
Group Ten is one of two companies active in the Stillwater District in Montana, which is world-renowned for its mineral wealth. The Stillwater Complex is a layered magmatic intrusion that was formed about 2.7 billion years ago when successive pulses of metal-rich magma laid down multiple layers, then cooled and crystalized to become a package of rocks about 8 kilometers thick. Those layers have been tipped up by the mountains to the south and they now sit at an angle of about 60 degrees, which is very amenable to mining, and it means that mineralization we see at surface may continue for many kilometers down along the magmatic layers.
The other company active in the Stillwater complex is Sibanye-Stillwater Gold Ltd. (SBGL:NYSE), a company that was created when South African gold miner Sibanye bought Stillwater Mining in 2017 for $2.2 billion. They operate three mines on one depositcalled the Johns-Manville or J-M Reef depositwhich is the highest-grade platinum group elements (PGE) deposit in the world, and one of the largest, hosting 80 million ounces (80 Moz) of platinum and palladium at over 16 grams per tonne (16 g/t) grade. To put in perspective, we get excited when gold deposits have 10 million ounces at a couple of grams per tonne gold. The J-M Reef deposit is eight times that size and also eight times that grade. And it is open for expansion. It is a truly fantastic deposit, and it speaks to the amount of metal that is in the system at Stillwater.
Group Ten has a very large land position that adjoins Sibanye-Stillwater across about 25 kilometers and covers the lower portion of the Stillwater Complex. We also have claims above Sibanye in the layered geology.
We made our first acquisition there in 2017 and quickly expanded our holdings as we got into the data and saw the potential. As of today we have more than doubled that initial land position, compiled a terrific database that includes data from over 200 drill holes plus physical core, and geochemical and geophysical surveys. We are the first to bring the land position together with the database and that has attracted a world-class team that is familiar with new geologic models developed in a similar layered magmatic system at the Platreef in South Africa.
Maurice Jackson: Mr. Rowley, before we delve into the press release, can you provide a concise summary of the series of technical news releases Group Ten Metals has delivered starting in December 2018?
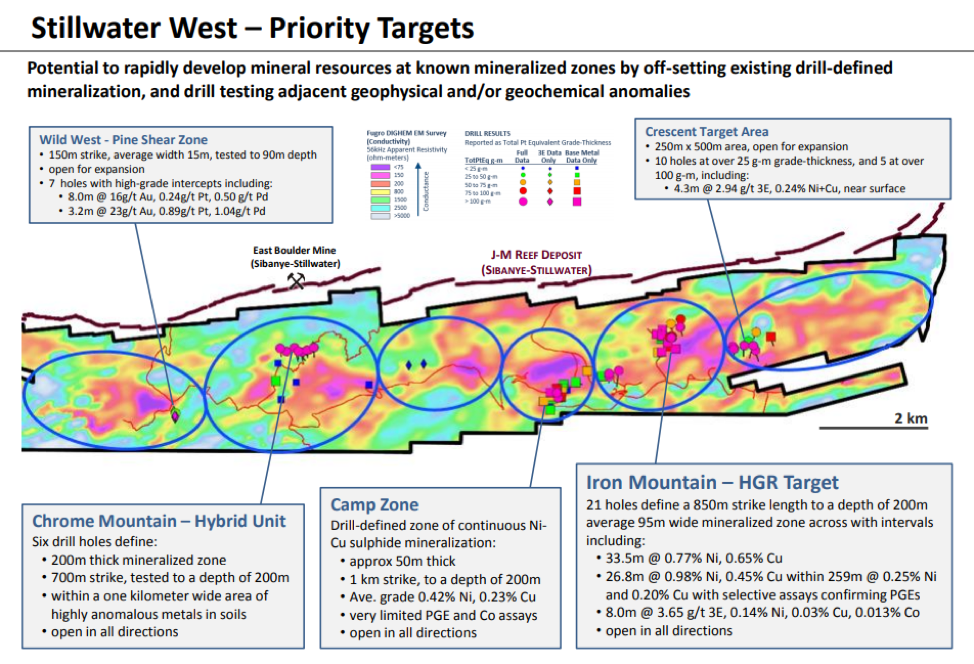
Michael Rowley: This is a big project and we have compiled a substantial database. Our early work defined 14 target areas, so we basically have gone west-to-east with a series of news releases detailing the eight bulk tonnage “Platreef-style” target areas shown in blue ellipses in our materials. These have attracted the attention of every major you can name based on their size and potential. We also have six higher-grade “reef-type” target areas, higher up the layered stratigraphy, shown in red.
Geologists get excited when the “three Gs”geophysics, geochemistry and geologycorrelate, and that is basically how we developed those eight target areas. In each target we see kilometer-scale geophysical anomalies (i.e., areas of highly conductive rocks) that correlate with large areas of high levels of metals in soils. And, where we have data, we see rock and drill data confirming that the conductive anomalies are indeed targeting copper and nickel sulfide mineralization.
Five of the eight target areas have a substantial amount of past drilling that defines known mineralized zones that are open for expansion in terms of both grade and size based on our data compilation and targeting work. The three most advanced of those areasthe Chrome Mountain, Camp Zone and Iron Mountain target areaswill be our focus for drilling in 2019 as we see the potential to quickly advance known mineralization in these areas to our first formal mineral resources at Stillwater West.
Maurice Jackson: Looking forward, the company issued a press release on the plans for 2019. What are goals for 2019?
Michael Rowley: Our news on June 4 sets the stage for our first drill programs in 2019, where we will focus on expanding known mineralization in priority target areas, and advancing those areas to formal mineral resources. We also, for the first time, will look deep into the Stillwater Complex with results of some 3D geophysical modelling work that shows continuity of those same mineralized zones to over several kilometers depth in some areas, which adds massive size potential to our targets.
Everything we have done to date confirms the potential for multiple large and very large polymetallic platinum, palladium, nickel, copper and cobalt deposits at Stillwater. We are calling these “Platreef-style” deposits based on the similarities we see with the Platreef district in South Africa, which has become a world leader in the supply of low-cost platinum, palladium, nickel and copper since the 1990s, with the development of Anglo American Platinum Ltd.’s (AMS:JSE) Mogalakwena Mine, and Ivanhoe Mines Ltd.’s (IVN:TSX; IVPAF:OTCQX) Platreef mine, which is now under construction. These are truly massive depositscollectively over 400 Moz of PGEs plus tens of billions of pounds of nickel and copperand they occur in the lower part of the Bushveld layered magmatic system.
That same portion of the Stillwater Complex has never been systematically tested for deposits of this type, even though the geological parallels are well known, the setting is correct, and every indication is there in the database, including drill results. That exploration process was basically interrupted at Stillwater.
We took a big step forward in 2018 when Dr. David Broughton, a key member of the discovery team at Ivanhoe’s Platreef project, joined our team and confirmed that potential at Stillwater West.
Maurice Jackson: Michael, take us now to the targets and exploration plans news release, which included some very exciting 3D modelling results.
Michael Rowley: We applied a technique called MVI, or magnetic vector inversion modelling, to our geophysical data. This is a cutting edge technique that has been very successful in recent years, especially at Platreef where it was instrumental in identifying an extension of Ivanhoe’s Platreef Mine, and also at a number of other projects including some porphyry systems.
The results show enormous size potential at Stillwater West. The magmatic layers that we see at surface, and that host those five drill-defined mineralized zones, appear to be continuous, and kilometers thick. At the east side, under the Cathedral and Crescent target areas, the magmatic layers may be one or two kilometers thick. As we move west it thickens to over three kilometers under Iron Mountain, which includes the HGR target, where we have our highest grades to date. And then at Chrome Mountain, farther to the west, we see over six kilometers deep in some areas, which gets very interesting as this may represent a possible feeder zone to the Stillwater complex. These become very compelling targets for drill testing when you consider the quantity of platinum, palladium, nickel, copper and cobalt seen elsewhere in the Stillwater Complexboth on our ground in our target areas, and also some hundreds of meters north in the J-M Reef deposit, where Sibanye-Stillwater is now mining at depths of up to about two kilometers.
In addition to reporting the potential for size going down along the magmatic layers of the system, the June 4 news release also summarizes the five known mineralized zones as defined by drilling to date, and shows the potential to expand these areas laterally. The key point here is that there has been no systematic drill test of the geophysical highs adjacent to these areas of known mineralization, which is to say that we see the potential to expand the mineralized bodies in these areas in terms of both size and grade by testing areas of highly conductive rock based on the relationship we see with conductivity and metal sulfide content.
We are now finalizing our drill plans for 2019, which will target those conductive high anomalies while also offsetting past holes to quickly advance known mineralized zones to our first formal resources in the three most advanced target areas. These are massive systems, and even a modest drill program can quickly add ounces of precious metals and pounds of base metals by tying together existing drill-defined mineralization and bringing the whole zone into a NI 43-101 qualified inferred resource. Those initial resources will then provide Group Ten an important base valuation to build on as we expand and build out those initial resources in future programs.
Maurice Jackson: Sir, what is the next unanswered question for Group Ten Metals? When should we expect results, and what determines success?
Michael Rowley: Our most recent news discussed our targets and permit status, so the next release is expected to be the start of work. We are currently in discussion with our major shareholders, who hold over $2.4M of in-the-money warrants, with an eye to funding this years’work. This is a very supportive group that we have a good rapport with and I look forward to reporting on the results of those conversations in the coming weeks as we ramp up to the start of field work. These are massive targets, and we have a terrific base to build upon. I think it will be an exciting year.
Maurice Jackson: Last question, sir. What did I forget to ask?
Michael Rowley: Perhaps we could touch on the markets, and the value proposition presented by Group Ten, which like a number of junior exploration stocks is really undervalued relative to our target commodities and a number of other metrics. Group Ten’s market cap is about $9 million at present, and yet we have great assets in three truly world-class districts. At Stillwater we share very rare geology and a famously metal-rich district with an asset that is valued at nearly $3 billion.
Another important consideration is the fact that Group Ten is focused on an American asset at a time when the U.S. is recognizing a need to secure supplies of strategic and critical metals within its borders. We saw this recently regarding nickel and cobalt and in the past year with a broader list of commodities that included PGEs. The Stillwater district has some of the absolute best geology in the world for a number of the commodities listedincluding nickel, cobalt, platinum and palladiumand we are right there beside three active mines.
Maurice Jackson: For someone listening that wants to get more information on Group Ten Metals the website address is www.grouptenmetals.com. And as a reminder Group Ten Metals trades on the TSX-V: PGE and on the OTCQB: PGEZF. For direct inquiries please contact Chris Ackerman at (604) 357-4790 ext. 1, and he may also be reached at [email protected].
Group Ten Metals is a sponsor and we are proud shareholders for the virtues conveyed in this interview. As a reminder, I’m a licensed representative for Miles Franklin Precious Metals Investments, where we provide a number of options to expand your precious metals portfolio from physical delivery, offshore depositories, precious metal IRAs and private blockchain distributed ledger technology. Call me directly at (855) 505-1900, or you may e-mail [email protected].
Michael Rowley of Group Ten Metals, thank you for joining us today on Proven and Probable.
Maurice Jackson is the founder of Proven and Probable, a site that aims to enrich its subscribers through education in precious metals and junior mining companies that will enrich the world.
Disclosure: 1) Maurice Jackson: I, or members of my immediate household or family, own shares of the following companies mentioned in this article: Group Ten. I personally am, or members of my immediate household or family are, paid by the following companies mentioned in this article: None. My company has a financial relationship with the following companies mentioned in this article: Group Ten. Proven and Probable disclosures are listed below. 2) The following companies mentioned in this article are billboard sponsors of Streetwise Reports: Group Ten Metals is a sponsor of Proven and Probable. Click here for important disclosures about sponsor fees. As of the date of this article, an affiliate of Streetwise Reports has a consulting relationship with Group Ten Metals. Please click here for more information. 3) Statements and opinions expressed are the opinions of the author and not of Streetwise Reports or its officers. The author is wholly responsible for the validity of the statements. The author was not paid by Streetwise Reports for this article. Streetwise Reports was not paid by the author to publish or syndicate this article. The information provided above is for informational purposes only and is not a recommendation to buy or sell any security. Streetwise Reports requires contributing authors to disclose any shareholdings in, or economic relationships with, companies that they write about. Streetwise Reports relies upon the authors to accurately provide this information and Streetwise Reports has no means of verifying its accuracy. 4) This article does not constitute investment advice. Each reader is encouraged to consult with his or her individual financial professional and any action a reader takes as a result of information presented here is his or her own responsibility. By opening this page, each reader accepts and agrees to Streetwise Reports’ terms of use and full legal disclaimer. This article is not a solicitation for investment. Streetwise Reports does not render general or specific investment advice and the information on Streetwise Reports should not be considered a recommendation to buy or sell any security. Streetwise Reports does not endorse or recommend the business, products, services or securities of any company mentioned on Streetwise Reports. 5) From time to time, Streetwise Reports LLC and its directors, officers, employees or members of their families, as well as persons interviewed for articles and interviews on the site, may have a long or short position in securities mentioned. Directors, officers, employees or members of their immediate families are prohibited from making purchases and/or sales of those securities in the open market or otherwise from the time of the interview or the decision to write an article until three business days after the publication of the interview or article. The foregoing prohibition does not apply to articles that in substance only restate previously published company releases. As of the date of this article, officers and/or employees of Streetwise Reports LLC (including members of their household) own securities of Group Ten Metals, companies mentioned in this article.
Proven and Probable LLC receives financial compensation from its sponsors. The compensation is used is to fund both sponsor-specific activities and general report activities, website, and general and administrative costs. Sponsor-specific activities may include aggregating content and publishing that content on the Proven and Probable website, creating and maintaining company landing pages, interviewing key management, posting a banner/billboard, and/or issuing press releases. The fees also cover the costs for Proven and Probable to publish sector-specific information on our site, and also to create content by interviewing experts in the sector. Monthly sponsorship fees range from $1,000 to $4,000 per month. Proven and Probable LLC does accept stock for payment of sponsorship fees. Sponsor pages may be considered advertising for the purposes of 18 U.S.C. 1734.
The Information presented in Proven and Probable is provided for educational and informational purposes only, without any express or implied warranty of any kind, including warranties of accuracy, completeness, or fitness for any particular purpose. The Information contained in or provided from or through this forum is not intended to be and does not constitute financial advice, investment advice, trading advice or any other advice. The Information on this forum and provided from or through this forum is general in nature and is not specific to you the User or anyone else. You should not make any decision, financial, investments, trading or otherwise, based on any of the information presented on this forum without undertaking independent due diligence and consultation with a professional broker or competent financial advisor. You understand that you are using any and all Information available on or through this forum at your own risk.
By Hussein Sayed, Chief Market Strategist (Gulf & MENA), ForexTime
The S&P 500 reached a new milestone high on Wednesday breaking above 3000 for the first time ever as Fed Chair Jerome Powell provided a clear case for cutting interest rates later this month during his testimony before Congress. The robust jobs numbers last Friday were not enough to scale back these bets. The US central bank sees the uncertainty around trade tensions as a key factor to lowering rates. That’s because businesses are holding back on new investments, keeping prices low, and are reluctant to increase salaries.
If these factors persist for a longer time, it will seriously risk the current economic expansion by dragging growth and inflation. That’s why Powell and his colleagues have made a case for an insurance rate cut.
The markets have clearly priced in an outcome of a 25-basis points rate cut in July. However, bets for a 50-basis points rate cut has increased significantly after Powell’s testimony and release of FOMC minutes. Investors now see the chance of 50-basis points rate cut at 29%, up from 7%. Expectations of an aggressive move by the Fed dragged US 2-year treasury bond yields 8 basis points lower, its biggest daily move in three weeks.
While a 50-basis points rate cut may no longer be ruled out, the risk of such a move is that it may send negative signals to markets. This may suggest that the US economic expansion is at a greater risk than what recent data is showing and may also be seen as political influence from the White House.
The U.S. Dollar lost almost all of its recorded gains after the release of Friday’s jobs report breaking below 97. If today’s US Consumer Price Index surprises to the downside, it will add additional pressure on the Greenback. Today’s US trading session is also heavy with Fed Speak. Chair Powell will give his second day of testimony before the Congress followed by speeches from Williams, Kashkari, Bostic and Barkin.
Gold seems to be the biggest beneficiary of the shift in global monetary policies. The yellow metal has climbed back above $1420 in today’s Asian trading session and is just $17 away from its key resistance level. A break above $1438 may lead to further buying orders with $1500 being the next level traders looking to target.
This time, a weaker Dollar did not translate into higher cryptocurrencies. The Bitcoin fell 13% from Wednesday’s high after Powell raised concerns on Facebook’s Libra. He said the Libra cannot move forward unless the social media group resolves serious concerns about the project. Whether bears will take over control or it’s just a minor setback remains to be seen. However, if scrutiny from financial regulators returns strongly, it may lead to further losses in the upcoming days.
Disclaimer: The content in this article comprises personal opinions and should not be construed as containing personal and/or other investment advice and/or an offer of and/or solicitation for any transactions in financial instruments and/or a guarantee and/or prediction of future performance. ForexTime (FXTM), its affiliates, agents, directors, officers or employees do not guarantee the accuracy, validity, timeliness or completeness, of any information or data made available and assume no liability as to any loss arising from any investment based on the same.