Ukraine’s central bank lowered its key policy rate by 50 basis points to 17.0 percent as it continues its cycle of easier monetary policy toward a rate of 8.0 percent as inflation gradually declines amid prudent fiscal policy, slower wage growth, relatively low energy prices and an ample supply of both domestic and foreign food products. In April the National Bank of Ukraine (NBU) took the first step onto a monetary easing path by cutting the rate 50 basis points after raising it six times by a total of 550 points between October 2017 and September 2018 to curb inflation from strong wage growth and consumer demand. But in June NBU paused after inflation topped its forecast two months in a row on a temporary spike in food prices. However, the central bank was still hoping to return to the easing cycle as underlying risk to inflation were falling. Although inflation dropped to 9.0 percent in June from 9.6 percent in May, consumer demand, production costs and higher administered prices are keeping it high and the central bank said this could slow the process of lowering the key rate to 8.0 percent. However, NBU still expects inflation to decline toward 6.3 percent by the end of 2019 and then return to its target range in early 2020, hitting the 5.0 percent target by end-2020. “The NBU’s baseline scenario envisages the key policy rate to decrease further, to 8% over the coming years, provide that inflation steadily declines to the 5% target,” NBU said, adding higher demand for domestic bonds and thus a higher exchange rate of the hryvnia would allow it to lower the policy rate faster than forecast. The central bank’s rate hikes last year helped boost the hryvnia and lower inflation expectations and continued tight monetary policy will remain the main driver in lowering inflation as it limits pressure from consumer demand. Since early September 2018 the hryvnia has strengthened and today it was trading at 25.96 to the U.S. dollar, up 6 percent this year and up 9.4 percent since Sep. 4 last year when the trend changed. On the back of strong consumer demand, expectations of a good grain harvest, NBU raised its forecast for economic growth this year to 3.0 percent from April’s forecast of 2.5 percent and the 2020 forecast to 3.2 percent from 2.9 percent. However, weak global activity and a decrease in gas transit to European countries from 2020 will still dampen economic growth and widen the current account deficit, NBU added. Ukraine’s gross domestic product grew 2.5 percent in the first quarter of this year, down from 3.5 percent in the previous quarter.
The National Bank of Ukraine issued the following release:
“The Board of the National Bank of Ukraine has decided to cut the key policy rate to 17.0% per annum effective 19 July 2019. The NBU continues the cycle of monetary policy easing as inflation is declining towards the target of 5%.
After temporary factors caused a deviation from the target in previous months, annual consumer price inflation came in at 9.0% in June 2019, approaching the trajectory of the April forecast.
Core inflation slowed to 7.4% in Q2, which was close to the NBU’s forecast.
The tight monetary policy remained a strong factor that held back underlying pressures on prices, in particular through strengthening of the exchange rate against currencies of trading partners and lower inflation expectations of households, businesses, banks, and financial analysts. At the same time, inflation remained relatively high due to the pressure from consumer demand, production costs, and rapid growth in administered prices.
Inflation will continue to decline gradually.
The NBU reiterates its forecast that inflation will decline to 6.3% as of the end of 2019, return to the target range in early 2020, and reach the medium-term target of 5% at the end of 2020.
The tight monetary conditions will continue to be the disinflation driver. Whereas the key policy rate is reduced gradually, its real value will remain high on the back of improved inflation expectations. High real interest rates will make hryvnia financial instruments more attractive for investors, which will support the exchange rate of the hryvnia. Moreover, such monetary policy stance will limit the pressure from consumer demand.
Other factors behind the gradual disinflation will include:
●a prudent fiscal policy
●the slowdown in wage growth
●relatively low energy prices in the global markets
●ample supply of domestic and foreign food products.
In 2019–2021, the economy of Ukraine will grow steadily, at 3%–4%.
The NBU has revised its economic growth forecast compared to the April macroeconomic forecast to 3% in 2019 (from 2.5%) and 3.2% in 2020 (from 2.9%) amid stronger domestic demand, more favorable terms of trade, and expectations of a larger harvest of grain crops.
Domestic demand will remain the main driver of economic growth over the coming years. Private consumption growth will decelerate, albeit remaining high owing to an increase in real household income – wages, pensions, and remittances from abroad. Capital investment will continue to grow rapidly, which will also provide significant support to the economy.
Economic growth will be dampened by a weak global economic activity and decrease in gas transit to European countries starting in 2020, due to the construction of bypassing gas pipelines.
The 2019–2021 current account deficit will stay within the bounds of reason.
In 2019, the current account deficit will narrow to 2.6% of GDP, thanks to the bumper grain harvest, a drop in energy prices, and a decline in dividend repatriation. In 2020-2021, the current account deficit will widen slightly, as a result of a decrease in natural gas transit, less favorable terms of trade, and stronger consumer and investment demand.
Further cooperation with the International Monetary Fund remains the basic assumption of the macroeconomic forecast.
This will allow Ukraine to attract other official financing, improve the conditions of access to the international capital markets, and support the interest of investors in Ukrainian assets. These borrowings will make it possible for the government to finance large payments on the external public debt. In addition, the private sector will get an opportunity to attract foreign investment.
As a result, international reserves will reach USD 23 billion in 2021.
The main internal risk to the above scenario is the further strengthening of threats to macrofinancial stability.
A delay in implementing key reforms or steps offsetting previous achievements (in particular, court rulings or legislative decisions) might increase the vulnerability of Ukraine’s economy and become an obstacle to further cooperation with the IMF. That could affect exchange rate and inflation expectations as well as the access to international capital markets as Ukraine will face a heavy debt load in the coming years.
The following risks also remain important:
●a suspension of Russian gas transit through Ukraine starting in 2020
●an escalation of trade wars and rising geopolitical tensions
●an escalation of the military conflict, and the imposition of new trade restrictions by Russia.
Considering the revised macroeconomic forecast and the balance of risks, the NBU Board has decided to lower its key policy rate to 17.0%.
The NBU has also approved the decision to start publishing the interest rate forecast when making quarterly reviews of the macroeconomic forecast beginning today.
Publishing the interest rate forecast marks an evolutionary improvement in transparency of monetary policy at central banks that apply inflation targeting. This makes the monetary policy more clear and predictable for market players, thus boosting its effectiveness.
It should be noted that the forecast imposes no obligations on the NBU, and thus the actual key policy rate may differ from the forecastifmacroeconomicconditionschange.
The NBU’s baseline scenario envisages the key policy rate to decrease further, to 8% over the coming years, provided thatinflation steadily declines to the 5% target.
The largest decrease is expected over 2020, along with inflation returning to the target range and inflation expectations improving.
If existing inflation risks, both internal and external, materialize, the key policy rate could decline to 8% more slowly. At the same time, higher demand for hryvnia domestic government bonds from nonresidents and the subsequent strengthening of the exchange rate will allow reducing the key policy rate at a faster pace than envisaged in the baseline scenario.
The decision to cut the key policy rate to 17.0% has been approved by NBU Board Decision No.493-D On the Key Policy Rate dated 18 July 2019.
A new detailed macroeconomic forecast will be published in the Inflation Report on 25 July 2019.
A summary of the discussion by Monetary Policy Committee members that preceded this decision will be published on 29 July 2019.
The next meeting of the NBU Board on monetary policy issues will be held on 5 September 2019 asscheduled.”
Ron Struthers of Struthers’ Resource Stock Report discusses the gold bull market and one company that he believes investors should take a look at.
The World Gold Council issued its mid-year outlook last week and trends are very bullish. It states the central banks across the globe have signaled a more accommodating stance, bringing bond yields to multi-year lowsand in some countries all time lows. Central banks continue as big buyers in the market, accumulating approximately 247 tonnes though May. Gold-backed ETFs captured US$5 billion or 108 tonnes year to date, led by European funds.
Global monetary policy has shifted 180 degrees and will continue to be a driving force toward higher gold prices and gold equities. Gold and gold stocks have technically been in a bull market since the bottom in late 2015. From the $1050 bottom in gold, late 2015, prices ran up to $1360 in about 6 months to July 2016.
That is a 30% rise, easily qualifying as a bull market, which is defined as a 20% rise. At the recent high of $1441, the price is up 37% from that low and up 22% from the $1180 low in 2018. No matter how you slice and dice it, gold has started a new bull market.
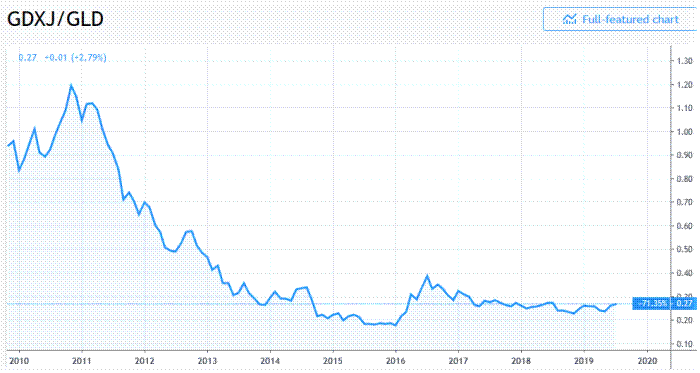
All bull markets start with skepticism and disbelief. Many use the GDXJ (VanEck Vectors Junior Gold Miners ETF) to gold price ratio as a measurement and I believe it is an accurate indicator of sentiment with gold stocks. Today’s reading at 0.27 is not much above the 0.20 bottom in 2015 and has not responded much at all to the recent rally in gold.
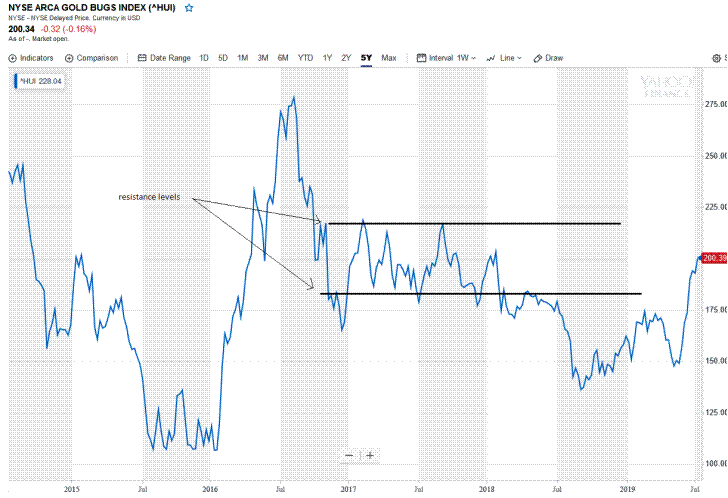
The HUI (NYSE ARCA Gold Bugs Index) around 200 has just made fresh highs in this rally. It is up 34% since the 150 low in May and up 87% from the 2015 low. However, as sentiment above shows, there is little belief in this rally so far.
The HUI consists of more senior gold producers and this index leads the junior explorers. The index has cleared the first resistance and a little further and it will breach the second resistance level. This is about the level that sentiment will start to improve and the junior explorers start moving. The juniors can move several 100% in just a small move on the HUI, as we witnessed in 2016. This is setting up to happen again. Now is perfect timing to buy quality junior explorers, the ones that will appreciate the most.
I have come across another exceptional junior explorer and now is perfect timing to get a position in this stock. It has an excellent property in Nevada that has not seen a targeted drill program since 2002, despite multiple high-grade intercepts. Back then, we were at the depths of the gold bear market when gold had dropped under $300 per ounce. Initial drilling by Placer Dome, a senior company since bought out by Barrick and Teck Cominco, hit some high grade intersects.
Old subscribers will remember the fortunes we made with Franco Nevada and Euro Nevada back in the 1990s as penny stocks. I mean buying at $1 to $3, which was considered a gold penny stock in those days.
What first drove the early success of Franco Nevada was the famous Ken Snyder Mine that is still in production today as the Midas Mine. Blackrock Gold Corp.’s (BRC:TSX.V) property is near Midas with the same kind of structures, but has seen little exploration since 2002. It has the potential to be a company maker just like the Midas.
Shares outstanding 49 million approx. Fully diluted 66.1 million
Highlights
new management recently took control of company
strong insider buying
low-sulphidation epithermal gold & silver property on prolific Nevada gold belt
little exploration since 2002
no follow up work despite high grade drill intercepts (157 g/t over 1.5m)
financing completed and exploration programs underway
first targeted drill program to commence by Fall to follow up high grade intercepts by Teck and Placer
Management
Blackrock has a very strong management team that joined/took control of the BRC in the past several months.
For nearly fifteen years, Andrew Pollard, CEO, Director, has established himself as a sought-after management consultant within the mining industry. Mr. Pollard founded the Mining Recruitment Group Ltd (MRG) in 2006 and has amassed a “Who’s Who” network in the mining and finance world, leveraging his personal relationships to help shape what have become some of the most prominent and successful resource companies. In a sector where management is crucial, he has served as a trusted advisor to exploration companies and producers ranging in size from seed round to over $100 billion in market cap.
William (Bill) Howald, Executive Chairman, is a successful entrepreneur who founded several public companies as well as led the exploration division of a major mining company. He has over 34 years of experience building effective exploration teams and delivering quality resources. As an executive, Mr. Howald provided strategic vision, planning, and implementation of many value-creating programs for junior and senior gold producers. Most recently, he led the acquisition, build out and start-up of the Florida Canyon mine in west-central Nevada. The mine achieved commercial production within 18 months. To date, Bill has raised approximately $300 million for properties in Argentina, Brazil, Chile, Peru, Dominican Republic and Nevada.
Prior to creating junior mining companies, he was GM of Exploration, the USA and Latin America, for Placer Dome. During his tenure at Placer Dome, Mr. Howald was an integral part of the teams that delivered over 100 million ounces of gold resources to the Placer portfolio. Several of these, including Turquoise Ridge, Pipeline, Pueblo Viejo, are now mines. While there, he also oversaw the last drill campaign on Silver Cloud.
Tony Wood, director, currently serves as CFO of Aurania Resources Inc. Mr. Wood’s executive experience includes oversight of finance and operations of various publicly traded exploration, development and production staged resource companies. Over the last 20 years, he has successfully completed close to $1billion in financing and M&A transactions in the mining industry. Mr. Wood has a proven record of success with strategic planning, organizational development and company transformations. Mr. Wood is an honors graduate, Management Sciences (Marketing) B.Sc. from the University of Lancaster, U.K., and a qualified Chartered Accountant in the UK and Canada.
Mr. Hendrik Van Alphen, director, has over 30 years of experience in the mining industry. He has been a key player in such companies as Corriente Resources, Cardero Resources, Trevali Mining, Balmoral Resources and International Tower Hill Mines. During his career Mr. Van Alphen has been involved in raising over $1 billion in financing for various junior resource companies. He has been president and CEO of Wealth Minerals Ltd. Since 2005 . My comment: These juniors were all big success stories.
Dr. Alan Carter, director, has 30 years of experience in the mining and minerals exploration industry. He spent seven years working for Rio Tinto Corp. in South America and the United Kingdom, and, in 1996, he became president and CEO of Balaclava Mines. Dr. Carter joined Billiton Plc in 1998 and in 2000 moved from Lima, Peru, to Vancouver. Dr. Carter was president and CEO of Magellan Minerals Ltd. until its recent sale to Anfield Gold Corp. in May 2016. He is a director of Peregrine Diamonds Ltd. and Anfield Gold Corp.
The management group at Blackrock has been involved in numerous discoveries that became mines and have been instrumental in raising considerable sums for exploration.
Property
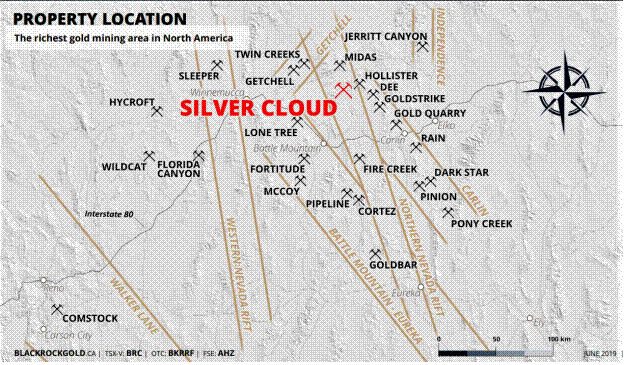
The Silver Cloud property is a large, 4,537 hectare (11,210 acre) claim block, strategically located near the confluence of the Carlin Trend and the Northern Nevada Rift within north-central Nevada, the richest gold mining area in North America. The property is located 8 km (5 miles) west of the Hollister mine, which has a Measured and Indicated Resource of 0.43 Mt @ 16.6 g/t gold. Hecla’s Midas Mine lies a short 20 km (12.5 miles) along strike of the Rift to the north of Silver Cloud and has a Measured and Indicated Resource of 1.11Mt @ 12.9 g/t gold (for 419,000 oz Au).
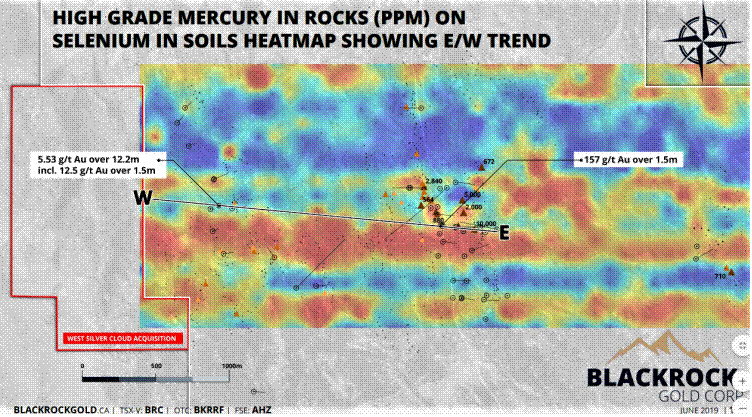
Silver Cloud, like both Midas and Hollister, is a low-sulphidation epithermal Au-Ag banded vein deposit. At Silver Cloud, despite the extensive presence of mercury-bearing silica sinters on surface, the property has not been extensively or systematically drill tested. However, a limited drill program completed by Teck (10 holes) between 1999 and 2001 encountered 157.7 g/t Au over 1.5 meters immediately below the Silver Cloud Mine area, and subsequent to that, in 2002, Placer-Dome drilled 5.53 g/t Au over 12.2 meters in the Northwest Canyon target area, confirming the presence of high grade gold mineralization at depth.Neither of these intercepts were ever followed up.
Near the end of June BRC identified a new vein system in the northeastern portion of the Silver Cloud property, noted above in top right. The east-west banded vein was found by mapping an area with highly elevated silver (up to 7.4 grams per tonne (g/t) silver), arsenic (up to 94.5 parts per million (ppm) arsenic), lead (up to 39.8 ppm lead) and zinc (133 ppm zinc). These values were returned from the company’s recently collected soil samples.
Assays are pending from rock chip samples collected on the outcropping vein. The gravity anomaly in this area is similar in scope and dimension to the one occurring over the Silver Cloud mine.
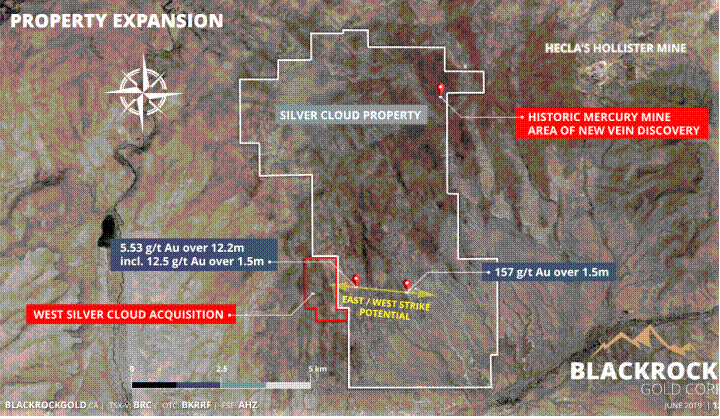
At the Silver Cloud mine, located approximately five kilometers to the south of the newly discovered vein, the high-grade gold drill intercepts (1.5 meters grading 157.7 g/t gold and 12.2 meters grading 5.53 g/t gold, including 1.5 meters grading 12.5 g/t gold and 1.5 meters grading 12.5 g/t gold) were encountered at elevations similar to the Midas and Hollister mines.
Mercury is related to gold and the graphic below shows the mercury in rocks or heat map trending eastwest between the two high grade intersects. This work was completed in the past year and further confirms the east-west direction of structures.
The old drill intersects align at the same elevation along an east-west zone with 1,500 meters of strike potential. BRC is planning a drill program to test the east-west theory and it will be the first systematic drill program to Silver Cloud in nearly 15 years. BRC is also focused on the northeast section of the property, which represents the westernmost extension from Hecla’s Hollister mine. This area is host to another past-producing mercury mine and a soil geochemical survey carried out in May of 2018 showed elevated silver readings, making this never-before-drill-tested section of the property a priority for BRC.
After Teck and Placer Dome, the project was with Allied Nevada, which made another discovery on one of Carl Pesico’s projects that kept it occupied. Then the property reverted back to the original vendor, Carl Pesico, who first staked the claims in 1998. Blackrock first optioned the property in 2017 but the previous management and with poor market conditions were unable to advance the project very far. The new management team amended the original agreement with more favorable terms in June of this year. Blackrock can purchase 100% of the project subject to a 3.5% royalty for $3.5 million any time prior to Oct. 27, 2023. Annual payments to keep the agreement in good standing begin Oct. 27, 2019, at $75k.
Oct 27 2020 $100k
Oct 27 2021 $150k
Oct 27 2022 $200k
Oct 27 2023 $500k
Blackrock can keep the option valid for another five years with payments totaling $5 million.
Financial
Last financials at end of April reveal little cash of $17,880 and no long-term debt. Since then a $600,000 private placement was completed at 10 cents per unit which included 1/2 warrant, priced at 16 cents, good until June 17, 2022. CEO Andrew Pollard participated for 1 million units.
This funding will be ample for BRC’s current exploration program and some shallow drill holes. I suspect BRC will complete another financing at higher prices before or during the start of a drill program. This would enable it to continue drilling upon a discovery. I do not expect that BRC will have any trouble raising more funds with this strong management group and property.
Summary
The new management group that took control of Blackrock is quite impressive. One of the first things it did was cancel a 5 cent financing to do it at a higher price of 10 cents. Very rare to see this, especially in recent markets. Insiders could have lined their pockets at 5 cents but instead bought shares in the market.
Management and insiders have been gobbling up stock since mid-May up to current prices, as you can see with insider trading filings here. They are walking their talk.
The Silver Cloud property is in a prestige location. It is quite amazing that it has seen little exploration in almost 20 years given its location and very excellent early results by majors Placer Dome and Teck. This makes it a unique opportunity we can take advantage of.
BRC’s recent ground geochemical and geophysical work confirms east/west vein trends. Both Placer and Tech were drilling based on north/south. Bill Howald did the work for Placer and he is now convinced the structures are east-west and they drilled the wrong way. If this is correct, a big discovery can be made. Regardless, I think the stock will run on the speculation.
A comment by executive chairman Bill Howald in a recent news release provides a nice summary of the project potential. Bold highlighting is my doing. “The newly identified vein gives the company a third meaningful target to explore. The three targets include the Silver Cloud mercury mine, the Jackson and Surprise mercury occurrence, and the newly discovered banded vein. In all these areas, the target is a high-grade gold and silver vein system with widths similar to the Midas mine (one metre to 2.7 metres width) and gold grades comparable to the nearby Hollister mine (plus 15 g/t gold and plus 80 g/t silver). The company is preparing the east-west-trending Silver Cloud mine/Northwest Canyon vein system for a drill campaign and has started the permitting process. The addition of the West Silver Cloud property provides additional strike potential to the west of Northwest Canyon. As I have stated before, the Silver Cloud project is an excellent under explored asset located in an extraordinarily productive part of north-central Nevada along the Northern Nevada rift.”
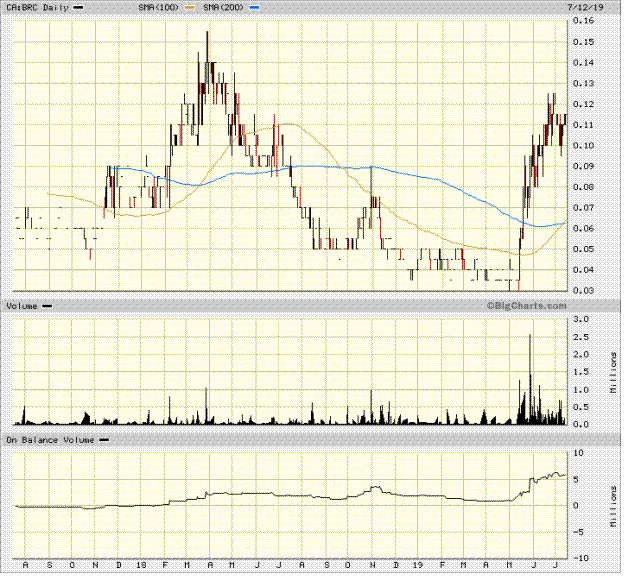
On the chart below we can see that a new uptrend has begun. The stock has crossed the 200 day MA and that average has turned up. A golden cross has just occurred where the 100 day MA crossed above the 200 day MA. A very bullish and reliable indicator. The volume of the last three months is the highest in the stock’s history and the OBV (on balance volume) indicator confirms heavy accumulation in the stock. The first break away gap higher ended at 12.5 cents and the recent consolidation since that high provides an excellent buying level ahead of the next move higher. The 9 to 10 cent level is the new support level.
Ron Struthers founded Struthers’ Resource Stock Report 23 years ago. The report covers senior and junior companies with ample trading liquidity. He started his Millennium Index of dividend stocks in 2003 – $1,000 invested then was worth over $4,000 end of 2014 and the index returned 26.8% in 2016. He retired from IBM after 30 years in customer service, systems and business analyst, also developing his own charting software. He has expertise in junior start-ups and was a co-founder of Paramount Gold and Silver.
Disclosure: 1) Ron Struthers: I, or members of my immediate household or family, own shares of the following companies mentioned in this article: Blackrock Gold. I personally am, or members of my immediate household or family are, paid by the following companies mentioned in this article: None. My company currently has a financial relationship with the following companies mentioned in this article: Blackrock Gold is an advertiser at playstocks.net. Additional disclosures below. I determined which companies would be included in this article based on my research and understanding of the sector. 2) The following companies mentioned in this article are sponsors of Streetwise Reports: None. Click here for important disclosures about sponsor fees. 3) Statements and opinions expressed are the opinions of the author and not of Streetwise Reports or its officers. The author is wholly responsible for the validity of the statements. The author was not paid by Streetwise Reports for this article. Streetwise Reports was not paid by the author to publish or syndicate this article. The information provided above is for informational purposes only and is not a recommendation to buy or sell any security. Streetwise Reports requires contributing authors to disclose any shareholdings in, or economic relationships with, companies that they write about. Streetwise Reports relies upon the authors to accurately provide this information and Streetwise Reports has no means of verifying its accuracy. 4) This article does not constitute investment advice. Each reader is encouraged to consult with his or her individual financial professional and any action a reader takes as a result of information presented here is his or her own responsibility. By opening this page, each reader accepts and agrees to Streetwise Reports’ terms of use and full legal disclaimer. This article is not a solicitation for investment. Streetwise Reports does not render general or specific investment advice and the information on Streetwise Reports should not be considered a recommendation to buy or sell any security. Streetwise Reports does not endorse or recommend the business, products, services or securities of any company mentioned on Streetwise Reports. 5) From time to time, Streetwise Reports LLC and its directors, officers, employees or members of their families, as well as persons interviewed for articles and interviews on the site, may have a long or short position in securities mentioned. Directors, officers, employees or members of their immediate families are prohibited from making purchases and/or sales of those securities in the open market or otherwise from the time of the interview or the decision to write an article until three business days after the publication of the interview or article. The foregoing prohibition does not apply to articles that in substance only restate previously published company releases.
Charts and images provided by the author.
Struther’s Resource Stock Report: All forecasts and recommendations are based on opinion. Markets change direction with consensus beliefs, which may change at any time and without notice. The author/publisher of this publication has taken every precaution to provide the most accurate information possible. The information & data were obtained from sources believed to be reliable, but because the information & data source are beyond the author’s control, no representation or guarantee is made that it is complete or accurate. The reader accepts information on the condition that errors or omissions shall not be made the basis for any claim, demand or cause for action. Because of the ever-changing nature of information & statistics the author/publisher strongly encourages the reader to communicate directly with the company and/or with their personal investment adviser to obtain up to date information. Past results are not necessarily indicative of future results. Any statements non-factual in nature constitute only current opinions, which are subject to change. The author/publisher may or may not have a position in the securities and/or options relating thereto, & may make purchases and/or sales of these securities relating thereto from time to time in the open market or otherwise. Neither the information, nor opinions expressed, shall be construed as a solicitation to buy or sell any stock, futures or options contract mentioned herein. The author/publisher of this letter is not a qualified financial adviser & is not acting as such in this publication.
Indonesia’s central bank lowered its interest rates 25 basis points to encourage bank lending and boost the economy and signaled it is ready to lower rates further as there is “adequate space for accommodative monetary policy in line with low inflation expectations and the need to further stimulate economic growth.” Bank Indonesia’s (BI) cut its key BI 7-day reverse repo rate to 5.75 percent, its deposit rate to 5.0 percent and its lending facility rate to 6.50 percent, as widely expected. “This policy is consistent with low inflation expectations and the need to build economic growth momentum amidst a backdrop of easing global financial market uncertainty and controlled external stability,” BI said. BI raised its rates six times last year by a total of 1.75 percentage points during the U.S. Federal Reserve’s four rate hikes to bolster the exchange rate of the rupiah against a rising U.S. dollar. But the Fed’s shift toward easier policy this year has stimulated investors’ interest in emerging market assets and boosted the rupiah, giving BI space to lower its own rates without fear of capital outflows and financial instability. Today’s rate cut follows BI’s 50 basis points cut to its rupiah reserve requirements in June. “Ongoing trade tensions continue to pressure world trade volume and undermine global economic growth,” BI said, adding slower global growth has amplified downside pressure on commodity prices, including oil, with easier monetary policy by central banks lowering financial market uncertainty and driving capital flows to developing economies. The rupiah has been one of the main beneficiaries of this shift in capital and has been rising against the U.S. dollar since November last year. Today the rupiah rose further to 13,960 to the dollar, up 4.3 percent this year and up 9 percent since Oct 31, 2018, boosted by an upgrade of its sovereign rating. BI said it expects the inflow of foreign capital to further strengthen the rupiah. Indonesia’s economy slowed in the first quarter as exports declined and BI said further stimulation of domestic demand, including investments, was “required in order to mitigate the adverse impact of global economic moderation.” Indonesia’s gross domestic product grew 5.07 percent in the first quarter of this year, down from 5.18 percent in the fourth quarter of last year, but BI confirmed it still expects growth this year below the midpoint of 5.0-5.4 percent. In addition to the rate cut, BI said it would institute a policy mix in cooperation with the government and other authorities to boost exports and tourism and attract foreign direct investment. Indonesia’s current account deficit, one of the reasons behind last year’s rate hikes, is expected widen in the short run as exports decline but further ahead it is expected to narrow this year to 2.5-3.0 percent of GDP from almost 3.0 percent in 2018 as foreign capital is attracted. Indonesia’s inflation rate eased slightly to 3.28 percent in June from 3.32 percent in May and BI reiterated it still expects inflation this year to be below the midpoint of its target corridor of 3.5 percent, plus/minus 1 percentage points.
Bank of Indonesia issued the following statement:
“The BI Board of Governors agreed on 17th and 18th July 2019 to lower the BI 7-day Reverse Repo Rate by 25 bps to 5,75%, Deposit Facility (DF) rates lowered 25 bps to 5,00% and Lending Facility (LF) rates lowered 25 bps to 6,50%. The policy is consistent with low inflation expectations and the need to build economic growth momentum amidst a backdrop of easing global financial market uncertainty and controlled external stability. The monetary operations strategy remains oriented towards ensuring adequate liquidity in the money market and strengthening the transmission of accommodative monetary policy. Bank Indonesia is maintaining an accommodative macroprudential policy stance to encourage bank lending and expand economic financing. In addition, Bank Indonesia constantly strengthens payment system policy and financial market deepening to support economic growth. Moving forward, Bank Indonesia perceives adequate space for accommodative monetary policy in line with low inflation expectations and the need to further stimulate economic growth. Moreover, Bank Indonesia will continue to strengthen coordination with the Government and other relevant authorities in order to maintain economic stability and catalyse domestic demand, while boosting exports and tourism as well as attracting foreign capital inflows, including Foreign Direct Investment (FDI).
Ongoing trade tensions continue to pressure world trade volume and undermine global economic growth.Flatter growth is predicted in the United States as exports decline due to simmering trade tensions, the fading effect of fiscal stimuli and restrained economic confidence. Growth has also slowed in Europe as a result of sluggish exports coupled with the ongoing structural issue of an aging population, which is undermining domestic demand. Declining exports and weaker domestic demand are also plaguing the economies of China and India. Global economic moderation, in turn, has amplified downside pressures on commodity prices, including oil. Several central banks in advanced and developing economies have responded to the inauspicious economic dynamics by relaxing monetary policy, including the US Federal Reserve, which is expected to lower the federal funds rate (FFR). The prevailing policy response has reduced global financial market uncertainty and driven foreign capital inflows to developing economies.
At home, Indonesia has maintained relatively stable economic growth in the second quarter of 2019 compared with conditions in the previous period. Private consumption remains solid, backed by maintained consumer confidence. Furthermore, building investment continues to expand at a stable pace. Meanwhile, exports from Indonesia are expected to contract on subdued global demand and lower commodity prices stemming from the ongoing trade dispute, although steel exports increased in June 2019. The impact of simmering trade tensions on lower exports has been felt in a number of countries. In Indonesia, the export contraction has impeded imports and undermined nonbuilding investment. Moving forward, efforts to stimulate domestic demand, including investment, are required in order to mitigate the adverse impact of global economic moderation. In general, Bank Indonesia projects national economic growth in Indonesia below the midpoint of the 5.0-5.4% range in 2019. In addition, Bank Indonesia will institute a policy mix in cooperation with the Government and other relevant authorities in order to build economic growth momentum.
Indonesia is expected to maintain Balance of Payment (BOP) performance in the second quarter of 2019, thus reinforcing external stability. BOP performance is supported by a larger capital and financial account surplus than previously projected. Foreign capital inflows in the form of foreign direct investment and portfolio investment are expected to record a significant surplus, drawn to Indonesia by a sound domestic economic outlook and attractive domestic financial investment assets. Foreign capital inflows in the form of portfolio investment as of June 2019 were recorded at USD9.7 billion. Meanwhile, the current account deficit is projected to widen as exports of goods and services decrease, exacerbated by seasonal trends to repatriate dividends and service interest payments on external debt. Indonesia’s trade balance in June 2019 recorded a USD0.196 billion surplus, down slightly from USD0.22 billion the month earlier. At the end of June 2019, the position of reserve assets was recorded at USD123.8 billion, equivalent to 7.1 months of imports or 6.8 months of imports and servicing government external debt, which is well above the international adequacy standard of three months. Looking ahead, Bank Indonesia projects a narrower current account deficit in 2019 compared with conditions in 2018, namely in the 2.5-3.0% of GDP range. Furthermore, Bank Indonesia will constantly strengthen policy synergy with the government and other relevant authorities in order to bolster external resilience, including efforts to attract FDI.
A stronger rupiah has reinforced external stability. In June 2019, the rupiah appreciated 1.04% (ptp) on the level recorded at the end of May 2019 and by 1.13% compared with the May average in 2019. Rupiah appreciation continued into July 2019, reaching 1.06% (ptp) on 17th July 2019 compared with conditions at the end of June 2019. The stronger rupiah was triggered by attractive returns on portfolio investment in domestic financial assets. In addition, the prevailing perception of Indonesia’s economic outlook is improving, especially after Standard & Poor’s (S&P) upgraded Indonesia’s sovereign rating and uncertainty eased on the global financial markets in line with the expected loosening of global monetary policy. Such developments are expected to maintain the current inflow of foreign capital to Indonesia and further strengthen the rupiah. Moving forward, Bank Indonesia predicts rupiah exchange rate stability in line with market mechanisms. To support exchange rate policy effectiveness and strengthen domestic financing, Bank Indonesia will continue to accelerate financial market deepening efforts, targeting the money market and foreign exchange market in particular.
Low and stable inflation was maintained in June 2019. Consumer Price Index (CPI) inflation stood at 0.55% (mtm) or 3.28% (yoy) in June 2019, down slightly on the previous period at 0.68% (mtm) or 3.32% (yoy). Furthermore, core inflation was also kept under control in line with policy consistency by Bank Indonesia to anchor rational inflation expectations, including maintaining rupiah exchange rates in line with the currency’s fundamental value. Administered prices (AP) recorded deflation in the reporting period as airfares were readjusted after the peak festive period. Inflationary pressures on volatile foods were controlled as the seasonal impact of Ramadan and Eid-ul-Fitr began to fade. Bank Indonesia constantly strengthens policy coordination with the central and local governments to ensure low and stable inflation, including in anticipation of an earlier and protracted dry season forecasted this year. Bank Indonesia projects inflation in 2019 below the midpoint of the target corridor, namely 3.5%±1%.
Financial system stability has been maintained amidst a backdrop of adequate liquidity and lower credit risk. Solid bank resilience was confirmed by a high Capital Adequacy Ratio (CAR) of 22.3% in May 2019, coupled with a low level of non-performing loans (NPL) at 2.6% (gross) or 1.2% (nett). The banking industry has also maintained adequate liquidity, as reflected by a ratio of liquid assets to deposits of 18.5% in May 2019, although it declined from 20.2% in April 2019. The intermediation function remains sound with the banking industry reporting credit growth in May 2019 at 11.1% (yoy), which is stable compared to the month earlier. On the other hand, the banks confirmed a moderate uptick in deposit growth to 6.7% in May 2019 from 6.6% in April 2019. Bank efficiency also improved recently, as indicated by a low BOPO efficiency ratio recorded at a level of 81.71% in May 2019. Meanwhile, the performance of public listed corporations remains healthy, buoyed by maintained repayment capacity. Moving forward, Bank Indonesia will maintain an accommodative macroprudential policy stance in order to foster credit growth in line with the sub-optimal credit cycle. In 2019, Bank Indonesia projects growth of outstanding loans disbursed by the banking industry in the 10-12% (yoy) range, with deposit growth expected in the 8-10% (yoy) range.
The payment systems, both cash and noncash, remain uninterrupted. In terms of cash payments, growth of currency in circulation decelerated to 1.4 % (yoy) in June 2019. The wholesale (RTGS) and retail (Clearing) non-cash payment systems also functioned well in the reporting period. Meanwhile transactions using ATM/debit cards, credit cards and electronic money expanded at 22.6% (yoy) in May 2019, dominated by ATM/debit cards with a 94.4% share and expanding 21.6% (yoy) in the reporting period. Electronic money continues to enjoy significant uptake, with growth reaching 262.6% (yoy). Online transactions via digital banking recorded slightly faster growth at 34.5% (yoy) compared with conditions the month earlier. The proliferation of electronic money and digital banking is in line with the ongoing shift in public preferences towards transacting with financial technology platforms (FinTech), e-commerce and electronic money in the transportation sector. Moving forward, Bank Indonesia will continue to expand the payment systems’ role in supporting economic growth. Furthermore, Bank Indonesia will continue contributing to accelerate economic transformation in Indonesia towards digital finance; to expand the electronification program, especially targeting social aid programs (bansos), integrated transportation modes and local government transactions in an attempt to increase efficiency and economic capacity; and to transform micro, small and medium enterprises (MSME) towards digital payment platforms, digital finance and e-commerce. Bank Indonesia is also currently preparing the FATF (Financial Acton Task Force) Mutual Evaluation for 2020 as part of the National Strategy Action Plan for 2019 in order to mitigate money-laundering risk in the payment system.”
A currency crisis is when there is a sharp depreciation (or at times, an appreciation) in the value of a currency.
When a currency crisis occurs, it can have a significant impact which can affect all spheres of the economy, including the day to day lives of regular people.
A currency crisis is something that is not new. There are many examples of it in recent history, from the Russian ruble to the Turkish lira and many more. Despite the numerous incidents, the reasons behind currency crises can vary significantly.
When a currency crisis occurs, there is extreme volatility. This often draws the attention of speculators as well as central banks. Reasons range from a monetary policy that follows a fixed exchange rate, to economic failures and political crisis.
When a currency crisis occurs, it comes unannounced. One could draw a relation to a currency crisis as a black swan event. Yet, in most cases, in hindsight, the causes for it can be easy to explain.
Some currency crises tend to have a short-term impact, while many other types tend to last longer, sometimes for years.
Most Common Types of Currency Crises
There are a number of reasons for a currency crisis to occur. They can be categorized into the following:
Inflation
Inflation remains the single biggest threat to currencies. Typically, central banks are mandated to maintain price stability. But, depending on the circumstances, inflation can start to creep higher. Examples of inflation leading to currency crisis include the famous inflation in Zimbabwe and the more recent episode in Venezuela.
Debt
It is often said that debt fuels the economy. Under general circumstances, governments tend to keep a close watch on the amount of borrowing in the economy. When lenders learn about potential factors that could lead to a cut in the credit ratings, the borrowing costs rise. This can eventually lead to a freeze in borrowing due to the higher interest rate demand by lenders.
Political stability
Currency crisis can occur due to political reasons as well. An economy needs to have a stable political environment. This is good for overseas investors as well as for the economy to grow. When there is political infighting or riots against the government, it can lead to instability. This, in turn, spurs foreign investment coming into the economy, resulting in an indirect impact on the currency’s value.
Economic Factors
The global economy also plays a role in the currency crisis. When there is a faltering economy, central banks respond by lowering interest rates. The open markets set the value of an exchange rate in a free-floating exchange rate policy. This can get difficult in case an economy is following a fixed rate regime. Defending the exchange rate peg can become a costly affair.
Examples of Currency Crisis
1998, RUB Crisis
In 1998, the currency crisis hit Russia. Known as the ruble crisis, the nation had to devalue its exchange rate. One of the reasons that led to the crisis was falling productivity amid a higher fixed exchange rate. The Russian central bank had to intervene in the markets to devalue its currency as a result. The crisis got to a point that Russia had to seek loans from the International Monetary Fund.
2015, CHF De-peg
In 2015, the Swiss National Bank shocked the FX markets by announcing that it will de-peg the EUR and the CHF exchange rate. The SNB had, for years, maintained a floor on the EURCHF exchange rate. For a currency that was pegged to the euro, the CHF appreciated more than 30% on the day. This was unprecedented because currency crises typically lead to a devaluation of the currency.
EURCHF Currency depeg
2018, TRY Devaluation
In 2018, the Turkish lira made headlines. With high inflation and rising borrowing costs, the Turkish lira was embroiled in a currency crisis. Alongside the economic factors, the government was also partly responsible.
The Turkish government began to wield its influence on the Turkish central bank, further adding to the chaos. The TRY became strongly devalued as it fell to 4 USD per Turkish lira. The exchange rate was about 1.34 USD/TRY back in 2005.
USDTRY Currency Crisis, 2018
The impact of the devaluation in the Turkish lira also reached across shores into Europe. Because Europe had a significant amount of investment in Turkey, the currency crisis led to a decline in European equities as well.
In conclusion, currency crises can impact any economy, regardless of it being a developed or an emerging market. However, one could always look back in history to see how the economies have handled their respective currency crises.
While volatility is often low in the FX markets, a currency crisis can deeply affect the exchange rate. Money is the basis for the financial world. And, as a result, the impact is felt far and wide.
Hong Kong’s private sector contraction continued in June. Will the HK50 decline?
Recent Hong Kong economic data were weak after the positive trade report three weeks ago showing the trade deficit in Hong Kong continued to decrease in May. Retail sales continued to fall in May albeit at a slower pace than in April: 1.7% over year versus 5% in April. And the June reading of purchasing managers index was below 50 again, indicating contraction in the private sector. Activities in private sector contracted for the fifteenth straight month as new orders dropped, pointing to weakness ahead too. The slump in activities is being attributed to US-China trade tensions, and there are no indications the dispute can be resolved soon. On Tuesday President Trump said he could impose tariffs on another $325 billion of imports from China after telling US and China ‘had long way to go’ before a deal. Continuing decline in activities in private business sector is bearish for HK 50.
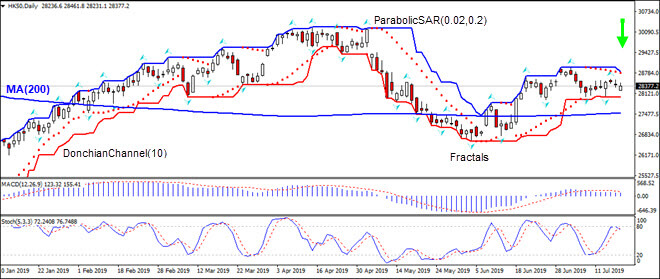
On the daily timeframe HK50: D1 is retracing lower after rebound following the decline to 8-month low in the beginning of May.
We believe the bearish momentum will continue after the price breaches below the lower Donchian boundary at 28021.3. This level can be used as an entry point for placing a pending order to sell. The stop loss can be placed below the lower Donchian boundary at 28830.7. After placing the pending order the stop loss is to be moved every day to the next fractal high, following Parabolic signals. Thus, we are changing the expected profit/loss ratio to the breakeven point. If the price meets the stop-loss level (28830.7) without reaching the order (28021.3) we recommend cancelling the order: the market sustains internal changes which were not taken into account.
After gold broke above a critical resistance level, held for the past five years, precious metals’ investors are now wondering, “what’s in store for silver?” While gold surged from $1,340 to $1,440 in just one week last month, silver only went up a mere $0.70. Thus, the Gold-Silver ratio increased from 89/1 to 94/1, in the same five-day period.
So, the BIG QUESTION many precious metals investors are asking, “Is silver going to follow gold’s move higher?” And, in several price trends in the past, silver does follow gold higher but also outperforms the yellow metal in the later stage.
To understand the dynamics of the silver price, we must realize it is based upon two aspects of the market:
Technical Analysis
Fundamentals
While many in the precious metals community discount or don’t believe in technical analysis (I was guilty of this for years), the majority of traders, investors, hedge funds and institutions most certainly do. So, if we ignore these technical levels or formations, then we are also blind to how price discovery is being made in the market… yes, even with market intervention.
Now, I am not saying that the current price discovery of silver at $15.25, is based on sound fundamentals if we compare its real value as a store of wealth to all the DEBT, DERIVATIVES, and JUNK ASSETS held in the world, but rather, how it is being priced by the leading DRIVERS in the market… which are traders, investors, hedge funds and institutions.
To better understand how silver is being currently traded, you must know what these leading PRICE DRIVERS are looking at. Furthermore, many precious metals investors say that they don’t care about the short-term price movement or technical analysis, but when the silver price happens to fall to a low (or is underperforming gold or the market), then there is no shortage of BELLY-ACHING, and COMPLAINING by the very same people who supposedly ignore this information.
So, instead of watching Kitco for daily price actions, hoping and praying for the silver price to finally start moving significantly higher, if we look at the technical analysis, it gives us some important clues. Again, I still believe the value of gold and silver will be some of the best assets to own when the over-leveraged financial system and economy finally crash, but if we pay attention to the technicals, they do indeed provide some hints, as they did when gold broke out above $1,360 in a big way.
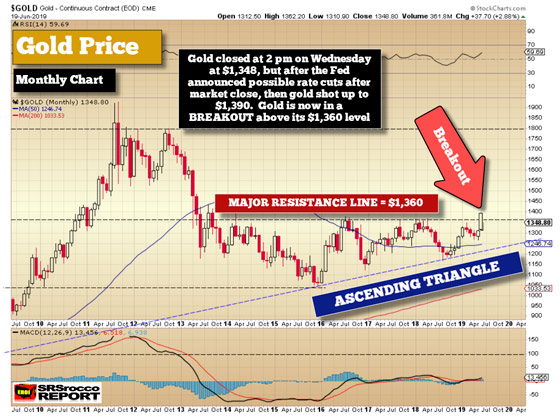
For example, gold’s price BREAKOUT above $1,360 occurred in a technical formation called, an ASCENDING TRIANGLE. Here is my chart showing how gold’s price shot above that $1,360 level:
According to technical analysis, a breakout above the Ascending Triangle Top Line is very bullish. Thus, traders, investors, hedge funds, and institutions use this information as a motivation to take confident positions in gold. Now, what are the silver price technicals saying??
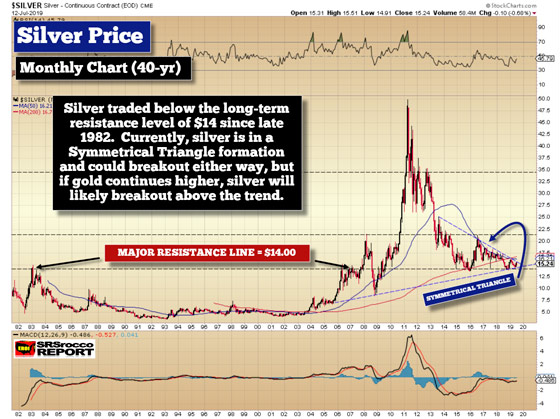
Well, if we look at the 40-year monthly chart for silver, its price has been trading in a SYMMETRICAL TRIANGLE formation:
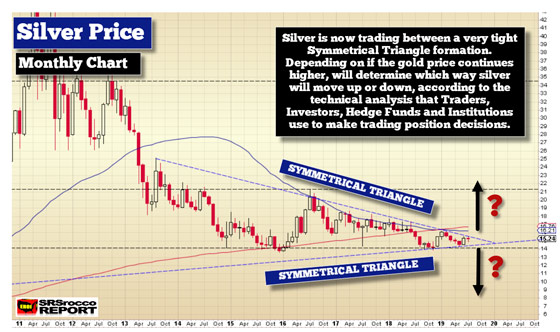
The blue dashed lines show this Symmetrical Triangle formation. Furthermore, you will notice that when silver finally broke above the KEY $14 Resistance Level in 2007-2008, it shot up to $21 rather quickly. That $14 Resistance Level remained since 1983, but recently has acted as a MAJOR SUPPORT LEVEL. Now, if we take a look at a close up of this Symmetrical Triangle formation, you will see how tightly silver is trading in it:
There is no coincidence that silver is trading in-between this symmetrical triangle. However, a symmetrical triangle formation suggests a breakout will occur, but it doesn’t indicate whether that will be UP or DOWN. Thus, market drivers are keeping a CLOSE EYE on the silver price to see which way it will break out of this triangle formation.
I will be explaining this in much more detail in an upcoming video. Yes, I stated in the past that I would have already made a video, but I have been putting together the charts and will likely publish a new Youtube video in 10-14 days. Please stay tuned.
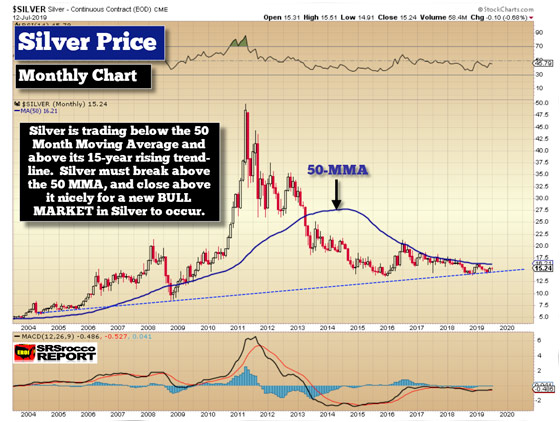
Major participants in the silver market have been following two important trend lines in silver over the past several years. The first one is the 50 Month Moving Average (50 MMA), and the second, is the rising bottom trend line:
Again, there is no coincidence that silver has been trading right up against the 50 Month Moving Average since the middle of 2016. Please take note that the rising bottom trendline is also the bottom part of the Symmetrical Triangle. Silver has not broken this lower trend line since 2004. Will it? Well, it could, but I doubt that it would do so for years because silver is now severely undervalued with respect to gold and most other assets.
Moreover, the direction to which silver initially BREAKS OUT of its symmetrical triangle may depend on the price direction of gold. So, if gold trends upward, even with corrections lower, then traders will likely believe silver will break-out ABOVE the symmetrical triangle formation that it has been stuck below since early 2013.
Of course, this information only provides short-term price movements that traders, investors, hedge funds, and institutions look at in determining the market price of silver. THIS HAS NOTHING TO DO WITH THE LONG-TERM EXCELLENT FUNDAMENTALS OF OWNING SILVER. But, to get to that point, we are going to see it show up in the technicals. Again, more of the details in my upcoming video.
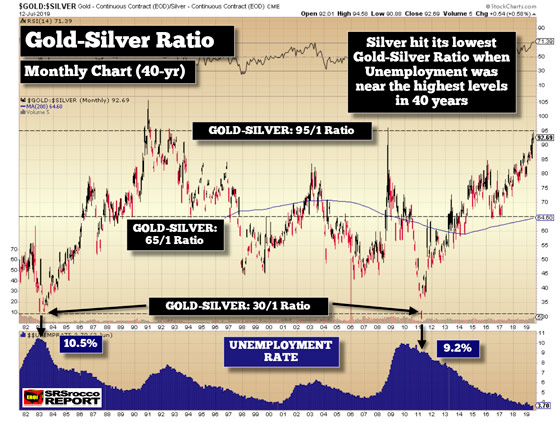
Lastly, many believe that the silver price may go lower or underperform gold during the next recession or weakening economy. At first glance, this makes perfect sense because a lot of physical silver demand comes from the Industrial Sector. However, if we look at another long-term chart, the Gold-Silver ratio fell to its lowest when U.S. unemployment was close to its highs. When the Gold-Silver Ratio falls, then the silver price is outperforming gold, and the opposite is true when the Gold-Silver Ratio increases:
The upper part of the chart shows the Gold-Silver Ratio while the bottom of the chart is displaying the U.S. unemployment rate, which is currently at 3.7%. Yes, the U.S. Government is manipulating the unemployment data. We all know that. But, if we just go by the data as an indicator, in 1983, when the employment data WASN’T MANIPULATED, the Gold-Silver Ratio fell to 30/1 when the unemployment rate reached 10.5%.
Furthermore, it wasn’t until the U.S. economy and markets collapsed after 2009, did the silver price shoot up to $50. So, when the U.S. unemployment rate was 9.2% in 2011, near the highs, the Gold-Silver Ratio fell below 30/1.
Here we can see that the silver price outperformed gold in a big way during two major recessions and elevated unemployment rates. Thus, the fear by precious metals investors that silver will do worse during the next recession may not be true and hasn’t been the case during the past two major recessions.
Also, you will notice that the Gold-Silver Ratio is hitting the upper level of 95/1. While it could go higher, the ratio always reversed lower back to the mid-level 65/1 Ratio, or even lower.
There’s a lot more to share and explain about silver, so please stay tuned to my Youtube Video update. Right now, the Fed is fighting a market correction, and recession with continued Dovish statements since the Dow Jones Index suffered its worst Christmas Eve trading day ever. However, they haven’t GONE ALL IN YET with lowering interest rates and starting up QE (money printing). If they finally resort to doing this, we are going to see what happened to gold in June take place in a much BIGGER WAY in the precious metals. And, I would imagine silver will still outperform gold in the end.
The Money Metals News Service provides market news and crisp commentary for investors following the precious metals markets.
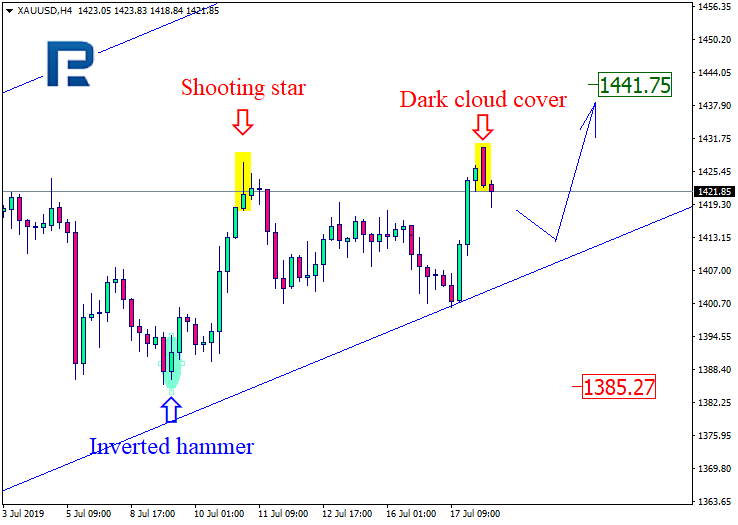
Gold keeps forming an ascending trend. On H4 the instrument has formed a Dark Cloud Cover at the horizontal resistance level. Currently, we are contemplating the signal for a reverse pattern start realizing. In case of further decline the price may reach 1385.27. At the same time a reverse scenario is not impossible: a breakthrough of the resistance line and a renewal of the maximum of 1441.75 may follow.
NZDUSD
On H4 the pair formed a Harami upon testing the horizontal resistance level at 0.6730. In the present situation a realization of the signal for a reverse pattern is not highly possible; further growth and testing of the next resistance level at 0.6800 are more likely. What is more, a vice versa scenario is not to be excluded: a bounce off the resistance line and a drop to 0.6662 may follow.
Attention! Forecasts presented in this section only reflect the author’s private opinion and should not be considered as guidance for trading. RoboForex LP bears no responsibility for trading results based on trading recommendations described in these analytical reviews.
By CentralBankNews.info South Korea’s central bank cut its benchmark base rate by 25 basis points to 1.50 percent and said it will maintain an accommodative monetary policy stance as economic growth is expected to be moderate and inflationary pressures will remain low in response to a slowing global economy from trade disputes between the U.S. and China. It is Bank of Korea’s (BOK) first rate cut since June 2016 and reverses the 25-point rate hike in November 2018, which was partly due to concern over rising household debt but also to give the central bank some more room to deal with any future economic downturns. The rate cut comes after recent data showed a large drop in South Korean exports as the global economy cools, and BOK lowered its forecast for 2019 economic growth to around 2.2 percent from April’s forecast of 2.5 percent, which had been cut from an earlier 2.6 percent. South Korea’s won fell 0.3 percent immediately after the rate cut to 1,182.6 per U.S. dollar, pushing this year’s depreciation to 5.5 percent, before settling slightly higher at 1,178.5. “The Board (of BOK) judges that the pace of domestic economic growth has slowed as construction investment has continued undergoing an adjustment and the slowdowns in exports and facilities investment have deepened, although consumption has continued to grow moderately,” BOK said. South Korea’s gross domestic product slowed to annual growth of only 1.7 percent in the first quarter of this year, down from 2.9 percent in the fourth quarter of last year, with exports in the second quarter down 8.4 percent after a 8.5 percent fall in the first quarter. BOK expects the decline in construction investment to continue as exports and facilities investment also recover later than it had expected while consumption will continue to grow. South Korea’s inflation rate has remained well below its 2.0 percent target – it was steady at 0.7 percent in May and June – and BOK expects inflation to remain below the path it predicted in April. BOK forecast headline inflation would fluctuate below 1.0 percent for some time and then run at the low to mid-1.0 percent level in 2020.
The Bank of Korea issued the following statement:
“The Monetary Policy Board of the Bank of Korea decided today to lower the Base Rate by 25 basis points, from 1.75% to 1.50%.
Based on currently available information the Board considers that the pace of global economic growth has continued to slow as trade contracted mainly due to the US-China trade dispute. Global financial markets have been stable in general, with stock prices in major countries increasing in line primarily with expectations of monetary easing in major countries. Looking ahead, the Board sees global economic growth andtheglobal financial markets as likely to be affected by factors such as the degree of the spread of trade protectionism, the changes in the monetary policies of major countries, and geopolitical risks.
The Board judges that the pace of domestic economic growth has slowed as construction investment has continued undergoing anadjustment and the slowdowns in exports and facilities investment have deepened, although consumption has continued to grow moderately. Employment conditions have partially improved, with the increase in the number of persons employed having risen. With respect to future domestic economic growth, the Board expects that the adjustment in construction investment will continue and exports and facilities investment will recover later than originally expected, although consumption will continue to grow. GDP is forecast to grow at the lower-2% level this year, below the April forecast (2.5%).
Consumer price inflation has remained low at the mid- to upper-0% level, in consequence mainly of the continued decline in petroleum product prices. Core inflation (with food and energy product prices excluded from the CPI) has been at the mid- to upper-0% range, and the rate of inflation expected by the general public has been at the low-2% level. Looking ahead, it is forecast that consumer price inflation will fall short of the path projected in April and fluctuate for some time below 1% and then run at the low- to mid-1% level from next year. Core inflation will also gradually rise.
The volatility of price variables in the domestic financial markets has increased. Long-term market interest rates have fallen significantly, in line mainly with concerns about economic slowdowns at home and abroad.Stock prices andthe Korean won-US dollar exchange rate have fluctuated considerably, mainly affected by the US-China trade dispute and Japan’s export restrictions. The rate of increasein household lending has continued to slow, whilehousing prices have continued their downtrend.
Looking ahead, the Board will conduct monetary policy so as to ensure that the recovery of economic growth continues and consumer price inflation can be stabilized at the target level over a medium-term horizon, while paying attention to financial stability. As it is expected that domesticeconomic growthwill bemoderate and it is forecast thatinflationary pressures on the demand side will remain at a low level, the Board will maintain its accommodative monetary policy stance. In this process it will carefully monitor developments such as the US-China trade dispute, Japan’s export restrictions, any changes in the economies and monetary policies of major countries, the trend of increase in household debt, and geopolitical risks, while examining their effects on domestic growth and inflation.”
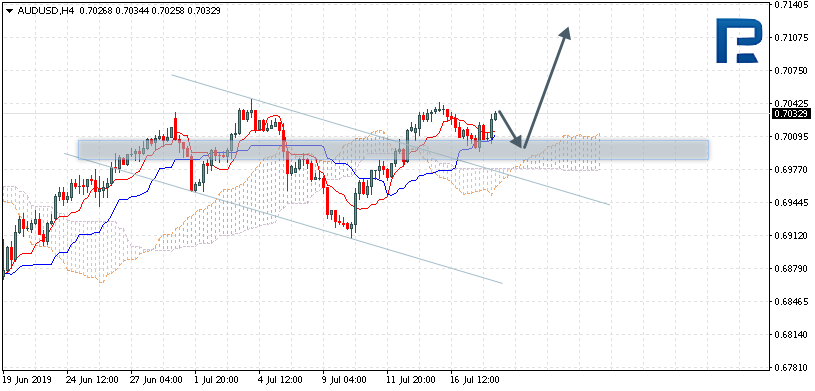
The instrument is trading at 0.7032 above the Cloud, which suggests an ascending trend. Testing of the signal lines of the indicator near 0.7005 is expected, followed by growth to 0.7110. Yet another signal of growth may be a bounce off the support line. The scenario may no longer be valid in case the lower border of the Cloud is broken and trading closes under 0.6950, which may be followed by a further decline below 0.6875.
NZDUSD
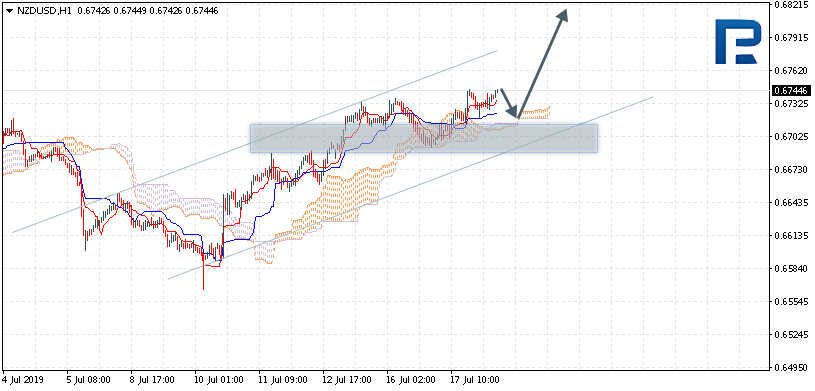
The instrument is trading at 0.6744 above the Ichimoku Cloud which suggests an ascending trend. A test of the upper border of the Cloud near 0.6725 is expected, followed by growth to 0.6820. Yet another signal of growth may be a bounce off the support line. The scenario may no longer be valid in case the lower border of the Cloud is broken and trading closes under 0.6700, which may be followed by further decline to 0.6625.
USDCAD
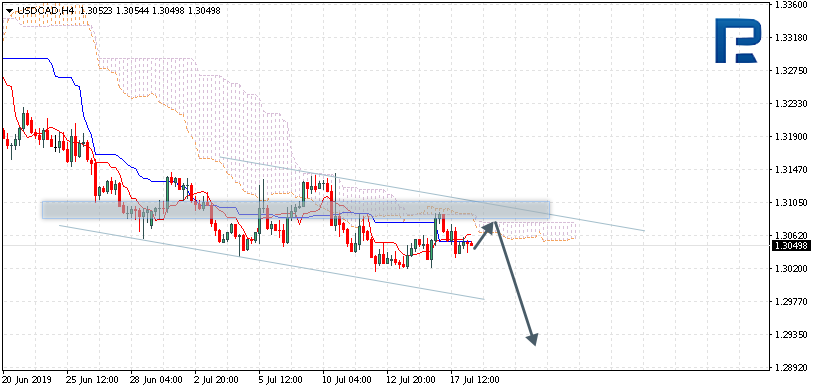
The instrument is trading at 1.3049 below the Ichimoku Cloud which suggests a descending trend. Testing of the upper border of the Cloud near 1.3065 is expected, followed by a decline to 1.2925. Yet another signal of decline may be a bounce off the upper border of the descending channel. The scenario may no longer be valid in case the upper border of the Cloud is broken and trading closes above 1.3125, which may be followed by further growth to 1.3205.
Attention! Forecasts presented in this section only reflect the author’s private opinion and should not be considered as guidance for trading. RoboForex LP bears no responsibility for trading results based on trading recommendations described in these analytical reviews.
Our researchers identified this critical Double-Top pattern in the Transportation Index after a very strong price rally on Friday, July 12. Double-Top patterns are very important in terms of Fibonacci price structure because they reflect a complete price rejection at a certain price level. In this case, the TRAN Double Top level is $10,655 and our research team believes weakness at this level will push a downward price swing which should attempt to break through the $10,250 level and possibly attempt to move much lower.
The Transportation Index reflects future expectations for shipping of goods and raw materials across the US and, of course, is somewhat related to global economic activity. If the Transportation Index falls in price, then future expectations are for weaker economic activity. If it rises, then investors expect the economy to continue to strengthen.
This Double-Top formation in the TRAN could set up to become a very ominous warning sign for traders and investors.
Recent news about the contraction of China’s economy and the fact that Q2 earnings are about to hit the US markets and global markets could become a key factor in the future for volatility and price. We believe the markets are already setting up a topping pattern after breaching key psychological levels last week.
MINERS ARE OUTPERFORMING US EQUITIES – TOP IS NEAR!
Last month I talked about how I have been waiting for gold miners to start outperforming the US stocks market. Once miners start outperforming in a big way (just like we saw in 2007), we know the stock market is topping out and something really bad is about to happen.
In the last couple of weeks, the gold miners index is up over 20% while the SP500 is up only 4%, this feels like the start-of-the-end if you know what I mean.
Gold miners and silver broke out today in a big way which could very well be the start of an epic rally for the precious metals sector as we heading into the end of the year.
Looks at the SP500 index in the chart below which is of the 2007 bull market top. Currently, the SP500 has formed a very similar pattern in 2019 and with the precious metals rocketing higher I think it almost lights out for the US equities.
TRANSPORTS, INDUSTRIALS, and SMALL-CAP STOCKS Confirm Market Is Topping
Based on the 2008 weekly chart below the US stock market could be literally 2-6 weeks away from collapsing. What makes this even scarier is that the market liquidity is the worst its been in my 23 years of trading. This means when the selling starts we will likely see some sort of flash crash as we saw in 2008, 2015, and 2018. Price drops so quickly that by the time you figure out what you want to do and get your money properly positioned most of the move is already finished. See 2008 and 2019 Comparison Charts here.
CONCLUDING THOUGHTS:
Pay attention to our research because we feel the market could breakdown on weakness later this week or early next week. Our predictive modeling systems are suggesting an August 19th, 2019 breakdown date and we are only about 25 trading days away from that date.
In short, the bear market has been a long time coming, but finally, almost all the signs are showing that it’s about to start. As a technical analyst since 1997 having lost a fortune and making a fortune from bull and bear markets I have a good understanding of how to best attack the market during its various stages. Stay Tuned for My Cycle Analysis Article Next!
Be prepared for these incredible price swings before they happen and learn how you can identify and trade these fantastic trading opportunities in 2019, 2020, and beyond with our Wealth Building & Global Financial Reset Newsletter. You won’t want to miss this big move, folks. As you can see from our research, everything has been setting up for this move for many months – most traders/investors have simply not been looking for it.
Join me with a 1 or 2-year subscription to lock in the lowest rate possible and ride my coattails as I navigate these financial market and build wealth while others lose nearly everything they own during the next financial crisis. Join Now and Get a 1oz Silver Round or Gold Bar Shipped To You Free.
As a technical analysis and trader since 1997, I have been through a few bull/bear market cycles. I believe I have a good pulse on the market and timing key turning points for both short-term swing trading and long-term investment capital. The opportunities starting to present themselves will be life-changing if handled properly.
FREE GOLD or SILVER WITH MEMBERSHIP!
So kill two birds with one stone and subscribe for two years to get your FREE PRECIOUS METAL and get enough trades to profit through the next metalsbull market and financial crisis!