Markit will be releasing the forward-looking data this week, in the form of the flash manufacturing PMI for the United States. The preliminary results follow the business activity in the manufacturing sector for the month of July.
The data comes during a crucial week where the US second-quarter advance GDP figures will also be published. There is no doubt that global economic growth has slowed. This is evident not just from US GDP data but also among various other developed economies.
Economists forecast that Markit’s flash manufacturing PMI for July will see manufacturing activity rising from 50.6 in June to 50.9 in July. This marks a modest pick up in the manufacturing activity for the world’s largest economy.
Markit Manufacturing PMI, June 2019
Manufacturing activity in the US as measured by Markit has been in a steady decline since February this year. After manufacturing activity peaked to 54.9 in January, activity fell sharply in the months thereafter.
The slowdown reflects the shift in the global economy as well. Various institutions have already cautioned that growth is likely to slow in the years ahead. This comes after the US saw one of the longest expansionary stretches in history.
However, the forecasts for the flash manufacturing PMI is somewhat optimistic.
Regional Manufacturing Indexes Rise in July
Last week, we got to see some of the regional manufacturing index data. The figures were published by the respective regional Federal Reserve banks. While the overall figures picked up, the underlying data indicates that growth remains sluggish. Of course, we cannot expect growth to rebound within a month.
The NY Fed’s, Empire State Manufacturing Index saw an increase from -8.6 in June to 4.3 in July. However, looking under the hood, data showed that unfilled orders and inventories moved lower.
The new orders index did not see any major gains, suggesting that demand continued to remain sluggish. The employment index, which is a measure of the demand, also remained in the negative.
In fact, the employment index fell to the lowest level in nearly three years. The general business conditions index was one of the main drivers for the index to rebound.
Then, the Philly Fed manufacturing index was released by the Philadelphia Federal Reserve. Data showed that manufacturing activity rose to 21.8 in July, up from 0.3 in June. In this report, the data was somewhat different.
New orders, shipments, and general activity picked up. Similar to the NY Fed’s report, the Philly Fed manufacturing index noted that firms were optimistic about an uptick in the economy.
Manufacturing Picks up but at an Uneven Level
The regional manufacturing data indicated that while growth is returning, it remains uneven. Taking the two regional reports, it is clear that the manufacturing pick-up is not strongly entrenched.
Thus, investors will most likely wait and watch for the trends to be established in the manufacturing activity.
Up until now, the manufacturing activity overall remains weak. However, the ISM’s manufacturing PMI for June saw a modest decline to 51.7 from 52.1 in May. This was a slower pace of increase.
But it was slightly better compared to the median estimates.
There are a number of global factors at play that have driven demand lower. Primarily, the US trade war policy against a number of economies stands out. This has led to quite a lot of uncertainty in the manufacturing sector.
Until there is some clarity, we do not expect to see a general improvement in the manufacturing side of the business. Given that manufacturing adds quite a bit to the national GDP, it could also drive the growth lower.
This is evident from the advance GDP report that will come out this week. Growth is expected to slow to a pace of 1.8% in the second quarter. It would mark one of the slowest growth patches after a strong run.
At a glance, the economic calendar looks quite packed on Wednesday and there looks to be some potential market movers for US yields which could result in some price action fireworks in the USD/JPY.
However, we are a little sceptical if chances are really so high to see big moves in the currency pair, as we find ourselves currently in the FOMC blackout period which started last Saturday and where we should expect volatility to stay subdued.
After the comments from NY Fed president Williams last Thursday, “to take swift action when faced with adverse economic conditions” and “keep interest rates lower for longer,” which was interpreted as exceedingly dovish. It resulted in a short-term push in expectations of a 50 basis point rate cut from the Fed on July 31, to nearly 70%, and we are now back at an approximately 75% likelihood of a 25 basis point rate cut which isn’t likely to significantly change even if we get to see some data surprises today.
Technically, the picture stays neutral on a daily time-frame between 106.80 and 109.00, even though with a bearish touch below 109.00. Mid-term, we see the clear advantage in the USD/JPY on the short-side, especially if the Fed delivers a dovish stance on July 31 with a target around 105.00 and lower:
Source: Admiral Markets MT5 with MT5-SE Add-on USD/JPY Daily chart (between July 19, 2018, to July 23, 2019). Accessed: July 23, 2019, at 10:00pm GMT – Please note: Past performance is not a reliable indicator of future results, or future performance.
In 2014, the value of the USD/JPY increased by 13.7%, in 2015, it increased by 0.5%, in 2016, it fell by 2.8%, in 2017, it fell by 3.6%, in 2018, it fell by 2.7%, meaning that after five years, it was up by 4.1%.
Investing in Forex with Admiral Markets
Admiral Markets offers professional traders the ability to trade with a custom, upgraded version of MetaTrader 5, allowing you to experience trading at a significantly higher, more rewarding level. Experience benefits such as the addition of the Market Heat Map, so you can compare various currency pairs to see which ones might be lucrative investments, access real-time trading data, and so much more. Click the banner below to start your FREE download of MT5 Supreme Edition!
Disclaimer: The given data provides additional information regarding all analysis, estimates, prognosis, forecasts or other similar assessments or information (hereinafter “Analysis”) published on the website of Admiral Markets. Before making any investment decisions please pay close attention to the following:
This is a marketing communication. The analysis is published for informative purposes only and are in no way to be construed as investment advice or recommendation. It has not been prepared in accordance with legal requirements designed to promote the independence of investment research, and that it is not subject to any prohibition on dealing ahead of the dissemination of investment research.
Any investment decision is made by each client alone whereas Admiral Markets shall not be responsible for any loss or damage arising from any such decision, whether or not based on the Analysis.
Each of the Analysis is prepared by an independent analyst (Jens Klatt, Professional Trader and Analyst, hereinafter “Author”) based on the Author’s personal estimations.
To ensure that the interests of the clients would be protected and objectivity of the Analysis would not be damaged Admiral Markets has established relevant internal procedures for prevention and management of conflicts of interest.
Whilst every reasonable effort is taken to ensure that all sources of the Analysis are reliable and that all information is presented, as much as possible, in an understandable, timely, precise and complete manner, Admiral Markets does not guarantee the accuracy or completeness of any information contained within the Analysis. The presented figures refer that refer to any past performance is not a reliable indicator of future results.
The contents of the Analysis should not be construed as an express or implied promise, guarantee or implication by Admiral Markets that the client shall profit from the strategies therein or that losses in connection therewith may or shall be limited.
Any kind of previous or modeled performance of financial instruments indicated within the Publication should not be construed as an express or implied promise, guarantee or implication by Admiral Markets for any future performance. The value of the financial instrument may both increase and decrease and the preservation of the asset value is not guaranteed.
The projections included in the Analysis may be subject to additional fees, taxes or other charges, depending on the subject of the Publication. The price list applicable to the services provided by Admiral Markets is publicly available from the website of Admiral Markets.
Leveraged products (including contracts for difference) are speculative in nature and may result in losses or profit. Before you start trading, you should make sure that you understand all the risks.
On Tuesday the 23rd of June, trading on the euro closed significantly down against the dollar after spending virtually the whole day in a downtrend. A speech from RBA Deputy Governor Christopher Kent and an announcement from US President Donald Trump on a bipartisan budget agreement bolstered the US dollar. The euro shed 4.6%, slumping from the 1.1207 mark to close the day at 1.1151.
The announcement of Boris Johnson as the victor in the Conservative Party’s vote for a new leader, confirming his as the new Prime Minister, as well as speeches from the Bank of England’s MPC, helped to set a stable downwards trend on the EURUSD pair, leading to a breakout of some key levels around 1.1194. The dollar’s rise was finally mitigated by weak housing data in the US.
Day’s news (GMT+3):
10:30 Germany: Markit manufacturing PMI (Jul).
11:00 Eurozone: Markit manufacturing PMI (Jul).
16:45 US: Markit manufacturing PMI (Jul).
17:00 US: new home sales (Jun).
Current situation:
The pair is approaching the support zone between 1.1128 and 1.1108. We have the ECB and Fed meetings ahead, where decisions will be made on the economies’ key rates. Markets expect the US Fed to lower interest rates at the next meeting, while there are hints at an easing of monetary policy by the ECB. Depending on how markets react to this, we could get a bounce from 1.1108, with the euro further strengthening.
Asian stocks are claiming higher ground, after the S&P 500 closed back above the 3000 level, as news that US and China negotiators are set to hold a high-level meeting in Shanghai on Monday lifted market sentiment.
While the resumption of trade talks appears to mitigate any near-term deterioration in US-China tensions, the prudent investor will not get carried away, seeing as a meaningful deal still seems a long way off at this point in time. Global growth has already been stifled by the protracted impasse between the world’s two largest economies, along with the imposed tariffs, and investors need not look further than the IMF’s repeated downgrades to its global growth forecasts. While the prospects of central bank stimulus encourage risk appetite for equities, some measure of caution is still warranted, given the downside risks stemming from global trade tensions and Brexit uncertainties.
New Prime Minister, same ol Sterling
The Pound offered scarce reaction to Boris Johnson’s official unveiling as the new leader of the UK Conservative Party, with such an outcome having already been priced into the markets. Theresa May is set to hand over her duties as Prime Minister to Johnson later today, and with it, the same political challenges that proved insurmountable for May in getting Brexit over the line.
The question now on investors’ mind is whether the Boris Johnson of the campaign trail, will be the same Boris Johnson that will confront EU officials in charting Brexit’s eventual path? Keep in mind that Johnson had repeatedly extolled the need to deliver on Brexit, with or without a deal by the October 31 deadline. Such rhetoric has amplified concerns that PM Johnson could lead the UK towards a no-deal Brexit.
In any case, the Pound is set to remain weighed down by the political uncertainties ahead, as the UK’s economic fundamentals continue taking a back seat to the Brexit saga over the remaining 100 days before the October 31 deadline.
Dollar bulls refuse to cower in lead up to Fed’s July 31 decision
The Dollar index (DXY) has reached its highest in over a month, trading above the 97.7 level at the time of writing, as most Asian currencies continue softening against the Greenback. Investors are paring back expectations that the Federal Reserve would lower interest rates by 50-basis points next week, with Fed funds futures now showing a less than 20 percent chance of the Fed easing its policy settings by a bigger margin, versus the widely expected 25-basis point cut.
Dollar bulls are not taking things lying down, which has tempered gains in safe haven assets, with Gold moderating towards the $1400 level while the Yen currently trades above the 108 handle against the US Dollar. Still, there remains a strong case to be made for Gold and the Japanese Yen, as global economic risks remain tilted to the downside, evidenced by the IMF once again lowering its global economic forecast for the year.
Disclaimer: The content in this article comprises personal opinions and should not be construed as containing personal and/or other investment advice and/or an offer of and/or solicitation for any transactions in financial instruments and/or a guarantee and/or prediction of future performance. ForexTime (FXTM), its affiliates, agents, directors, officers or employees do not guarantee the accuracy, validity, timeliness or completeness, of any information or data made available and assume no liability as to any loss arising from any investment based on the same.
US stock market advance accelerated on Tuesday in anticipation of China trade talks resumption next week and positive corporate reports. The S&P 500 rose 0.7% to 3005.0. Dow Jones industrial advanced 0.7% to 27349 led by 6.1% gain in Cocoa Cola. The Nasdaq gained 0.6% to 8251. The dollar strengthening accelerated despite steeper than expected 1.7% decline on month in existing home sales in June instead of forecast 0.4%: the live dollar index data show the ICE US Dollar index, a measure of the dollar’s strength against a basket of six rival currencies, gained 0.4% to 97. 7 and is hgher currently. Stock index futures point to lower market openings today
DAX 30 leads European indexes gains
European stocks resumed advancing on Tuesday supported by strong earnings reports. The GBP/USD and EUR/USD slump accelerated with euro lower while pound rising currently. The Stoxx Europe 600 ended 1% higher led by auto and chip maker shares. The German DAX 30 rallied 1.6% to 1249.74. France’s CAC 40 rose 0.9%. UK’s FTSE 100 advanced 0.6% to 7556.86.
Australia’s All Ordinaries Index paces Asian indexes gains
Asian stock indices extending gains today ahead of US delegation visit to Shanghai next week. Nikkei advanced 0.4% to 21709.57 despite yen inching higher against the dollar. Chinese stocks are rising: the Shanghai Composite Index is up 0.6% and Hong Kong’s Hang Seng index is 0.6% higher. Australia’s All Ordinaries Index gained 0.8% with Australian dollar’s slide against the greenback intact.
Brent futures prices are edging lower today. The American Petroleum Institute late Tuesday report indicated US crude inventories fell by 11 million barrels last week. Prices rose yesterday: September Brent gained 0.9% to $63.83 a barrel on Tuesday. Today at 16:30 CET the Energy Information Administration will release US Crude Oil Inventories.
Note: This overview has an informative and tutorial character and is published for free. All the data, included in the overview, are received from public sources, recognized as more or less reliable. Moreover, there is no guarantee that the indicated information is full and precise. Overviews are not updated. The whole information in each overview, including opinion, indicators, charts and anything else, is provided only for familiarization purposes and is not financial advice or а recommendation. The whole text and its any part, as well as the charts cannot be considered as an offer to make a deal with any asset. IFC Markets and its employees under any circumstances are not liable for any action taken by someone else during or after reading the overview.
The silver market is on the upswing but consolidation could be in the offing, according technical analyst Clive Maund.
Some weeks back we had correctly surmised that gold’s gathering strength would rub off on silver and cause it to start catching up, so we bought a range of silver ETFs and stocks, a move which has paid off well as they have spiked quite dramatically in the recent past.
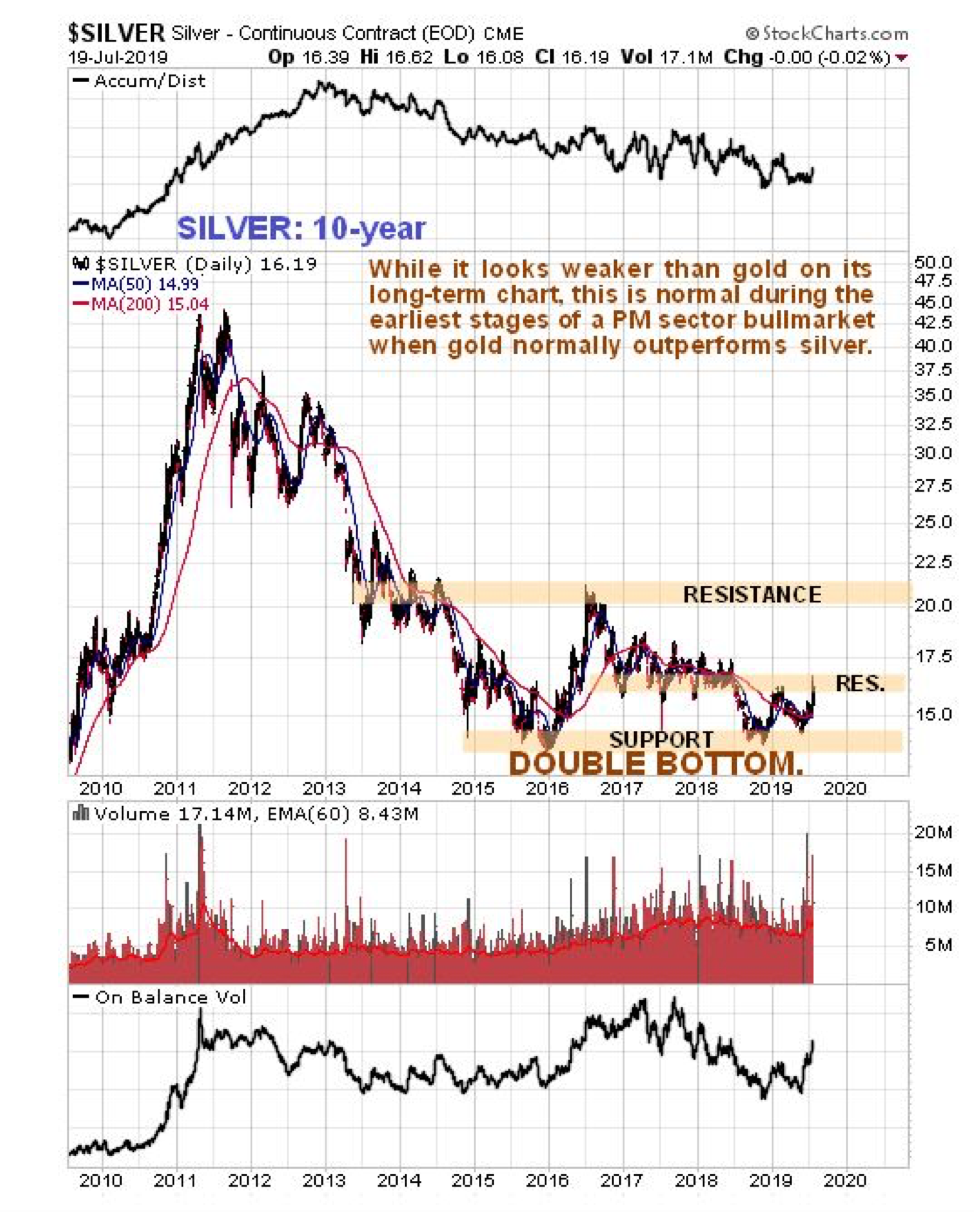
Starting with silver’s 10-year chart, we can see that its presumed giant double bottom is starting to look more and more like the genuine article, with the price starting to advance away from the second low of the pattern.
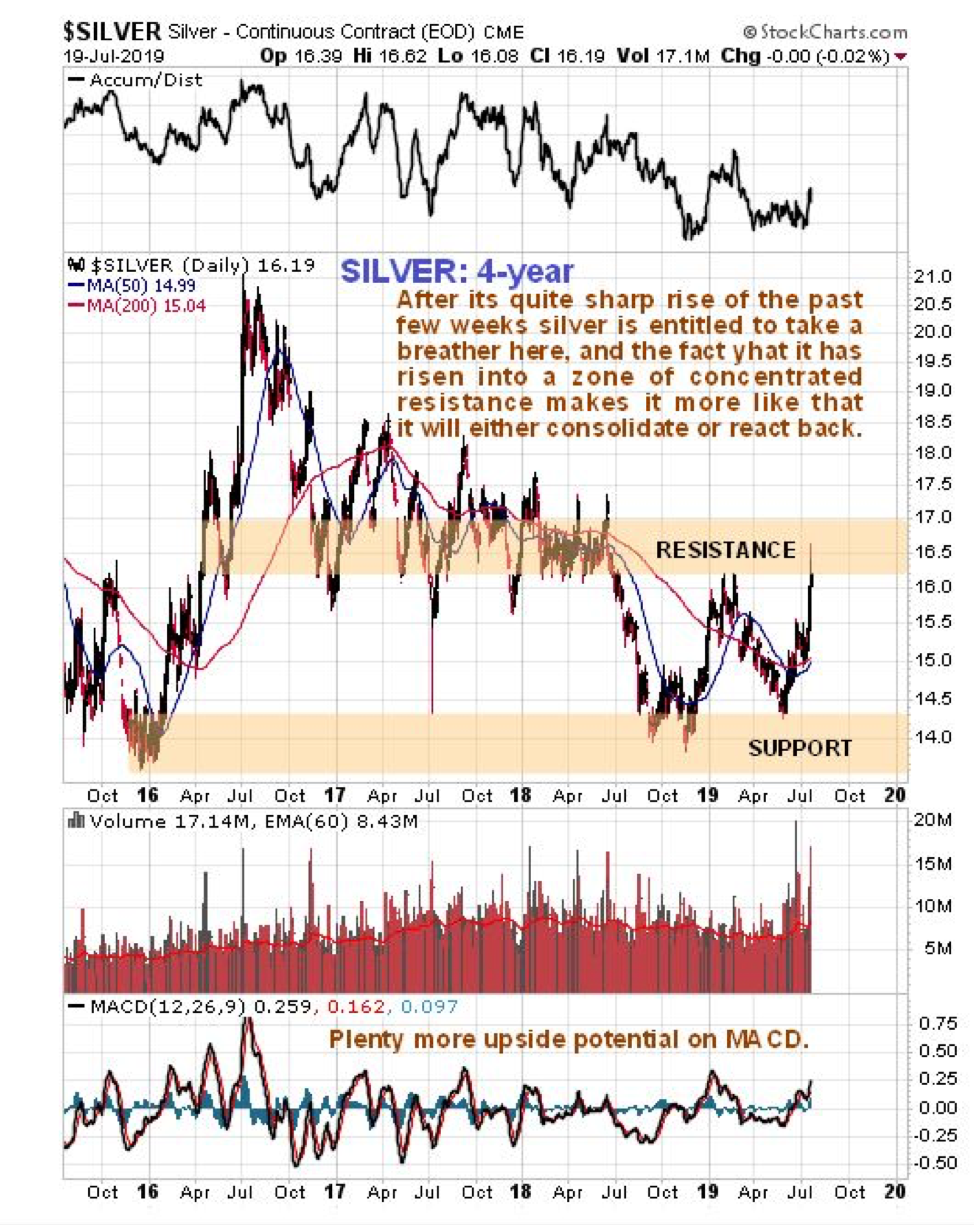
Silver has a marked tendency to “drag its feet” when a new sector bull market starts, which is why it has been so laggardly for much of this year. When we look at the latest four-year chart we can see another big reason why it could now get bogged down again for a while, for there is a wall of resistance just above the current price centered on the $1617.50 zone. This, given the short-term toppy look of gold, could cause it to consolidate or react back now for a while. This is a big reason why we took profits in a number of our silver ETFs and stocks at the top on Friday morning, which had done very well last week.
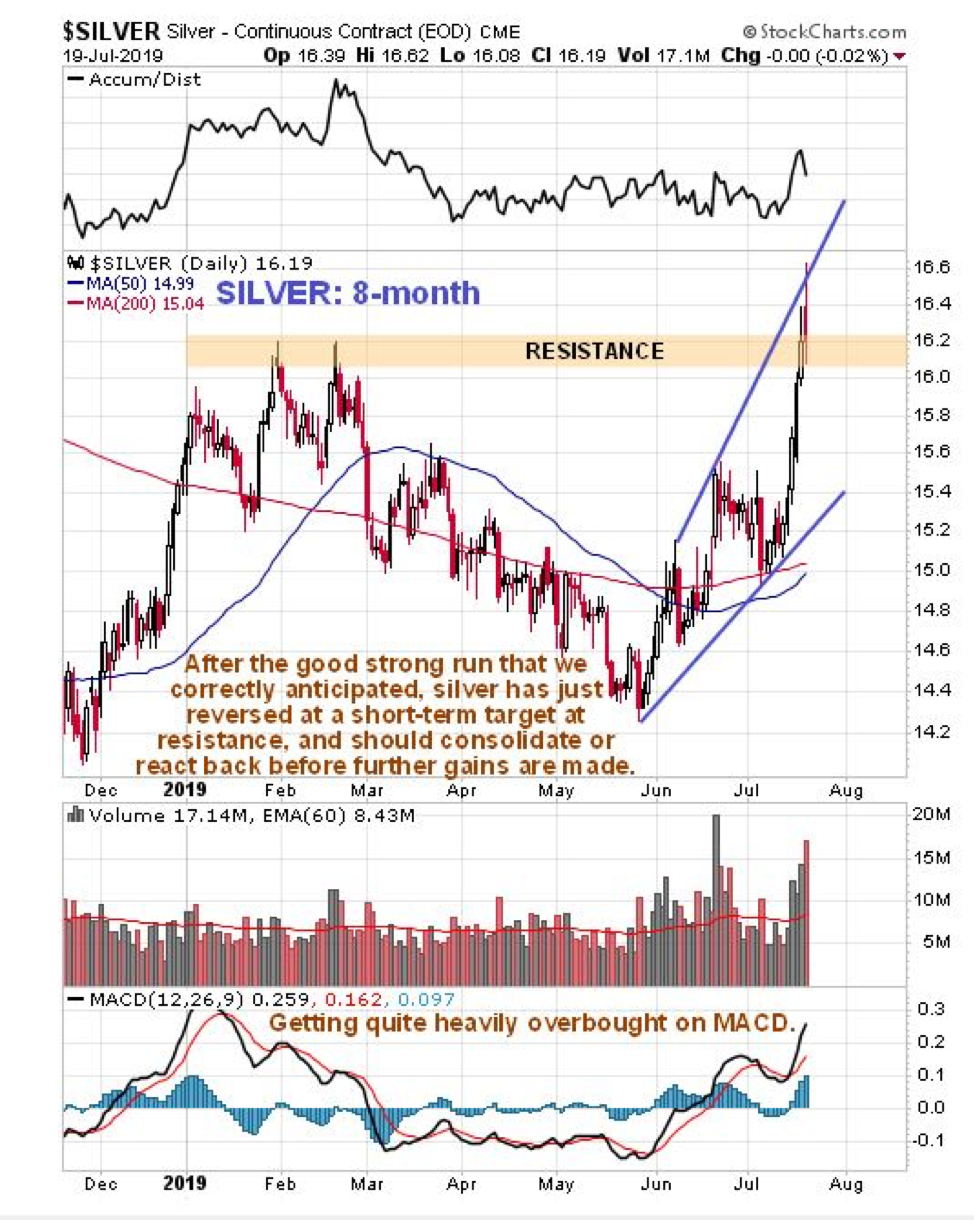
Another reason for taking profits in some silver investments last Friday morning can be seen on the latest eight-month chart, for silver had arrived at the top of an expanding uptrend channel after a steep ascent that resulted in its becoming very overbought.
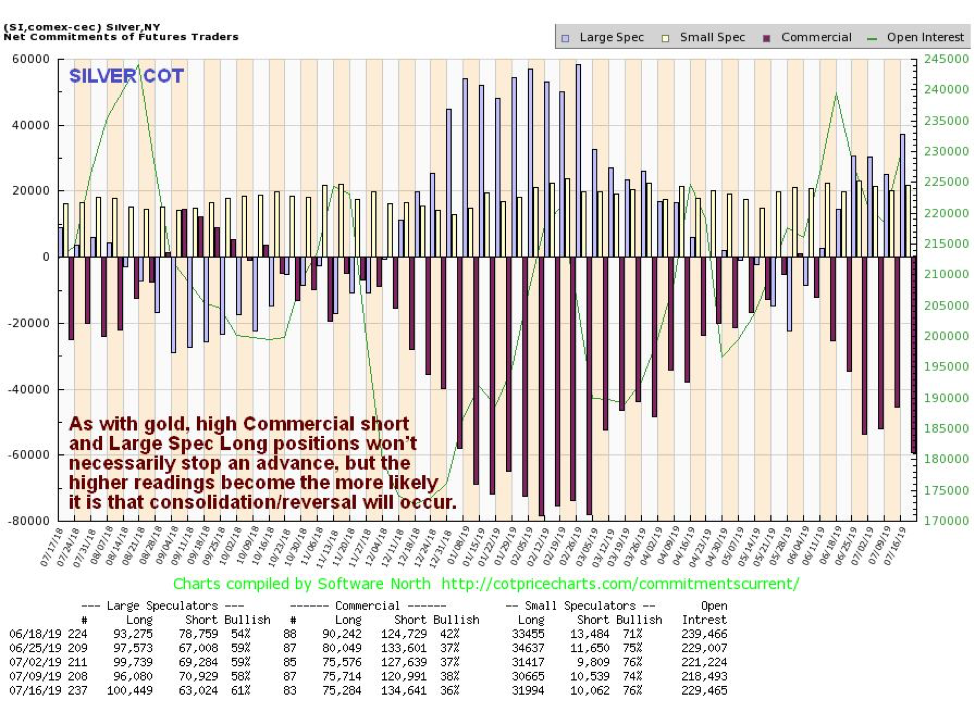
Silver’s latest COTs do not look as extreme as gold’s, but they show that last week there was a big rise in Commercial short and Large Spec long positions. Since this data is for the close of trade last Tuesday, we can presume that by Friday’s close they were more extreme. Although they are not at levels that preclude further gains, it certainly wouldn’t do any harm if they eased as a result of a correction.
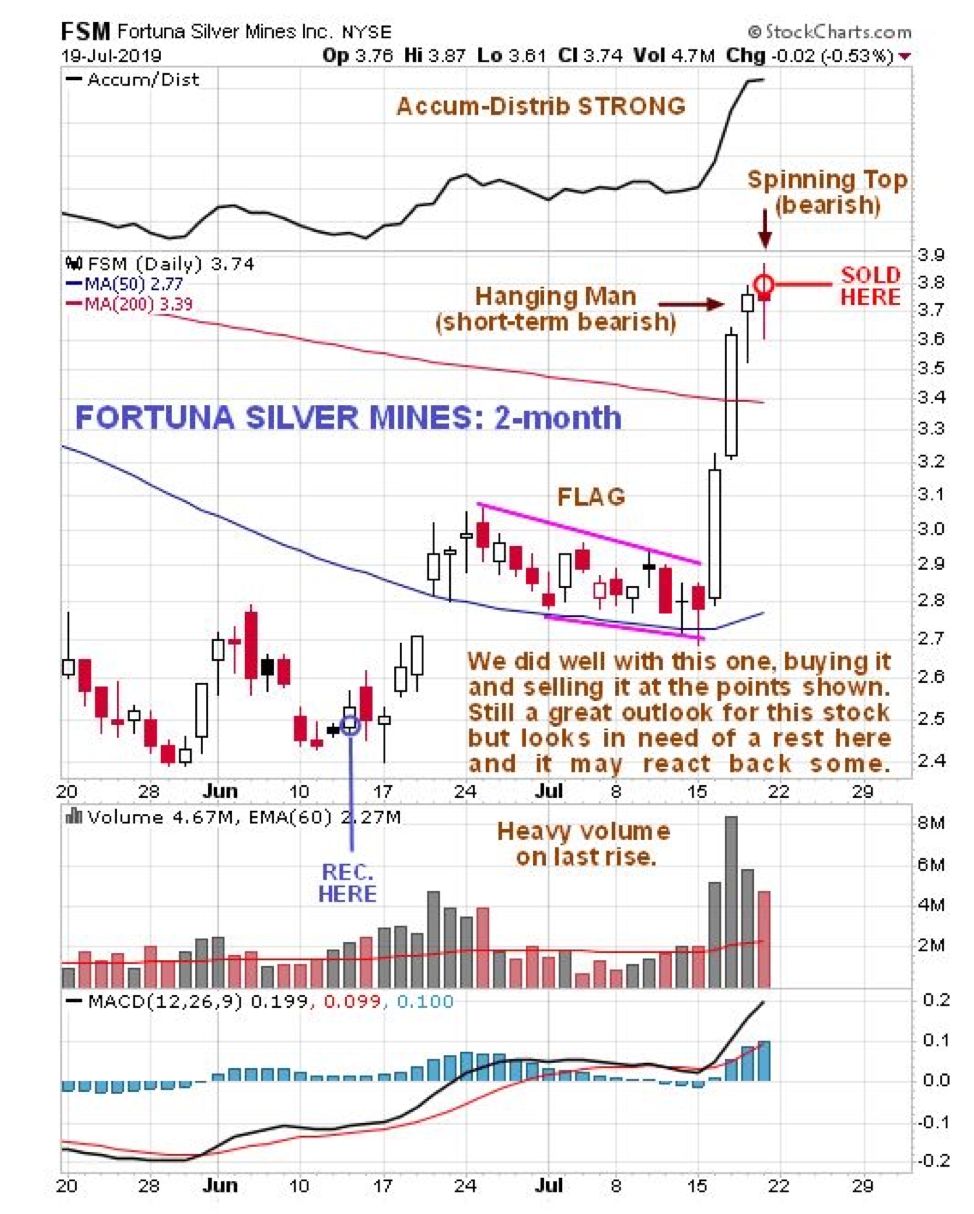
Finally, here are the charts of a couple of silver investments that we sold, or at least partially sold, into strength after the opening on Friday. Fortuna Silver Mines Inc. (FSM:NYSE; FVI:TSX; FVI:BVL; F4S:FSE), where we made 50% in a month, having bought it on June 14 at about $2.53:
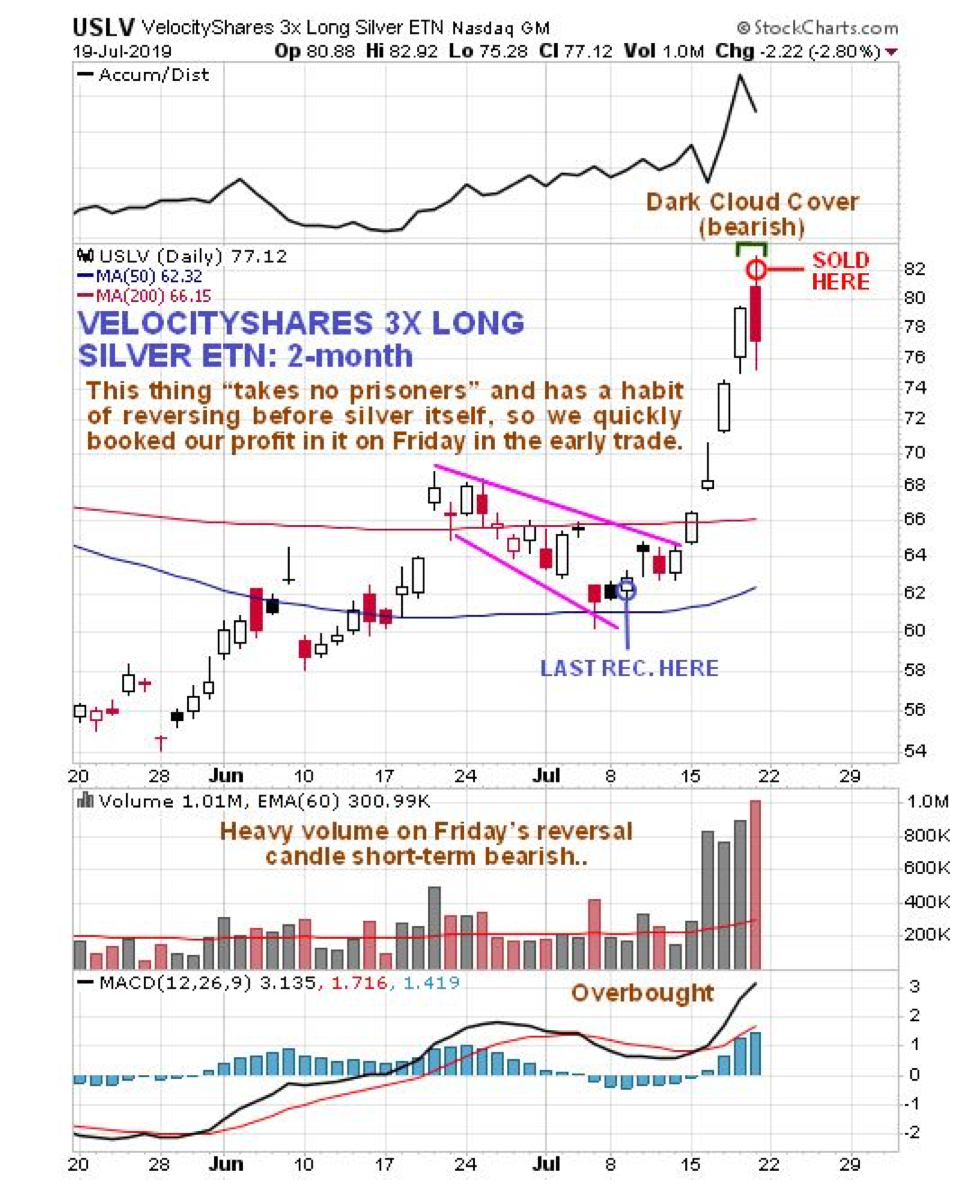
And VelocityShares 3X Long Silver ETN, where we made about 30% in less than two weeks on our last purchase:
The conclusion is that while the medium- and long-term outlook for silver is excellent, a period of consolidation or reaction looks likely over the short to medium term.
Clive Maund has been president of www.clivemaund.com, a successful resource sector website, since its inception in 2003. He has 30 years’ experience in technical analysis and has worked for banks, commodity brokers and stockbrokers in the City of London. He holds a Diploma in Technical Analysis from the UK Society of Technical Analysts.
Disclosure: 1) Clive Maund: I, or members of my immediate household or family, own securities of the following companies mentioned in this article: None. I personally am, or members of my immediate household or family are, paid by the following companies mentioned in this article: None. My company has a financial relationship with the following companies mentioned in this article: None. CliveMaund.com disclosures below. I determined which companies would be included in this article based on my research and understanding of the sector. 2) The following companies mentioned in this article are billboard sponsors of Streetwise Reports: None. Click here for important disclosures about sponsor fees. 3) Statements and opinions expressed are the opinions of the author and not of Streetwise Reports or its officers. The author is wholly responsible for the validity of the statements. The author was not paid by Streetwise Reports for this article. Streetwise Reports was not paid by the author to publish or syndicate this article. The information provided above is for informational purposes only and is not a recommendation to buy or sell any security. Streetwise Reports requires contributing authors to disclose any shareholdings in, or economic relationships with, companies that they write about. Streetwise Reports relies upon the authors to accurately provide this information and Streetwise Reports has no means of verifying its accuracy. 4) This article does not constitute investment advice. Each reader is encouraged to consult with his or her individual financial professional and any action a reader takes as a result of information presented here is his or her own responsibility. By opening this page, each reader accepts and agrees to Streetwise Reports’ terms of use and full legal disclaimer. This article is not a solicitation for investment. Streetwise Reports does not render general or specific investment advice and the information on Streetwise Reports should not be considered a recommendation to buy or sell any security. Streetwise Reports does not endorse or recommend the business, products, services or securities of any company mentioned on Streetwise Reports. 5) From time to time, Streetwise Reports LLC and its directors, officers, employees or members of their families, as well as persons interviewed for articles and interviews on the site, may have a long or short position in securities mentioned. Directors, officers, employees or members of their immediate families are prohibited from making purchases and/or sales of those securities in the open market or otherwise from the time of the interview or the decision to write an article until three business days after the publication of the interview or article. The foregoing prohibition does not apply to articles that in substance only restate previously published company releases. As of the date of this article, officers and/or employees of Streetwise Reports (including members of their household) own securities of Fortuna Silver, a company mentioned in this article.
Charts provided by the author.
CliveMaund.com Disclosure: The above represents the opinion and analysis of Mr Maund, based on data available to him, at the time of writing. Mr. Maund’s opinions are his own, and are not a recommendation or an offer to buy or sell securities. Mr. Maund is an independent analyst who receives no compensation of any kind from any groups, individuals or corporations mentioned in his reports. As trading and investing in any financial markets may involve serious risk of loss, Mr. Maund recommends that you consult with a qualified investment advisor, one licensed by appropriate regulatory agencies in your legal jurisdiction and do your own due diligence and research when making any kind of a transaction with financial ramifications. Although a qualified and experienced stock market analyst, Clive Maund is not a Registered Securities Advisor. Therefore Mr. Maund’s opinions on the market and stocks can only be construed as a solicitation to buy and sell securities when they are subject to the prior approval and endorsement of a Registered Securities Advisor operating in accordance with the appropriate regulations in your area of jurisdiction.
Technical analyst Clive Maund charts the latest moves in the gold and precious metals markets.
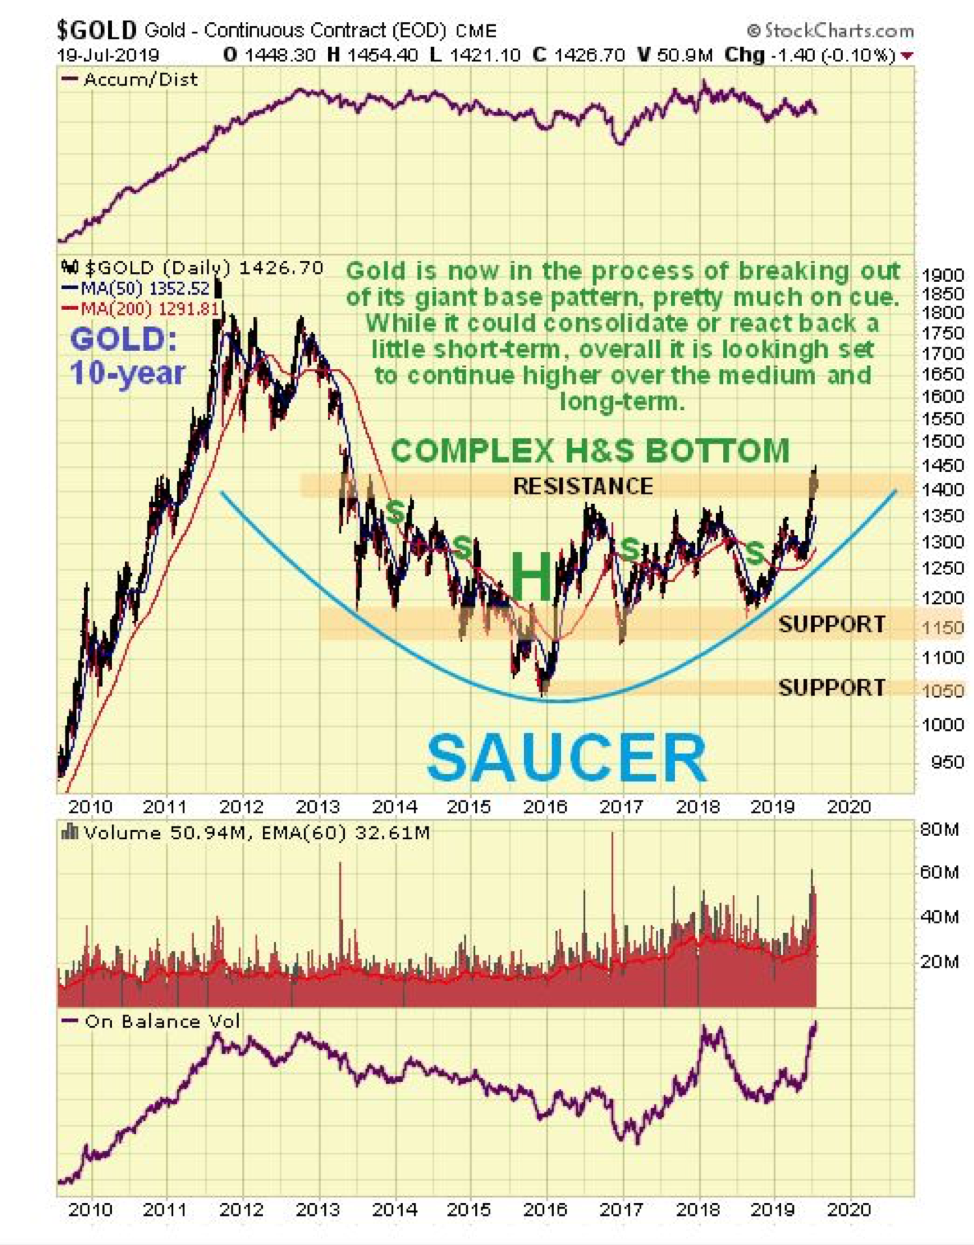
It’s a case of “so far so good” for gold, which is breaking out on schedule from its giant, complex, head-and-shoulders base, which may also be classified as a saucer base, as can be seen on its latest 10-year chart.
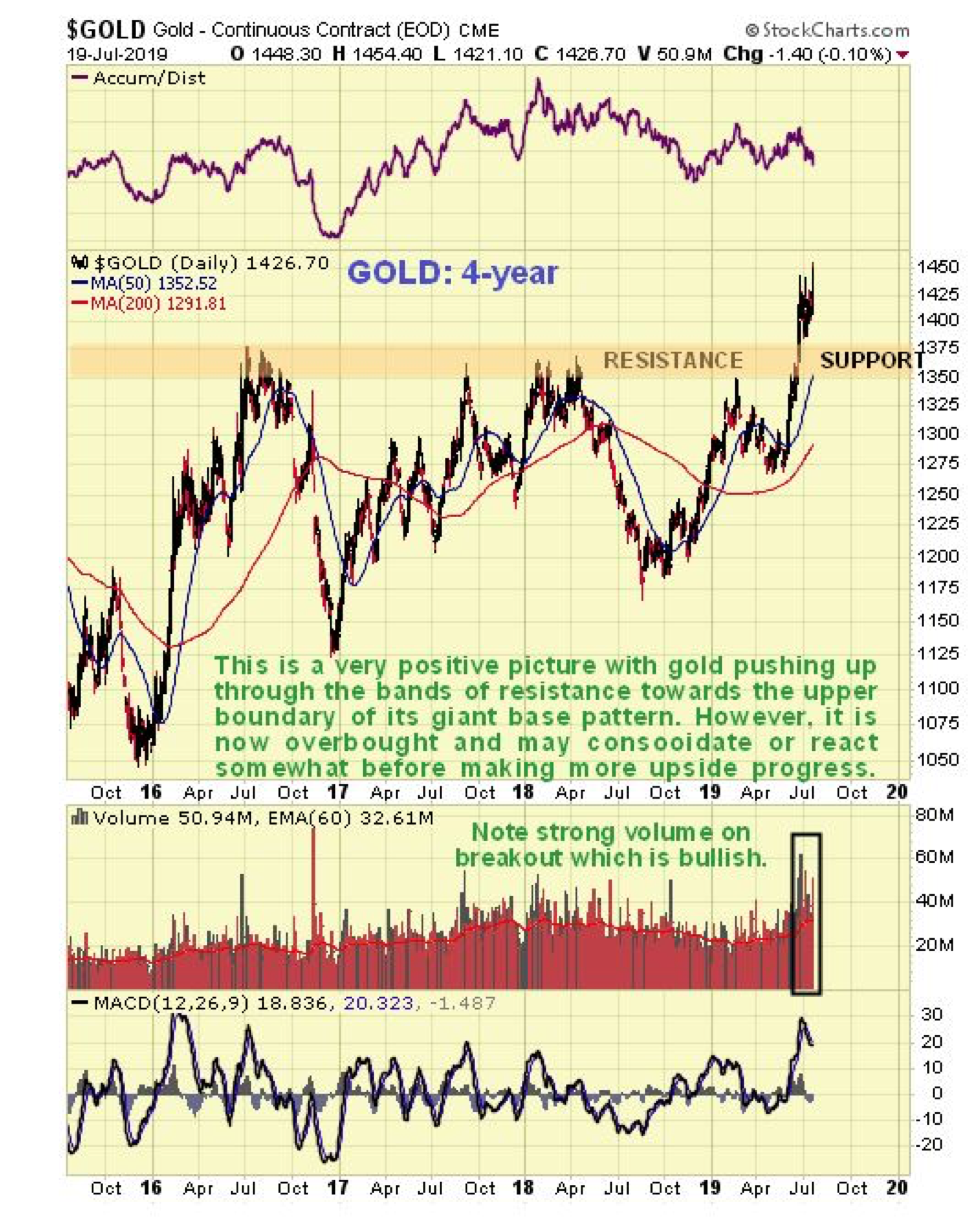
On the four-year chart we can see that gold’s breakout move last month has resulted in its becoming overbought, which partly explains why is hasn’t gone anywhere in recent weeks. This is normal following a breakout and it could react back to about $1,375 before the advance resumes.
On the latest six-month chart we can see that recent price/volume action increases the risk of a near-term reaction, because gold has tried twice to break out of a possible bull flag/pennant, on Thursday and Friday, and failed. This failure (thus far at least) was made more likely and perhaps presaged by the weak accumulation line. A failed pennant breakout usually leads to a period of retreat.
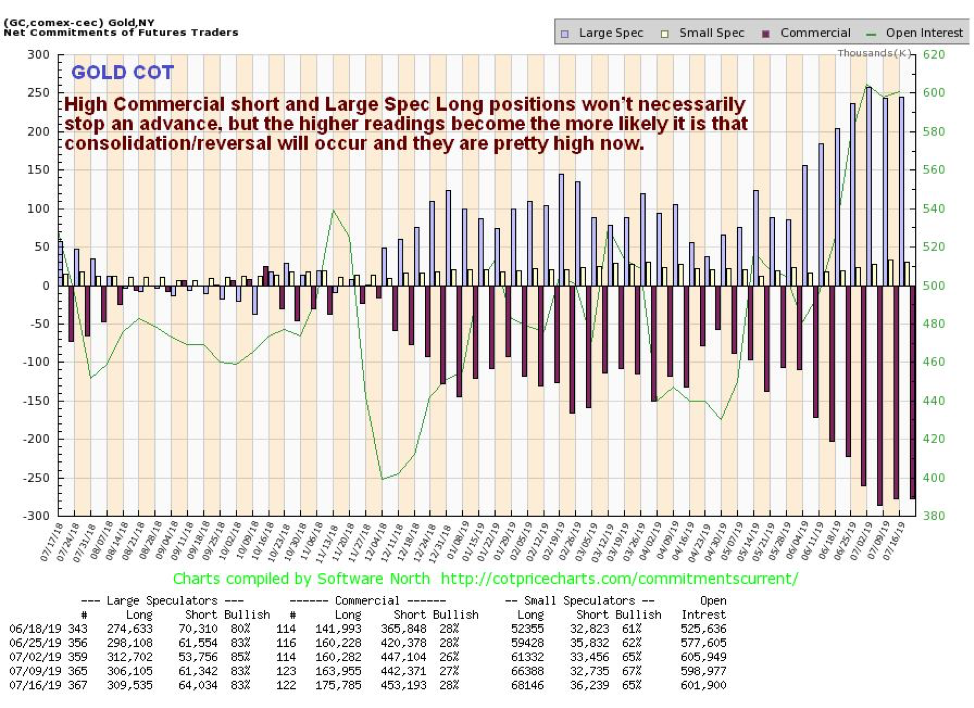
While gold’s latest COT readings do not preclude further advance, it is clear that it would benefit from an easing of current Commercial short and Large Spec long positions, which are rather extreme and increase the chances of some sort of reaction here.
The big picture is strongly bullish but, barring the Iran situation dramatically worsening, it looks like a period of consolidation/reaction is likely before further significant gains are made. If gold and the sector do react, it is considered unlikely that it will be by much and any such reaction may be used to add to positions across the sector.
It was rather odd late last week that, while gold tried to break higher but failed to, the precious metals sector forged ahead on Wednesday and Thursday, as we can see on the latest six-month chart for GDX. Normally, stocks rallying leads to gold following suit, but gold’s price/volume action was not bullish for the near term, and nor was the action in GDX on Friday, which saw a bearish Harami pattern appear, which is where a large candle the previous day is followed by a small one that fits inside the first one. This is bearish and usually marks a reversal, and thus probably marks the start of a corrective phase.
Clive Maund has been president of www.clivemaund.com, a successful resource sector website, since its inception in 2003. He has 30 years’ experience in technical analysis and has worked for banks, commodity brokers and stockbrokers in the City of London. He holds a Diploma in Technical Analysis from the UK Society of Technical Analysts.
Disclosure: 1) Statements and opinions expressed are the opinions of Clive Maund and not of Streetwise Reports or its officers. Clive Maund is wholly responsible for the validity of the statements. Streetwise Reports was not involved in the content preparation. Clive Maund was not paid by Streetwise Reports LLC for this article. Streetwise Reports was not paid by the author to publish or syndicate this article. 2) This article does not constitute investment advice. Each reader is encouraged to consult with his or her individual financial professional and any action a reader takes as a result of information presented here is his or her own responsibility. By opening this page, each reader accepts and agrees to Streetwise Reports’ terms of use and full legal disclaimer. This article is not a solicitation for investment. Streetwise Reports does not render general or specific investment advice and the information on Streetwise Reports should not be considered a recommendation to buy or sell any security. Streetwise Reports does not endorse or recommend the business, products, services or securities of any company mentioned on Streetwise Reports. 3) From time to time, Streetwise Reports LLC and its directors, officers, employees or members of their families, as well as persons interviewed for articles and interviews on the site, may have a long or short position in securities mentioned. Directors, officers, employees or members of their immediate families are prohibited from making purchases and/or sales of those securities in the open market or otherwise from the time of the interview or the decision to write an article until three business days after the publication of the interview or article. The foregoing prohibition does not apply to articles that in substance only restate previously published company releases.
Charts provided by the author.
CliveMaund.com Disclosure: The above represents the opinion and analysis of Mr Maund, based on data available to him, at the time of writing. Mr. Maund’s opinions are his own, and are not a recommendation or an offer to buy or sell securities. Mr. Maund is an independent analyst who receives no compensation of any kind from any groups, individuals or corporations mentioned in his reports. As trading and investing in any financial markets may involve serious risk of loss, Mr. Maund recommends that you consult with a qualified investment advisor, one licensed by appropriate regulatory agencies in your legal jurisdiction and do your own due diligence and research when making any kind of a transaction with financial ramifications. Although a qualified and experienced stock market analyst, Clive Maund is not a Registered Securities Advisor. Therefore Mr. Maund’s opinions on the market and stocks can only be construed as a solicitation to buy and sell securities when they are subject to the prior approval and endorsement of a Registered Securities Advisor operating in accordance with the appropriate regulations in your area of jurisdiction.
After the sale of Fronteer to Newmont, the non-core assets were spun off into another company. Two of the projects were in Turkey. Liberty has been trying to do something with them for the last couple of years so they could focus on their US deposits in Idaho and Utah. Just recently Liberty Gold hit the jackpot when a Turkish company announced an offer for their Halilağa copper gold porphyry deposit.
The project is 60% owned by Teck and 40% owned by Liberty Gold. The Turkish company is paying $55 million USD for a 100% interest in three payments over a two-year period. Liberty will be getting $14 million USD when the deal closes in September or so. There will be two additional payments of $4 million USD each on the first anniversary and on the 2nd.
Liberty Gold will continue to own 60% of another Turkish property, the TV Tower gold project. The TV Tower project shows a 43-101 resource of 523,000 ounces of gold and 35 million ounces of silver. Until relations improve between the West and Turkey, TV Tower will remain on the back burner for Liberty but for sale to any interested buyer.
Liberty Gold happens to be sitting in the Cat Bird’s seat. They had the best part of $6 million to devote to their twin oxide gold projects in the US, one in Idaho and one in Utah. Both have been explored by Liberty at a reasonable rate. For the last half dozen years, cash has been king in the junior resource field. Liberty was well cashed up and has picked up two interesting gold projects and is busy moving them forward.
Black Pine has a 43-101 technical report, however Liberty has not yet done a resource for the project. Mining was conducted at Black Pine from 1992 until 1997 at an average grade of 0.63 g/t gold producing 435,000 ounces.
Liberty began releasing assay results from their current Black Pine drill program in May. The consistency of the results is a big hint as to the potential for adding a lot of ounces including 1.51 g/t Au over 48.8 meters, 1.45 g/t Au over 45.7 meters and 1.19 g/t Au over 38.1 meters. More results came out in June showing 1.78 g/t Au over 47.2 meters including 3.24 g/t Au over 22.9 meters. Another new discovery was reported in mid-July showing 1.78 g/t Au over 48.8 meters including 4.72 g/t Au over 15.2 meters.
I suspect things are going to get very interesting soon. Mark O’Dea isn’t in the habit of collecting interest on a saving account. He is going to be sitting on about $22$25 million in cash in CAD. I think he will advance the drill programs at Black Pine and Goldstrike and be looking around for other interesting properties.
Mark O’Dea has a certain magic touch. While the current market cap of $125 million CAD may seem like a lot to investors used to dealing with juniors under $10 million, the value is backed up with over a million ounces in Utah, a lot of gold and silver in Turkey that someone is going to want one day and a prior producing gold mine in Idaho. Remember that he sold his last major project for $2.3 billion. That’s billions with a capital B. He and his highly qualified team certainly could pull another Fronteer off and increase the market cap by a factor of 20. He has the team, he has the projects and he has the brains.
Liberty Gold is an advertiser and as such I am biased. Please do your own due diligence.
Liberty Gold LGD-T $0.62 (Jul 22, 2019) LGDTF-OTCQB 207.6 million shares Liberty Gold website.
Bob and Barb Moriarty brought 321gold.com to the Internet almost 16 years ago. They later added 321energy.com to cover oil, natural gas, gasoline, coal, solar, wind and nuclear energy. Both sites feature articles, editorial opinions, pricing figures and updates on current events affecting both sectors. Previously, Moriarty was a Marine F-4B and O-1 pilot with more than 832 missions in Vietnam. He holds 14 international aviation records.
Disclosure: 1) Bob Moriarty: I, or members of my immediate household or family, own shares of the following companies mentioned in this article: None. My company has a financial relationship with the following companies mentioned in this article: Liberty Gold is an advertiser on 321 Gold. I determined which companies would be included in this article based on my research and understanding of the sector. 2) The following companies mentioned are billboard sponsors of Streetwise Reports: Liberty Gold. Click here for important disclosures about sponsor fees. 3) Statements and opinions expressed are the opinions of the author and not of Streetwise Reports or its officers. The author is wholly responsible for the validity of the statements. The author was not paid by Streetwise Reports for this article. Streetwise Reports was not paid by the author to publish or syndicate this article. The information provided above is for informational purposes only and is not a recommendation to buy or sell any security. Streetwise Reports requires contributing authors to disclose any shareholdings in, or economic relationships with, companies that they write about. Streetwise Reports relies upon the authors to accurately provide this information and Streetwise Reports has no means of verifying its accuracy. 4) The article does not constitute investment advice. Each reader is encouraged to consult with his or her individual financial professional and any action a reader takes as a result of information presented here is his or her own responsibility. By opening this page, each reader accepts and agrees to Streetwise Reports’ terms of use and full legal disclaimer. This article is not a solicitation for investment. Streetwise Reports does not render general or specific investment advice and the information on Streetwise Reports should not be considered a recommendation to buy or sell any security. Streetwise Reports does not endorse or recommend the business, products, services or securities of any company mentioned on Streetwise Reports. 5) From time to time, Streetwise Reports LLC and its directors, officers, employees or members of their families, as well as persons interviewed for articles and interviews on the site, may have a long or short position in securities mentioned. Directors, officers, employees or members of their immediate families are prohibited from making purchases and/or sales of those securities in the open market or otherwise from the time of the interview or the decision to write an article until three business days after the publication of the interview or article. The foregoing prohibition does not apply to articles that in substance only restate previously published company releases. As of the date of this article, officers and/or employees of Streetwise Reports LLC (including members of their household) own securities of Liberty Gold, a company mentioned in this article.
By CentralBankNews.info Argentina’s central bank fixed the rate of its benchmark Leliq notes at 58.0 percent until July inflation is announced on Aug. 15 to “guarantee the contractionary nature of the monetary policy.” The Central Bank of the Argentine Republic (BCRA), which on July 1 lowered the minimum interest rate on Leliq notes to 58.0 percent from 62.50 percent that was set on April 1, added in a statement from July 22 that it may revise the Leliq minimum rate when July inflation numbers are known to reflect inflation, inflation expectations, internal and external and financial conditions, and other macroeconomic data. Argentina’s inflation data are published by the National Institute of Statistics and Censuses (INDEC) and the national consumer price index inflation for July is scheduled for Aug. 15. This follows primaries in the run-up to general elections in October, when Prime Minister Mauricio Macri is up for election. In June Argentina’s annual inflation rate declined for the first time this year to 55.8 percent from 57.3 percent in May while monthly inflation slowed for the third straight month to 2.7 percent. From October 20178 until April this year BCRA employed a monetary policy framework in which the interest rate on Leliq notes was set through auctions, and thus fluctuated daily, while it targeted the monetary base in order to push down inflation. The weighted average rate on Leliq notes, which the central bank uses as its monetary policy rate, rose as high as 74 percent on May 2 but since then it has declined and remained below 70 percent since June 6 and below 60 percent since July 5. On July 22 the rate was 58.78 percent. The decision to lower the minimum Leliq rate to 58 percent on July 1 was to ensure that its monetary policy did not relax during July, when demand normally rises from the collection of bonuses and expenses in connection with the winter holiday. Today BCRA’s monetary policy committee COPOM said the goal for the monetary base during the July-August period was unchanged at $1.343 billion and it would be using a bi-monthly average to determine if the monetary base target was met to avoid any excessive contraction in July.
Almost a decade ago, the global financial crisis of 2008-09 exposed billions of people to the risks within the global financial/banking sector. With all this money flowing around the globe and with banks able to facilitate greater and more diverse risk/derivatives investments, the central banks and insurance companies are left with an incredible “black hole” of exposed risk that is almost impossible to quantify. When we add the shadow/gray market banking risks into this equation and begin to understand the complexity of commodity-backed or Purchase Order backed financing that has become commonplace throughout the planet, we have to ask ourselves one question – “what would it take for these risks to become another crisis?”
Deutsche Bank Massive Exposure Could Cripple Europe
A recent article we found on ZeroHedge highlights the risk exposure from Deutsche Bank and how that derivatives/banking risk could spill over into another global financial market crisis again.
The ZeroHedge article stated that Deutsche Bank has $49 trillion dollars in derivatives exposure, making it the single greatest danger to Europe and global financial institutions imaginable at this time.
This additional article from TheStreet, from May 2016, highlights the continued risks associated with the global financial system and the level of derivatives risk that is inherent in the system.
Here is a quote from that article that attempts to rationalize debt exposure…
”Let’s take the latest data in Deutsche Bank’s annual report for 2015. It shows that the bank’s total, notional exposure to derivatives transactions is 41.9 trillion euros ($46.8 trillion). While that’s more than 35% lower than its 2013 exposure, it still looks huge.
However, after offsetting the positive and negative exposures against each other, the net exposure is a much more manageable 18.2 billion euros ($20.3 billion).”
The data that we’ve been able to find regarding US exposure to the global derivatives market is rather limited in scope. The Federal Reserve Bank of St. Louis provides some data, but we believe this data fails to include shadow/gray banking risks. Traders must be aware of the fact that the global economy has been running on ether after the 2009 market collapse. Global central banks have poured capital into the markets and foreign economies have consumed vast amounts of easy-money capital to run up huge debt levels while creating massive shadow/gray level financial systems.
In our opinion, the current global banking situation is far more fragile now than it was 10 years ago. The US is in a far better position to handle risks and exposure to risks than it was in 2008-09 and the real issue before us is the level of unknown risks that are a complete black hole in the foreign markets.
Ray Dalio Says Gold Is the Best Asset During Global Financial Reset And Eric Sprott Likes Gold Also.
A recent article by Ray Dalio, he stated gold is the asset in which we should all be accumulating as it will be a top performer globally when things start to fall apart. On May 31st Eric Sprott talked about my gold forecast in detail. Since then I have accumulated more gold and silver from Eric Sprott’s company https://www.SprottMoney.com/ and you should too.
Eric Sprott Gold & Silver
Federal Reserve Bank Data Is A Warning Sign
Ok, now take a look at these graphs from the Federal Reserve Bank of St. Louis to see the data that is currently being reported.
Net US Acquisitions of non-derivatives assets have been relatively tame over the past 6+ years. We can see from this chart the continued acquisition of assets from 2002 through 2007-08 – just before the credit crisis event. Then, we can see how dramatically the assets were dumped between 2007 and 2009. We’re not seeing that type of setup or event play out currently in the US.
This next chart highlights the US financial derivatives net position and we can see the peak in 2008-09 and the dramatic deleveraging that has taken place over the past 8+ years. This chart shows the US financial derivatives levels are less than 25% of the levels from the start of 2008. ($31B vs $125B).
This last chart highlights the fact that US investors and institutions have been deleveraging from derivatives recently – as shown by the net negative transactions data on this chart. This suggests that investors are worried about the future and have been attempting to remove risk from their investments since the peak in early 2018. Notice similar net transaction declines in 2014-15 and 2009-10.
We believe the dips in these assets are related to US Quantitative Easing actions and investor concerns regarding the elimination of easy money policies. We will take a look at when and how these correlations to risk aversion and QE actually take place in Part II.
In the second part of this article, we’ll explore how the US economy, US Fed and global banking sector could be complicating this derivative risk exposure and how traders need to prepare for this event – if it takes place as we suspect.
If you want to see 5 other crucial warning signs about the US markets and global economic downturn just take a look at this short video and charts.
In early June I posted a detailed video explaining in showing the bottoming formation and gold and where to spot the breakout level, I also talked about crude oil reaching it upside target after a double bottom, and I called short term top in the SP 500 index. This was one of my premarket videos for members it gives you a good taste of what you can expect each and every morning before the Opening Bell. Watch Video Here.
I then posted a detailed report talking about where the next bull and bear markets are and how to identify them. This report focused mainly on the SP 500 index and the gold miners index. My charts compared the 2008 market top and bear market along with the 2019 market prices today. See Comparison Charts Here.
On June 26th I posted that silver was likely to pause for a week or two before it took another run up on June 26. This played out perfectly as well and silver is now head up to our first key price target of $17. See Silver Price Cycle and Analysis.
More recently on July 16th, I warned that the next financial crisis (bear market) was scary close, possibly just a couple weeks away. The charts I posted will make you really start to worry. See Scary Bear Market Setup Charts.
On June 17th I showed my chart of the transportation index forming a double top formation. It’s known that the transportation index leads the broad stock market and if the transports are breaking down then we must expect the bear market is close. I then went on to talk about the precious metals breakout with silver and silver miners leading the way. Gold miners broke out as well while gold continued to hold its bullish formation. See Transportation index double top.
CONCLUDING THOUGHTS:
In short, you should be starting to get a feel of where stocks are headed along with precious metals for the next 8-24 months. The next step is knowing when and what to buy and sell as these turning points take place, and this is the hard part. If you want someone to guide you through the next 12-24 months complete with detailed market analysis and trade alerts (entry, targets and exit price levels) join my ETF Trading Newsletter.
This bear market has been a long time coming, but finally, almost all the signs are showing that it’s about to start. As a technical analyst since 1997 having lost a fortune and made fortunes from bull and bear markets I have a good understanding of how to best attack the market during its various stages.
Be prepared for these incredible price swings before they happen and learn how you can identify and trade these fantastic trading opportunities in 2019, 2020, and beyond with our Wealth Building & Global Financial Reset Newsletter. You won’t want to miss this big move, folks. As you can see from our research, everything has been setting up for this move for many months – most traders/investors have simply not been looking for it.
Join me with a 1 or 2-year subscription to lock in the lowest rate possible and ride my coattails as I navigate these financial market and build wealth while others lose nearly everything they own during the next financial crisis.
As a technical analysis and trader since 1997, I have been through a few bull/bear market cycles. I believe I have a good pulse on the market and timing key turning points for both short-term swing trading and long-term investment capital. The opportunities starting to present themselves will be life-changing if handled properly.
FREE GOLD OR SILVER WITH MEMBERSHIP!
Kill two birds with one stone and subscribe for two years to get yourFREE PRECIOUS METAL and get enough trades to profit through the next metalsbull market and financial crisis!