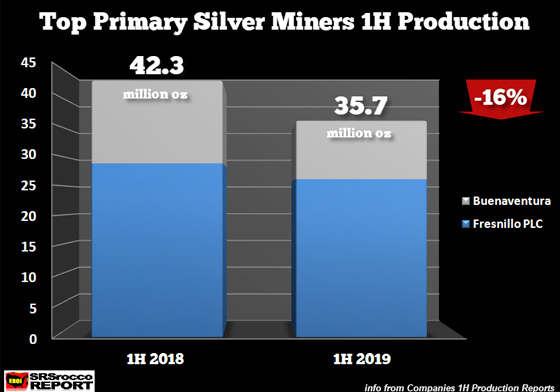
As the silver price continues to break out of its lows, two of the top primary mining companies are experiencing major production declines in the first half of the year. Mexico’s Fresnillo PLC and Peru’s Buenaventura’s top primary silver mines saw a significant decrease in production due to either falling ore grades, decreased volumes of processed ore, poor weather, or labor strikes.
The largest silver miner in the world, Fresnillo PLC, just released their 1H 2019 production results, showing declines in all three of their major silver operations. The Fresnillo, Saucito, and San Julian Mines reported a combined 13% decline in silver production during the first half of the year while Buenaventura’s Uchucchacu Mine suffered a 40% decline.
Total silver production from Fresnillo PLC and Buenaventura fell 6.6 million oz (Moz) or 16% 1H (Jan-Jun) 2019 versus 1H 2018:
If the current trend continues, the top two primary silver miners in the world could experience an 8-10% reduction in total mine supply in 2019. That is a considerable weakening of production right at the very same time the silver price is experiencing some strength in the market.
According to Fresnillo PLC, the company forecasted 2019 silver production to be in the range of 58-61 Moz. If we include Fresnillo PLC’s Silverstream supply, total silver production for the first half of the year is 27.5 Moz. Thus, the company is on track to produce 56-57 Moz, the lower end of their forecast.
Buenaventura’s total silver production in 2018 was 26.8 Moz, and they are forecasting a range of 22-25 Moz for 2019. However, I believe total silver production for Buenaventura in 2019 will likely be at the lower end of the range at 22-23 Moz.
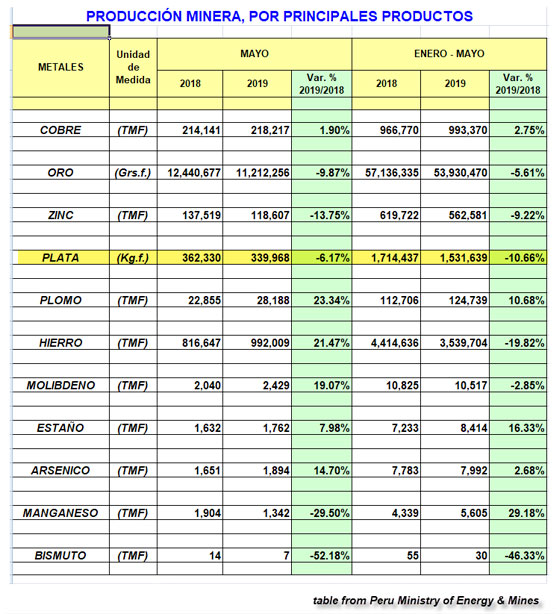
Moreover, the largest primary silver mine in Peru is the Uchucchacu Mine. Because it’s production has fallen considerably this year, it has impacted the country’s silver output quite negatively. The Peru Ministry of Energy and Mines just released their May 2019 metal production report showing that the country’s silver mine supply is down 10.6 % versus the same period last year:
Furthermore, Mexico’s INEGI reported a 4% decline in the country’s silver production in the first four months of the year. However, that doesn’t include the loss of silver production due to the shutdown of the Penasquito Mine on April 29th, (which lasted until June 17th). It will be interesting to see what Mexico’s total silver production will be for the first half of 2019 versus the same period last year.
Lastly, the lower silver price trend over the past five years has put a great deal of pressure on the primary silver mining industry. While the industry has been able to cut costs and become more efficient in dealing with weaker silver and base metal prices, there’s no wiggle room left for the majority of these companies. Which is why I believe investors should pay close attention to the silver price as it is one of the most undervalued assets in the market.
In the next few days, I will be doing a new article on the Continued Silver Breakout from its “Symmetrical Triangle Formation.” I will be including how the price action has been trading in regards to key technical levels. Also, I plan on putting out a new Youtube video on the Details of the Silver Price Technicals and Fundamentals towards the end of the week.
The Money Metals News Service provides market news and crisp commentary for investors following the precious metals markets.
Weak macroeconomic data had a negative effect on Canadian dollar rate. Will the correction of its quotations continue?
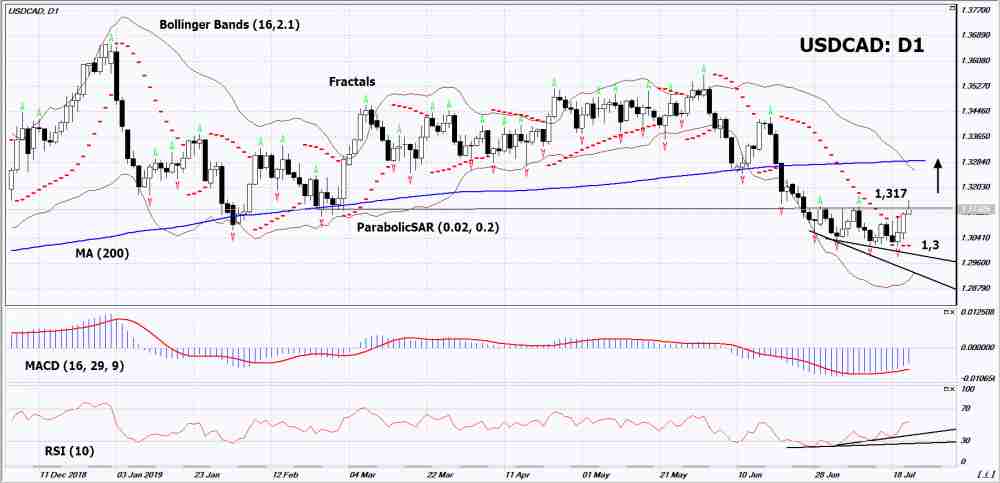
On the USDCAD chart, the weakening of the Canadian dollar looks like a growth in quotations. Wholesale trade in Canada declined by 1.8% in May after a continuous increase over the previous 5 months. The ratio of wholesale stocks to sales (inventory-to-sales) has peaked since 1995. Canadian retail trade also unexpectedly declined in May by 0.1%, while the forecast was 0.3%. All this may be a sign of a slowdown in the Canadian economy and encourage the Bank of Canada to lower the rate this year. Now it is 1.75% and has been at this level since October 2018. On July 31, 2019, GDP data for May are released in Canada, and on August 2, the trade balance for June. It can affect the dynamics of the Canadian dollar. The next meeting of the Bank of Canada will not take place soon – on September 4.
On the daily timeframe USDCAD: D1 is in a neutral trend. Various technical analysis indicators have generated uptrend signals. Correction to the top and further growth of quotations is possible in case of a decrease in the rate of the Central Bank of Canada.
The Parabolic indicator shows a signal to increase.
The Bolinger bands is narrowing indicating volatility decrease.
The RSI indicator is above the 50 mark. It has formed a divergence to increase.
The bullish momentum may develop if USDCAD exceeds its last maximum: 1,317. This level can be used as an entry point. The initial stop lose may be placed below the two last lower fractals and the Parabolic signal: 1.3. After the opening the pending order, stop shall be moves following the signals of Bollinger and Parabolic to the next fractal minimum. Thus, we are changing the potential profit/loss to the breakeven point. More risk-averse traders may switch to the 4-hour chart after the trade and place a stop loss moving it in the direction of the trade. If the price meets the stop level (1,3) without reaching the order (1,317), we recommend to cancel the order: the market sustains internal changes that were not taken into account.
A team of US trade delegates is reportedly due to fly to Shanghai next week to re-open trade talks with Chinese officials. These talks will be the first since the Trump/Xi meeting at the recent G20 summit. These will also be the first talks since negotiations broke down in May.
Market Remains Hopeful
Optimism, in response to news of a successful meeting between Trump and Xi in Japan last month, was clearly visible in asset markets. US equities surged to fresh highs. Tensions had been boiling over prior to the meeting between the two leaders. Both countries were engaged in a fresh round of tit-for-tat tariffs as well as other hostilities.
Groundwork In Place
US Trade Representative Robert Lighthizer and Treasury Secretary Steven Mnuchin have spoken with their Chinese counterparts earlier in the month to lay the groundwork for the talks. While there is optimism over these fresh efforts to deliver a deal, there are still plenty of key issues causing division such as laws around intellectual property and the forced transfer of foreign technology.
IMF Downgrades World Growth
The latest IMF update released this week has highlighted the urgent need for a resolution to the situation. In its half-yearly World Economic Outlook, the IMF projects global growth to be 0.1% lower in both 2019 and 2020 than it forecast last time around. Now, forecasts are 3.2% and 3.5% respectively.
IMF: China Hurt More Than US
The report did, however, endorse Trump’s claims that the trade war has hit China harder than the US. The report’s country-by-country breakdown showed an upgraded forecast for US growth this year. US growth increased from 2.3% to 2.6%. On the other hand, it was a downgraded forecast for China. Growth was expected to move from 6.3% to 6.2%.
Commenting on China in the report, the IMF said:
“In China, the negative effects of escalating tariffs and weakening external demand have added pressure to an economy already in the midst of a structural slowdownand needed regulatory strengthening to rein in high dependence on debt.”
IMF Warns US
Despite the upgraded US growth forecast, the IMF did have a message of warning for the US. They said that “Multilateral and national policy actions are vital to placing global growth on a stronger footing.”
They further said:
“The pressing needs include reducing trade and technology tensions and expeditiously resolving uncertainty around trade agreements (including between the UK and the EU and the free trade area encompassing Canada, Mexico, and the US). Specifically, countries should not use tariffs to target bilateral trade balances or as a substitute for dialogue to pressure others for reforms.”
Technical Perspective
USDCNH has ground to a halt over recent weeks as the market awaits new updates on the first set of trade talks to take place. Interestingly, USD has weakened against CNH since trade talks collapsed in May. However, we have seen a recovery of around 50% since the June lows.
For now, USDCNH remains hemmed in between support at the 6.8182 level and resistance at the 6.8982 level. A topside break will put the focus back onto 6.94812. On the other hand, a move to the downside brings 6.7484 into play next.
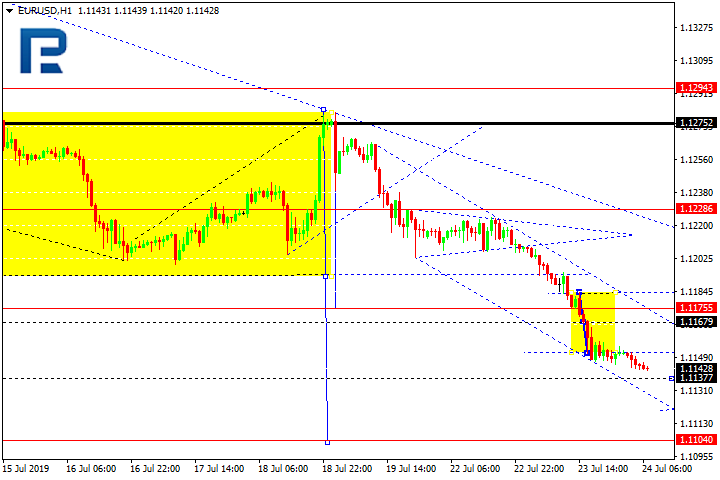
The pair has reached 1.1180 and broken it downwards through the consolidation range. There is potential for continuation of the trend to 1.1111. The goal is local.
GBPUSD
The instrument has created a consolidation range around 1.2480 and broken it top down. There is potential for a decline to 1.2404, after which growth to 1.2480 may follow.
USDCHF
The pair has created a consolidation range around 0.9852. Today the market has escaped it upwards. There is potential for growth to 0.9876. The goal is local. Then a decline to 0.9852, then growth to 0.9898 may follow. The goal is first.
USDJPY
The instrument keeps developing the structure of growth. Today it may reach 108.34, then continue the downtrend to 107.37. Upon breaking this level downwards potential for continuation of the trend to 106.44 may appear. The goal is local.
AUDUSD
Today the instrument keeps developing the second impulse for declining. The goal is at 0.6969. The goal is local. Then growth to 0.7014, and then a decline to 0.6947 may follow.
USDRUB
The pair has reached 63.25 in accordance with the correction matrix. Today the development of a consolidation range around this level seems possible. Upon escaping the correction channel downwards another wave of declining to 62.25 may begin.
GOLD
Gold is trading in the structure of the third impulse for decline. The goal is at 1412.50. Then a correction to 1440.15 may begin, followed by a decline to 1414.30.
BRENT
Oil is trading in a correction structure aimed at 64.35. Then another structure of declining to 61.08 may develop, followed by growth to 64.35. Practically, we are considering the development of a wide consolidation range.
Attention! Forecasts presented in this section only reflect the author’s private opinion and should not be considered as guidance for trading. RoboForex LP bears no responsibility for trading results based on trading recommendations described in these analytical reviews.
On H4 we can see that the first correcting wave of growth after a convergence reached 38.2% Fibo in relation with the previous descending trend. The new impulse for declining may be regarded as another wave of descending into the post-correctional extension area of 138.2-161.8% (1.2400 – 1.2335). However, if the impulse do not break the local minimum, a bonce may provoke the beginning of another wave of growth and the extension of the correction phase to 50.0% (1.2583) and 61.8% (1.2630).
On H1 it can be noted that the short-term downtrend has been corrected by growth to 38.2% Fibo. The correcting growth may go on to 50.0% (1.2488), 61.8% (1.2505) and 76.0% (1.2525). A breakthrough of the minimum at 1.2417 may signal further decline.
EURJPY
On H4 the pair demonstrates the end of the correction phase and stable development of the downtrend wave. The goals of the decline are: 76.0% (120.25) and the post-correction extension area 138.2-161.8% (119.80-119.20) Fibo. The resistance is at 61.8% (21.61).
On H1 a downtrend to 76.0% (120.25) Fibo is developing, forming a convergence.
Attention! Forecasts presented in this section only reflect the author’s private opinion and should not be considered as guidance for trading. RoboForex LP bears no responsibility for trading results based on trading recommendations described in these analytical reviews.
Peter Epstein of Epstein Research checks into the most recent developments announced by this company, which include planting 130,000 hemp plantlets on 40 acres.
Note: Figures are in Canadian dollars (CA$). Mentions of peer group revenue are for trailing 12-month periods ended January, February, March, April or May 2019, depending on fiscal year end. Data compiled from SEDAR, SEC.gov, the CSE website, TMX Money, OTC Markets and Yahoo Finance. Note: I compare California Gold Mining Inc. to my own peer group of 305 hemp, CBD, MSO, cannabis, extraction, etc., names. Ranked by Enterprise Value, CGM.CSE was #175 as of July 19.
The news of July 16 was pretty big and really good. In addition to an update on the previously announced, fully funded, 27,000-square-foot greenhouse, California Gold Mining Inc. (CGM:CSE; CFGMF:OTCQB) completed the purchase of a private 82.42-acre contiguous parcel of farmland in Illinois. Earlier this month, management successfully commenced outdoor cultivation of high-CBD hemp biomass (plants) on about 40 acres.
Immediately following the $0.50 warrant acceleration in June, the company had approximately $2.5 million in cash and just shy of 60 million shares outstanding, for an enterprise value (EV; market cap + debt cash of $39 million. The average number of shares outstanding for a peer group of 305 hemp/CBD/MSO/cannabis/extraction, etc., names that I’m tracking is 170 million.
High CBD hemp seed propagation greenhouse project moved to Illinois
Illinois. . .why does that ring a bell? It’s the latest state, #11, to legalize recreational use of cannabis and is expected to be in the top eight U.S. markets over time. There’s tremendous interest in getting a foothold there. Look no further than last week’s major headline: Curaleaf Holdings (CURA:CSE) is acquiring privately owned GR Companies Inc. for US$875 million. GR is based in Illinois and has a leading presence in the state.
CGM is going to build its greenhouse in the state of Illinois instead of in California. Importantly, the company’s cultivation expert and partner on this first greenhouse, Delta Valley Hemp (private), is based in Chicago, Illinois. Both the 40 acres of hemp plants and seed propagation operations are in Illinois.
Regarding the question that many investors have about the likelihood of additional greenhouses, here’s a quote from company president and CEO Vishal Gupta, from a James West video interview: “I don’t want to be too forward looking here, but, you know, if things go well, you can reasonably expect us to have a rapid expansion of our plans in the 2020 season. . .”
A successful greenhouse project, and one or more to follow, in Illinois, California or other states, would not necessarily be the end of the line. I estimate there are as many as 100 multiple state operators, (MSOs), including private entities with more than four retail stores (dispensaries), that cultivate and sell medical and recreational cannabis across the U.S.
In addition to greenhouses for high-CBD, feminized hemp seed propagation and outdoor hemp cultivation, management is wide open to the highly lucrative CBD extraction/isolation business. By next year, CGM could become one of the first true seed-to-sale companies (most companies don’t propagate their own seeds).
Management is scouting for new farmland to plant additional outdoor hemp crops. I would not be surprised to see one or more transactions by year-end, especially if the current 40-acre project is a success. Investors will know in two to three months the outcome of CGM’s maiden crop voyage.
If CGM can execute, MSOs could be interested in acquiring the company
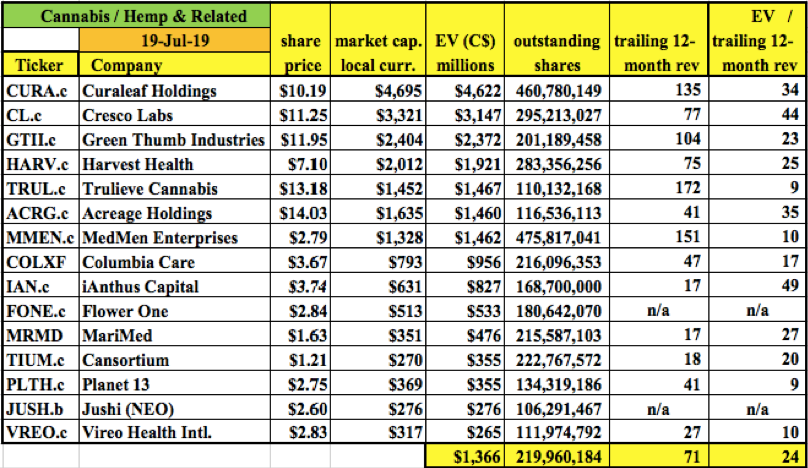
Fifteen of the top 50 largest hemp/cannabis and related companies are MSOs (see chart below). The average EV to revenue multiple of those MSOs is 24 times on average revenue of $71 million. The average EV of the top 15 is ~$1.3 billion. By contrast, CGM’s EV is $39 million (July 19th close).
MSOs might be interested in the vertical integration and business diversification benefits of owning established hemp seed propagation operation(s), plus outdoor hemp capacity, plus (possibly) extraction capabilities. More and more pundits, analysts and consultants are proclaiming that growth in hemp/CBD consumption in the years ahead will outpace that of cannabis.
Yet, MSOs sell almost entirely cannabis products in their retail stores, not hemp-derived CBD products (oils, edibles, topical lotions, etc.) or flower. This is a no-brainer opportunity. . .MSOs would generate increased traffic from customers who wouldn’t enter their stores otherwise, to buy health and wellness products with THC levels below 0.30% and CBD levels above 10%.
Outdoor hemp cultivation on ~40 acres has commenced
Investors were waiting for an update on greenhouse construction in California. . .now it’s going to be in Illinois. Illinois is a better location for the company because it’s an easy drive from hemp cultivation specialist and partner Delta Valley Hemp’s Chicago headquarters.
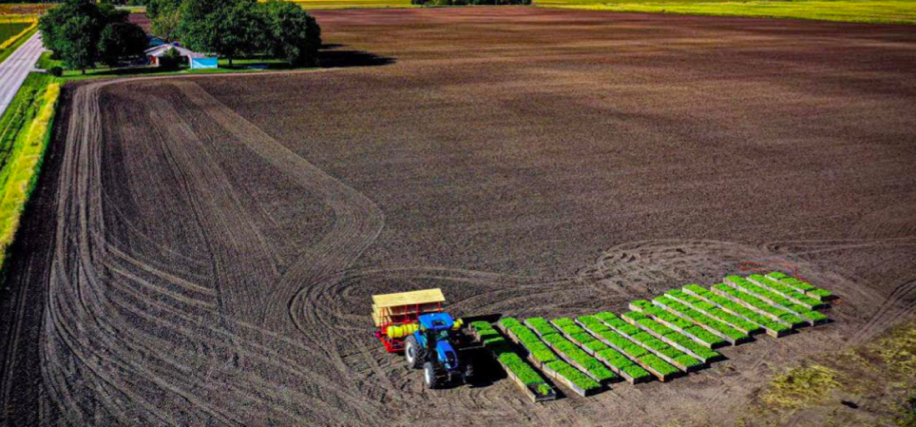
In a new development, CGM announced that it acquired and successfully planted 130,000 hemp plantlets. The crop takes up about half (40 of the 82.42 acres/33.4 hectares) of the newly acquired farmland. Rest assured, there’s ample room for multiple greenhouses, as each 27,000-square-foot structure occupies less than one acre.
California Gold’s president Gupta stated: “The acquisition of the Grove Road Farm provides California Gold with an opportunity to take advantage of the outdoor cultivation season this year, in addition to the development of the Company’s first greenhouse for industrial hemp seed propagation scheduled for completion in Q3 2019. The close proximity of our Chicago-based cultivation consultants Delta Valley Hemp, highly fertile soil, access to abundant water, proximity to three-phase power, and available skilled labor, make the Grove Road Farm an ideal launching pad for the Company’s industrial hemp division. The field has been successfully planted and harvest is anticipated in late- September. We expect revenue realization in October 2019.”
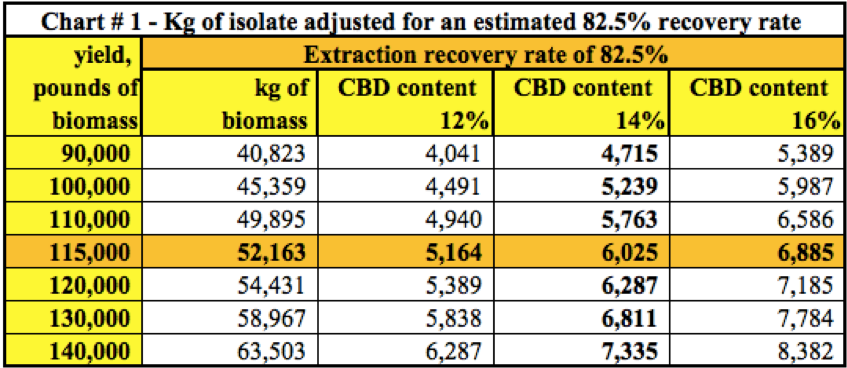
The press release indicated a potential yield of 100130,000 pounds of biomass from the initial crop. In chart #1 below, I calculate how many kilograms (kg) of isolate that might be, assuming an 82.5% recovery rate. In chart #2, I list gross revenue possibilities based on a range of potential isolate prices.
Tens of millions in revenue could be months away
The industrial hemp project has been meaningfully de-risked (but is still risky), because hemp plants are in the ground and operations are fully funded. CGM is officially “in production,” with first revenue expected in October. If all goes reasonably as planned, CGM should have two revenue streams in Illinois.
The timing of the hemp seed propagation project remains on track for revenue by year-end. That would be awesome, but the real prize is 2020, when the two operations alone (there might be more acquisitions) could generate revenue of up to $100 million.
Management believes this is just the beginning of what could come. They are looking at many hemp/CBD/extraction opportunities in many states. A single successful hemp seed cycle, or outdoor harvest this year in Illinois, would generate meaningful cash flow for CGM to go on a hemp/CBD shopping spree.
If CGM can approach $100 million in gross revenue next year, that would move the needle for any MSOespecially if CGM’s two operations are profitable. Only six (15%) of the top 40 peer group names were earnings before interest, taxes, depreciation and amortization (EBITDA)-positive on a trailing 12-month basis.
The crop is being tended to by Delta Valley Hemp and management is negotiating toll extraction contracts. Before year end, shareholders could have a company trading at under two times 2019 revenue, and well under one-time 2020 prospective revenue. Just eight (2.6%) in the entire peer group trade at under a two-times EV/revenue multiple. Three of those eight were EBITDA-positive.
How much might a company with tens of millions of high-quality, profitable revenue be worth? I don’t know. I imagine that CGM could be worth significantly more than $39 million if things go reasonably as planned. As it stands, CGM is ranked #175 in the peer group.
Revenue and profitabilitypositive EBITDAare hugely important
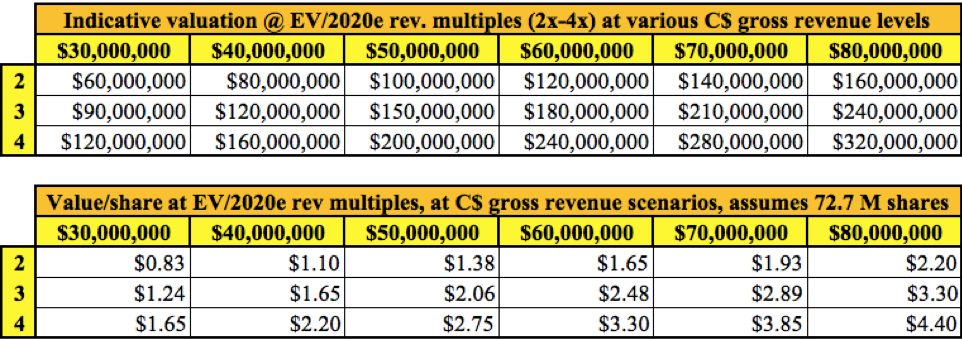
In the chart above are indicative company valuations at various 2020 estimated annual gross revenue scenarios ($3080 million) and EV/revenue multiples (2x4x). The valuations use the fully diluted 72.7 million shares versus 59.6 million currently outstanding. All scenarios are possible with existing operations. Importantly, these are not share price predictions. Share prices almost always trade below, or even well below, their theoretical “values.”
Just like early-stage mining companies trade at a fraction of net asset value (NAV), readers should apply a haircut to the “values” to account for risk. Main risks include product prices, a failed or damaged crop, lower CBD concentrations than expected (in the seed propagation project and in the biomass from the 40-acre crop) greenhouse construction risks, cost overruns and project delays.
Fifty companies with higher EVs than CGM had zero or less than $1 million in revenue. Readers might be surprised to learn that only 24 (7.8%) of the companies in the peer group had more than $50 million, and just 60 (19.5%) more than $20 million in revenue. Consider this: If full year 2020 revenue for my entire database were to sextuple from current levels, there would be 59 names with greater than $100 million in revenue.
This just goes to show how incredibly important revenue and profits will be going forward. The top 50 players account for 85% of the combined 305 EVs and have an average EV/revenue multiple of 41 times. There’s going to be a tsunami of merger and acquisition in coming years.
Conclusion
If management can execute on plans that are well underway and fully funded, California Gold Mining Inc. has a shot of leaping into the top quartile or tercile (as measured by annual revenue) next year. Yes, tercile is a word. While large revenue numbers are far from a sure thing, a hemp crop is in the ground and construction of a fully funded, brand-new, state-of-the art greenhouse begins in August.
With less than 60 million shares outstanding, a free float of roughly 15 million, and no need to issue new shares anytime soon (unless for a compelling acquisition), the next several months promise to be quite exciting!
Peter Epstein is the founder of Epstein Research. His background is in company and financial analysis. He holds an MBA degree in financial analysis from New York University’s Stern School of Business.
Disclosures: The content of this article is for information only. Readers fully understand and agree that nothing contained herein, written by Peter Epstein of Epstein Research [ER], (together, [ER]) about California Gold Mining, including but not limited to, commentary, opinions, views, assumptions, reported facts, calculations, etc., is not to be considered implicit or explicit investment advice. Nothing contained herein is a recommendation or solicitation to buy or sell any security. [ER] is not responsible under any circumstances for investment actions taken by the reader. [ER] has never been, and is not currently, a registered or licensed financial advisor or broker/dealer, investment advisor, stockbroker, trader, money manager, compliance or legal officer, and does not perform market making activities. [ER] is not directly employed by any company, group, organization, party or person. The shares of California Gold Mining are highly speculative, not suitable for all investors. Readers understand and agree that investments in small cap stocks can result in a 100% loss of invested funds. It is assumed and agreed upon by readers that they will consult with their own licensed or registered financial advisors before making any investment decisions.
At the time this article was posted, Peter Epstein owned shares of California Gold Mining and the Company was an advertiser on [ER].
Readers understand and agree that they must conduct their own due diligence above and beyond reading this article. While the author believes he’s diligent in screening out companies that, for any reasons whatsoever, are unattractive investment opportunities, he cannot guarantee that his efforts will (or have been) successful. [ER] is not responsible for any perceived, or actual, errors including, but not limited to, commentary, opinions, views, assumptions, reported facts & financial calculations, or for the completeness of this article or future content. [ER] is not expected or required to subsequently follow or cover events & news, or write about any particular company or topic. [ER] is not an expert in any company, industry sector or investment topic.
Streetwise Reports Disclosure: 1) Peter Epstein’s disclosures are listed above. 2) The following companies mentioned in the article are billboard sponsors of Streetwise Reports: None. Click here for important disclosures about sponsor fees. The information provided above is for informational purposes only and is not a recommendation to buy or sell any security. 3) Statements and opinions expressed are the opinions of the author and not of Streetwise Reports or its officers. The author is wholly responsible for the validity of the statements. The author was not paid by Streetwise Reports for this article. Streetwise Reports was not paid by the author to publish or syndicate this article. Streetwise Reports requires contributing authors to disclose any shareholdings in, or economic relationships with, companies that they write about. Streetwise Reports relies upon the authors to accurately provide this information and Streetwise Reports has no means of verifying its accuracy.
4) The article does not constitute investment advice. Each reader is encouraged to consult with his or her individual financial professional and any action a reader takes as a result of information presented here is his or her own responsibility. By opening this page, each reader accepts and agrees to Streetwise Reports’ terms of use and full legal disclaimer. This article is not a solicitation for investment. Streetwise Reports does not render general or specific investment advice and the information on Streetwise Reports should not be considered a recommendation to buy or sell any security. Streetwise Reports does not endorse or recommend the business, products, services or securities of any company mentioned on Streetwise Reports. 5) From time to time, Streetwise Reports LLC and its directors, officers, employees or members of their families, as well as persons interviewed for articles and interviews on the site, may have a long or short position in securities mentioned. Directors, officers, employees or members of their immediate families are prohibited from making purchases and/or sales of those securities in the open market or otherwise from the time of the interview or the decision to write an article until three business days after the publication of the interview or article. The foregoing prohibition does not apply to articles that in substance only restate previously published company releases.
USD has fallen back a little over the European morning today, tempering the gains seen yesterday as the market reacted with relief to news that Trump agreed on a budget deal with congress. For now, USD remains well supported, sitting firmly above the 97.11 level which should provide support if retested. A raft of US PMIs will provide today’s US data focus for the session ahead. Any downside surprises are likely to take on sharper focus ahead of the FOMC next week.
Data Weighs on EUR Ahead of ECB
EURUSD has broken lower again today in response to a raft of weaker than expected Eurozone and German PMI data sets. Further data weakness has compounded expectations that the ECB will announcefresh easing at it July meeting tomorrow. While opinions are split regarding which form the easing will take, the key focus will be on Draghi’s forward guidance for the remainder of the year. EURUSD trades 1.1141 last, having found support at the 1.1130 level.
GBP Jumps On BoJo Win
GBPUSD has enjoyed a much stronger session so far today with price ripping higher off the 1.2439 support to trade 1.2481 last.It seems that the election of Boris Johnson as the new conservative party leader (and consequently the new UK PM) is fuelling a squeeze higher in cable. Johnson has vowed to deliver Brexit by the current Halloween deadline, even if it means leaving without a deal.
SPX500 Sinks Lower
Risk assets have not fared so well today. SPX500 has skulked back beneath the 3000.19 level as yesterday’s USD gains continue to weigh on risk appetite. US data later today could provide a reversal in fortunes, however, if we see any weakness. With the Fed expected to announce fresh easing next week, equities are likely to stay supported in the near term.
Safe Havens Strong Against USD
Safe havens have had a better day so far with both gold and JPY slightly higher against USD on the session. USDJPY trades 108.05 last, with price a little below even on the session, having slipped against JPY at the European open. XAUUSD has been firmer too with gold trading 1426.45 last as price continues to climb its way back up towards the 1433.48 level.
EIA Report In Focus
Oil prices have been a little stagnant so far today as momentum pauses following yesterday’s rally. The API yesterday reported its largest drawdown of the year in US crude stores.The market is now waiting on the main EIA report due later today, to confirm the move. This would make the sixth consecutive weekly drawdown and should keep crude further supported above the 56.18 level as it continues to recover recent losses.
CAD Holding, AUD Under Pressure
USDCAD pierced above the 1.3145 level briefly before moving back beneath, where it remains hemmed in for now. A recovery in crude prices has helped boost CAD, putting downside pressure on USDCAD. However, price remains buoyant and further upside looks likely. Today’s EIA report will need to confirm the large US crude drawdown to help keep the loonie weighted
AUDUSD has been moving firmly lower since testing the bearish trend line from 2019 highs last week.Price has now broken back below the .7021 level as well as the .70 psychological level, putting the focus on further downside to come in the near term.
The EUR/USD currency pair continues to show negative dynamics. During yesterday’s and today’s trading, the drop in quotes exceeded 65 points. The trading instrument reached two-month lows. EUR remains under pressure due to rising expectations that the ECB may announce the introduction of additional stimulus measures in the near future. The meeting of the Central Bank will be held on Thursday, July 25. Today, investors will be evaluating important economic releases from the eurozone and the US. Quotes EUR/USD can decline further. We recommend to open positions from key levels.
The Economic News Feed for 24.07.2019:
– a number of indicators on business activity in Germany and the EU – 10:30 (GMT + 3:00) and 11:00 (GMT + 3:00);
– primary real estate sales in the US – 17:00 (GMT + 3:00).
Indicators signal the strength of sellers: the price has fixed below 50 MA and 100 MA.
The MACD histogram is in the negative zone, but above the signal line, which gives a weak signal to sell EUR/USD.
The Stochastic Oscillator started to go out of the oversold zone, the %K line is above the %D line, indicating a technical correction of the EUR/USD currency pair.
Trading recommendations
Support levels: 1.11400, 1.11000
Resistance levels: 1.11650, 1.11850, 1.12100
If the price consolidates below 1.11400, the price will fall toward 1.11000.
Alternatively, the quotes can correct toward 1.11800-1.12000.
The GBP/USD currency pair
Technical indicators of the currency pair:
Prev Open: 1.24673
Open: 1.24370
% chg. over the last day: -0.30
Day’s range: 1.24283 – 1.24497
52 wk range: 1.2397 – 1.3385
The technical picture on the GBP/USD currency pair is still ambiguous. The pound is trading in a flat. Currently, local support and resistance levels are: 1.24200 and 1.24550, respectively. Sterling remains under pressure due to uncertainty around Brexit. Boris Johnson will be the 77th prime minister of Great Britain. Earlier, the official repeatedly stated that Britain would withdraw from the block before October 31, even under the conditions of “tough” Brexit. Positions must be opened from key levels.
Today we recommend to pay attention to economic reports from the USA.
Indicators do not give accurate signals: the price is consolidated near 50 MA and 100 MA.
The MACD histogram is in the negative zone, but above the signal line, which gives a weak signal to sell GBP/USD.
The Stochastic Oscillator is in the neutral zone, the %K line is above the %D line, which indicates bullish moods.
Trading recommendations
Support levels: 1.24200, 1.23850
Resistance levels: 1.24550, 1.24850, 1.25100
If the price consolidates below 1.24200, the price will fall toward 1.23850-1.23600.
Alternatively, the quotes can grow toward 1.24850-1.25000.
The USD/CAD currency pair
Technical indicators of the currency pair:
Prev Open: 1.31179
Open: 1.31307
% chg. over the last day: +0.16
Day’s range: 1.31307 – 1.31433
52 wk range: 1.2727 – 1.3664
The USD/CAD currency pair has stabilized after a sharp rally since the beginning of this week. At the moment, CAD is consolidating. Local levels of support and resistance are 1.31200 and 1.31450, respectively. In the near future technical correction is not excluded. Investors expect statistics from the United States. We also recommend to pay attention to the dynamics of oil prices. Positions must be opened from key levels.
The Economic News Feed for 24.07.2019 is calm.
The price has fixed above 50 MA and 100 MA, which indicates the strength of buyers.
The MACD histogram is located in the positive zone, but below the signal line, which gives a weak signal to buy USD/CAD.
The Stochastic Oscillator is in the neutral zone, the %K line has started to cross the %D line. There are no signals at the moment.
Trading recommendations
Support levels: 1.31200, 1.30950, 1.30650
Resistance levels: 1.31450, 1.31650, 1.32000
If the price consolidates above the level of 1.31450, the quotes will grow toward to 1.31700-1.32000.
An alternative would be a correction of the USD/CAD quotes to 1.31000-1.30850.
The USD/JPY currency pair
Technical indicators of the currency pair:
Prev Open: 107.852
Open: 108.217
% chg. over the last day: +0.33
Day’s range: 108.105 – 108.277
52 wk range: 104.97 – 114.56
A bullish sentiment still prevails on the USD/JPY currency pair. At the moment the trading instrument is consolidating. Key levels of support and resistance are 108.000 and 108.350. Financial market participants expect additional drivers. We recommend to pay attention to economic releases, as well as the dynamics of the US Treasury bonds yield. Positions must be opened from key levels.
The Economic News Feed for 24.07.2019 is calm.
The price has fixed above 50 MA and 100 MA, which indicates the strength of buyers.
The MACD histogram is located in the positive zone, but below the signal line, which gives a weak signal to buy USD/JPY.
Stochastic Oscillator is in the neutral zone, the %K line is below the %D line, indicating a bearish mood.
Trading recommendations
Support levels: 108.000, 107.800, 107.600
Resistance levels: 108.350, 108.600
If the price consolidates above the 108.350 the price will rise toward 108.600-108.800.
Alternatively, the quotes can decline toward 107.800-107.600.
The US and China are all set to resume the trade talks starting today. USD continued to rise to a seven-week high ahead of the meetings. The International Monetary Fund lowered the growth forecasts globally citing trade tensions. However, for the US, growth was raised from 2.3% to 2.6% but growth forecasts for China were lowered from 6.3% to 6.2%.
Euro Slips to a Two-Month Low
The common currency extended declines, falling to a two-month low at 1.1140. The Eurozone consumer confidence data showed that the index registered -6.6 in July from -7.2 in June. This was slightly better than the forecasts. The flash manufacturing and services PMI reports are due to come out later today.
Can EURUSD Hold the Declines?
The decline to 1.1140 level came following the breakout from the minor support level at 1.1250. The Stochastics Oscillator is currently oversold and could indicate that the declines are overdone. As a result, there is scope for the currency pair to rebound. However, the gains are likely to be limited to the 1.1250 level which could act as resistance.
UK Parliament Confirms Johnson as the Next PM
The UK’s Conservative party’s leadership race concluded with the appointment of Boris Johnson. Johnson will replace the outgoing prime minister, Theresa May who resigned after failed attempts to deliver Brexit. The markets were widely expecting Johnson to win the race. Elsewhere, BoE’s Andy Haldane, in comments said that the MPC will not be pushing for a rate hike when it meets next week.
Will the GBPUSD Rebound off the Two-Year Lows?
The pound sterling is trading near a two-year low for the most part since last week. The currency pair initially bounced off the lows with price action in the past few sessions showing a strong consolidation. The resistance area of 1.2481 remains key. A close above this level could signal some kind of a bullish bias.
Gold Prices Await Cues from the ECB
The precious metal closed in the red on Tuesday, marking the third day of declines. With prices closing back below the recent breakout levels, the precious metal awaits cues from the ECB’s meeting tomorrow. The dovish forward guidance from the ECB is likely to see gold prices waiting to breakout higher once again.
XAUUSD to Remain Muted in the Short Term
With the US and China trade talks, alongside the ECB meeting tomorrow, gold is likely to remain flat in the short term. However, the rebound to the recently held support level at 1431–1428 remains key. If resistance is formed here, we could expect price action to drift lower. The support at 1404 region will be key as it could post further declines if the support level breaks.
The US dollar is strengthening against a basket of major currencies despite weak economic data. So, existing home sales counted to only 5.27M in July instead of the forecasted value of 5.35M. The US dollar index (#DX) closed in the positive zone (+0.49%). Euro’s decline supports the US currency. Thus, the euro has reached two-month lows before the ECB meeting. Financial market participants expect the ECB to give signals for lowering interest rates at tomorrow’s meeting.
UK Prime Minister, Theresa May, is resigning today due to the victory of Boris Johnson in the election of the Conservative Party leader. Thus, from today, Johnson will become the 77th Prime Minister of the UK. It should be recalled that the official is a supporter of the “hard” Brexit and most likely wants the UK to exit the EU before October 31. At the same time, some members of the Conservative Party are ready to oppose Johnson and his Brexit position. It is not yet known whether the official will be able to enlist the support of the majority in the House of Commons and avoid no-deal Brexit. Otherwise, his opponents will act against him.
The “black gold” prices show positive dynamics. At the moment, futures for the WTI crude oil are testing the mark of $57.10 per barrel. At 17:30 (GMT+3:00) weekly crude oil inventories will be published in the US.
Market Indicators
Yesterday, the bullish sentiment was observed in the US stock markets: #SPY (+0.72%), #DIA (+0.63%), #QQQ (+0.65%).
The 10-year US government bonds yield is at 2.05-2.06%.
The news feed for 2019.07.24:
– A number of indicators on economic activity in Germany and the Eurozone at 10:30 (GMT+3:00) and 11:00 (GMT+3:00), respectively; – New home sales in the US at 17:30 (GMT+3:00).
We also recommend paying attention to the speech by the UK Prime Minister Theresa May.