Crude Rallies As EIA Reports 6th Straight Drawdown

By Orbex

Crude oil has rallied strongly this week on the back of the latest industry reporting. The report signaled a continued decline in US crude stores. Price was initially shunted higher on Tuesday in reaction to the API report. It reflected a sixth consecutive weekly drawdown in US crude inventories, falling by 11 million barrels.

EIA Reports Further Drawdown in US Crude

However, it was the headline report on Wednesday from the EIA that the market was waiting for. The Energy Information Administration’s report, covering the week ending July 19th, showed that US crude stores dropped by 10.8 million barrels. This was far below the market forecast of a 4 million barrel decline. This confirmed the sixth consecutive weekly decline in US crude stores.

Elsewhere, the data showed that crude stores at the Cushing delivery hub in Oklahoma were down by 429k barrels. Overall US production was also down again last week, falling by a further 700k barrels to 11.3. Production is now down around 1 million barrels per day from recent record highs. This is largely due to the shut down in production facilities as a result of Hurricane Barry.

Summer Driving Season Hits

The report also showed that refinery crude runs were down by a large 233k barrels per day with utilization falling by 1.3%. Gasoline inventories were also down. These fell by 230k barrels per day last week, though this was less than the forecasted 730k barrel drop.

Distillate stockpiles, which include diesel and heating oil, were also lower last week, falling by 613k barrels per day. This was greater than the 499k barrel drawdown that the market was looking for and reflects the uptick in demand for diesel due to the summer driving season in the US.

OPEC Cuts Take Hold

The continued decline in US crude inventories will be welcomed by OPEC, which recently announced an extension to its current production cuts. There have been an increasing number of reports recently, outlining concerns for the demand outlook in oil, especially heading into next year. Both OPEC and the EIA, as well as the IEA, have downgraded their demand outlook as a result of slowing world trade.

Trade Talks In Focus

However, with the US and China due to restart trade talks next week there is upside risk. Oil price was strongly higher earlier in the year due to optimism over a potential US/China trade deal. While this deal failed to materialize, leading to a fresh outbreak of trade tariffs between the US and China, there are new hopes now that both countries, in a bid to avoid economic damage, will work to deliver a deal this time around.

Technical Perspective

crude oil

Crude oil has moved back under the top of the bearish channel running from 2019 highs as the rejection from 60.29 continues. Price briefly pierced above the level earlier this month, only to find strong selling pressure. The 55.79 level offered support, an is still underpinning price at this point, keeping focus on a possible move higher. If we break down from here, however, focus will shift to a test of 51.26 next and beyond that, the channel low.

By Orbex
 

Japanese Candlesticks Analysis 25.07.2019 (EURUSD, USDJPY)

Article By RoboForex.com

EURUSD

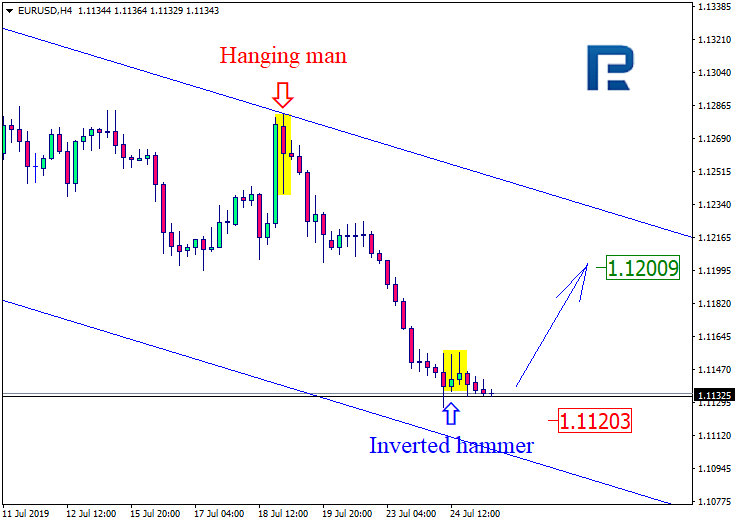
On H4 the pair is testing the horizontal support level, forming reversal patterns, including an Inverted Hammer. In the current trading situation it may be supposed that if the signal for the reversal patterns is realized, the price may bonce and head for 1.1200, forming a descending channel. AT the same time, a breakaway of the support level and a decline to 1.1120 are not to be excluded.

EURUSD
Risk Warning: the result of previous trading operations do not guarantee the same results in the future

USDJPY

On H4, inside the downtrend, the pair has formed a group of reversal patterns, including a Doji. At the current stage of the reversal pattern realization we can see a small flat. Comparing with the previous movements, we may suppose that upon testing the upper border of the channel the price may start declining to 107.20. AT the same time a reverse scenario should not be excluded: the price may break through the resistance, renew the maximums and grow towards 108.96.

USDJPY

Article By RoboForex.com

Attention!
Forecasts presented in this section only reflect the author’s private opinion and should not be considered as guidance for trading. RoboForex LP bears no responsibility for trading results based on trading recommendations described in these analytical reviews.

USD Holds On Despite Manufacturing Miss

By Orbex

Dollar Upside Despite Data Slump

USD has strengthened again today, with the index extending the week’s advance above the 97.11 level. Today’s gains come on the back of disappointing economic data release. The US manufacturing PMI released yesterday showed the sector falling to its lowest level in almost a decade over June. While USD is rising, the near term outlook looks bearish as the Fed is widely expected to cut rates next week.

Euro Under Pressure

EURUSD has been under pressure today also, weighed on by the rally in USD. The market is expecting the ECB to announce fresh easing today meeting.  The ECB has clearly signaled its intent in recent comments and expectations have been reinforced by weakness in Eurozone data. EURUSD trades 1.1127 last, having broken below the 1.1130 support which has been underpinning price action recently.

Sterling Still Supported

GBPUSD has managed to trade in the green over the European morning today. GBPUSD bounced higher earlier in the week in response to news that Boris Johnson was successful in his bid for leadership of the conservative party, making him the UK’s new PM. However, price has since moved lower, retracing around half of those gains to trade 1.2457 last.

SPX500 Retreats From Highs

Risk assets have traded lower today, though the retracement is shallow and looks likely to be short-lived. SPX500 is still trading above the 3019.38 level for now as price remains supported by expectations of a US rate cut next week. Furthermore, optimism over fresh US/China trade talks, due to start next week, will likely keep equities bid.

Safe Havens Rallying

Safe havens have been higher against USD today, despite strength in the index. Gold and JPY have both moved higher against USD, supported by retreating equities prices. USDJPY trades 108.09 last as price continues to range between support at the 107.90 level and resistance around 108.28. Gold prices are likely to stay supported going into the FOMC next week given expectations for a US rate cut.

Crude Rallies On Continuing US Inventories Drawdown

Oil prices have been higher again today. Price is rallying strongly in reaction to yesterday’s EIA report which showed that US crude inventories fell by nearly 11 million barrels last week. This latest decline marks the sixth consecutive decline in US crude stores which is helping assuage concerns about the US demand outlook. Crude trades 56.41 last, with price trading back above the recently broken 56.18 level.

CAD Climbing, But AUD Upturned

USDCAD has struggled today with higher crude prices supporting CAD. USDCAD trades 1.3125 last as the 1.3145 continues to offer resistance.  An expected US rate cut next week is likely to make upside even more difficult. Tomorrow’s US GDP print will be keenly watched by traders and any downside surprise is likely to be met with swift USD selling given the current backdrop.

AUDUSD has traded to the downside again today. A resurgent US dollar, as well as lower equity prices, have weighed on the recent recovery in AUD. Price trades .6970 last, having moved firmly back beneath both the .7021 level and the .70 level also. However, the decline is currently still holding the rising trend line from year to date lows, keeping hopes of further upside alive for now.

By Orbex


Ichimoku Cloud Analysis 25.07.2019 (AUDUSD, NZDUSD, USDCAD)

Article By RoboForex.com

AUDUSD

The instrument is trading at 0.6963 below the Cloud, which suggests a descending trend. Testing of the signal lines of the Cloud near 0.6975 is expected, followed by a decline to 0.6915. Yet another signal of decline may be a bounce off the upper border of the descending channel. The scenario may no longer be valid in case the upper border of the Cloud is broken and trading closes above 0.7015, which may be followed by further growth above 0.7085.

AUDUSD
Risk Warning: the result of previous trading operations do not guarantee the same results in the future

NZDUSD

The instrument is trading at 0.6692 below the Ichimoku Cloud which suggests a descending trend. A test of the lower border of the Cloud near 0.6705 is expected, followed by a decline to 0.6645. Yet another signal of decline may be a bounce off the upper border of the descending channel. The scenario may no longer be valid in case the upper border of the Cloud is broken and trading closes above 0.6750, which may be followed by further growth to 0.6835.

NZDUSD
Risk Warning: the result of previous trading operations do not guarantee the same results in the future

USDCAD

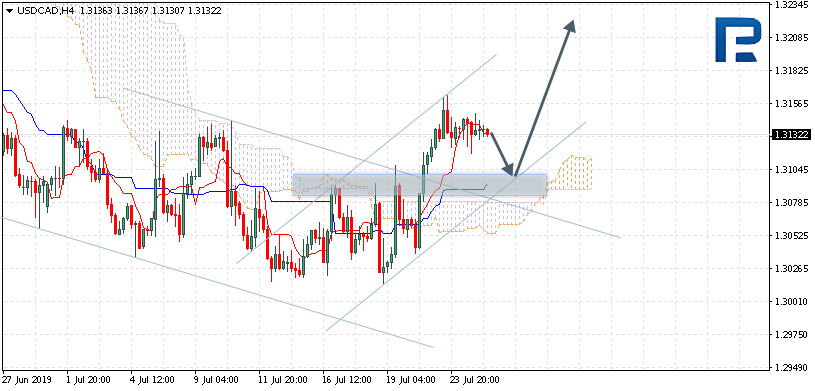
The instrument is trading at 1.3132 above the Ichimoku Cloud which suggests an ascending trend. Testing of the signal lines of the indicator near 1.3105 is expected, followed by growth to 1.3210. Yet another signal of growth may be a bounce off the lower border of the ascending channel. The scenario may no longer be valid in case the lower border of the Cloud is broken and trading closes below 1.3050, which may be followed by further decline to 1.2965.

USDCAD

Article By RoboForex.com

Attention!
Forecasts presented in this section only reflect the author’s private opinion and should not be considered as guidance for trading. RoboForex LP bears no responsibility for trading results based on trading recommendations described in these analytical reviews.

Silver Surges On China Trade Hopes

By Orbex

Gold

With a heatwave hitting the European banking capital of London this week it seems that activity has ground to a halt. Gold prices saw a fairly subdued week of trading with price ending the session roughly unchanged from the open. Gold had been initially lower on the week due to a surge in USD strength. This was seen in response to news that Trump struck a budget deal with Congress.

The deal, which saw a bipartisan compromise of a higher increase in non-defense spending, means that the US will avoid another government shutdown. However, US economic data over the week helped gold recover off these lows.

The US manufacturing sector printed its lowest PMI reading last month in almost a decade. This latest insight into the doom and gloom of US manufacturing puts even more focus on the need for a resolution to Trump’s trade war. US delegates are due to restart talks with China next week. The market is hopeful that the two sides will be able to deliver a deal this time. This comes following the recent breakdown in negotiations in May.

The IMF’s latest outlook has also added pressure to the need for a resolution. The group slashed its forecasts for global growth next year. They cited the negative impact from the ongoing trade war and, while it upgraded US growth, it warned America about the damage that protectionist trade policies cause.

With the Fed widely expected to cut rates next week, the near term outlook for gold remains positive. The key focus next week will be on the size of the rate cut as well as the forward guidance for the Fed. The market is currently pricing in a .25% rate reduction as well as one further cut this year. However, pricing for a larger rate cut has increased and such a move would certainly be a boost for gold.

gold

Gold prices remain hemmed in against the 1433.04 highs this week. Price has been testing this level for several weeks now and continues to find selling pressure. However, while price remains above the 1374.26 level, focus remains on further upside and an eventual break of the current multi-year highs.

Silver

Silver prices broke from their recent correlation with gold to trade firmly higher this week. Prices are trading up to their highest levels since June last year. The prospect of a trade deal between the US and China is keeping silver prices well bid. The reason why is due to silver’s frequent industrial usage. A rate cut next week would further support silver prices, which many investment banks have been forecasting to move higher.

silver

The rally in silver prices this week has seen the completion of the large corrective ABCD move into 16.5883.  While the price is, for now, still above the broken bearish trend line, bulls will need to see a break above current highs to negate the bearish reversal pattern.

By Orbex


The Analytical Overview of the Main Currency Pairs on 2019.07.25

by JustForex

The EUR/USD currency pair

Technical indicators of the currency pair:
  • Prev Open: 1.11515
  • Open: 1.11408
  • % chg. over the last day: -0.09
  • Day’s range: 1.11331 – 1.11432
  • 52 wk range: 1.1111 – 1.2009

The EUR/USD currency pair has stabilized after a rather long decline. At the moment, investors have are waiting for the ECB meeting. Participants in financial markets have weakened forecasts for lowering interest rates by the Central Bank at the current meeting. At the same time, most experts believe that the regulator may pave the way for softening the monetary policy in the near future, as the growth of the eurozone economy slows down. We recommend to pay attention to the comments and rhetoric of the ECB. Additional pressure on the euro is driven by the weak reports on business activity for July in Germany and the EU. At the moment, the quotes are consolidating in the range of 1.11300-1.11500. Positions must be opened from these marks.

The Economic News Feed for 25.07.2019:

  • – IFO Business Climate Index (GER) – 11:00 (GMT+3:00);
  • – ECB Interest Rate Announcement (EU) – 14:45 (GMT+3:00);
  • – Durable Goods Sales Report (US) – 15:30 (GMT+3:00);
EUR/USD

Indicators signal the strength of the sellers: the price has fixed below 50 MA and 100 MA.

The MACD histogram is in the negative zone, but above the signal line, which gives a weak signal to sell EUR/USD.

The Stochastic Oscillator is located near the oversold zone, the %K line has started to cross the %D line. There are no signals at the moment.

Trading recommendations
  • Support levels: 1.11300, 1.11000
  • Resistance levels: 1.11500, 1.11850, 1.12100

If the price fixes below 1.11300, expect a further decline toward 1.11000-1.10800.

Alternatively, the quotes can correct toward 1.12000.

The GBP/USD currency pair

Technical indicators of the currency pair:
  • Prev Open: 1.24370
  • Open: 1.24828
  • % chg. over the last day: +0.38
  • Day’s range: 1.24709 – 1.24870
  • 52 wk range: 1.2397 – 1.3385

Yesterday, bullish sentiment prevailed on the GBP/USD currency pair. The quotes grew by 80 points. This movement is largely due to technical factors. The GBP remains under pressure. Participants in financial markets are wary of the “hard” Brexit scenario, in which Britain will leave the European Union without a trade agreement. At the moment, the trading instrument is consolidating in the range of 1.24550-1.24900. We recommend to open positions from key levels.

Today, the publication of important economic releases from the UK is not planned.

GBP/USD

Indicators do not give accurate signals: the price crossed 50 MA and 100 MA.

The MACD histogram is close to the 0 mark.

Stochastic Oscillator is in the oversold zone, the %K line crossed the %D line. There are no signals at the moment.

Trading recommendations
  • Support levels: 1.24550, 1.24200, 1.23850
  • Resistance levels: 1.24900, 1.25200, 1.25550

If the price consolidates above 1.24900, expect further growth toward 1.25200-1.25400.

Alternatively, the quotes can descend toward 1.24300-1.24100.

The USD/CAD currency pair

Technical indicators of the currency pair:
  • Prev Open: 1.31307
  • Open: 1.31395
  • % chg. over the last day: +0.07
  • Day’s range: 1.31290 – 1.31446
  • 52 wk range: 1.2727 – 1.3664

The USD/CAD is in a sideways movement. There is no defined trend. CAD is testing local support and resistance levels: 1.31200 and 1.31500, respectively. USD/CAD quotes have the potential for further recovery. Today, investors will evaluate important statistics from the United States. We also recommend to pay attention to the dynamics of oil prices. Positions must be opened from key levels.

The Economic News Feed for 25.07.2019 is calm.

USD/CAD

Indicators do not give accurate signals: the price crossed 50 MA.

The MACD histogram is located near 0.

The Stochastic Oscillator is in the neutral zone, the %K line crossed the %D line. There are no signals at the moment.

Trading recommendations
  • Support levels: 1.31200, 1.30950, 1.30650
  • Resistance levels: 1.31500, 1.31650, 1.32000

If the price consolidates above the 1.31500, expect further growth 1.31800-1.32000.

Alternatively, the quotes can drop toward 1.30900-1.30750.

The USD/JPY currency pair

Technical indicators of the currency pair:
  • Prev Open: 108.217
  • Open: 108.177
  • % chg. over the last day: -0.03
  • Day’s range: 108.076 – 108.240
  • 52 wk range: 104.97 – 114.56

An ambiguous technical picture emerged on the USD/JPY currency pair. Trading instrument is in lateral movement. Local levels of support and resistance are 108.000 and 108.300. Financial market participants expect important economic reports from the United States. We recommend to keep track of current information regarding trade negotiations between the United States and China. Positions must be opened from key levels.

The Economic News Feed for 25.07.2019 is calm.

USD/JPY

Indicators do not give accurate signals: the price crossed 50 MA.

The MACD histogram is located near the 0 mark.

The Stochastic Oscillator is in the neutral zone, the %K line crossed the %D line. There are no signals at the moment.

Trading recommendations
  • Support levels: 108.000, 107.800, 107.600
  • Resistance levels: 108.300, 108.600

If the price consolidates above the 108.300 mark, expect further growth toward 108.600-108.800.

Alternatively, the quotes can descend toward 107.800-107.600.

by JustForex

ECB Likely To Cut Or Ease Come Autumn

By Orbex

The European Central Bank will be holding its monetary policy meeting later today in Frankfurt. The meeting will be crucial, considering that the ECB President Mario Draghi hinted at further easing a month ago.

The monetary policy meeting comes on the back of the inflation data for June. Latest eurozone economic data revealed that consumer prices rose higher than expected. On a year over year basis in June, consumer prices grew 1.3%. Despite the gains, this was still off the ECB’s 2.0% inflation target rate.

Core inflation rate also grew modestly but still remains far off from the ECB’s inflation target rate.

Heading into the ECB’s monetary policy meeting, the central bank is expected to leave the main refinancing operations unchanged at zero percent. The central bank is also expected to leave the marginal lending facility at 0.25% and the deposit facility rate at -0.40%.

The ECB has kept the deposit facility rate unchanged at -0.40% since June 2014.

Draghi Hints at Fresh Stimulus

The ECB President Mario Draghi hinted that the European Central Bank could unleash more stimulus if the economy continued to stagnate. His comments came at a press conference in Sintra, Portugal in mid-June.

His comments came against the backdrop of a slower demand globally and lack of inflationary pressures. Following his comments, the euro currency dropped sharply lower, inviting the ire of US President Trump.

Trump has been a vocal opponent to the ECB and has alleged that the central bank pursues a weaker exchange rate policy to be competitive. The ECB refutes the allegations.

Will the ECB Take any Measures at this Meeting?

Following Draghi’s dovish comments, the markets are expecting to hear some announcement at today’s meeting. However, the monetary policy is unlikely to see any changes today.

On the contrary, it is quite likely that the ECB could tweak its forward guidance. This could mean that there is a possibility that Draghi will announce a rate cut at the September meeting.

While it is unclear on the timing, the forward guidance will give investors more clarity.

There is also talk about the central bank restarting its bond purchase program. By some accounts, the ECB could also announce its QE program once again.

Speculation is that the central bank could announce as much as 15 billion euro in the new quantitative easing program. This is likely to start sometime in autumn this year.

Why the Dovish Shift from the ECB?

The central bank ended its QE program in December 2018. Back then, the Eurozone had just logged a solid year in economic growth. The ECB signaled that interest rates could raise by the second half of 2019.

Growth concerns plagued the eurozone ever since the start of the year. Inflation fell sharply over the months. This resulted in a slower pace of growth than expected.

Germany, Europe’s leading economy saw slower growth on the back of a slump in the manufacturing sector.

Other issues such as Italy’s debt levels and the uncertainty due to the Brexit issue remain some of the key risks to the economic growth for the Eurozone. This uncertainty is further heightened by the US and China trade war.

President Trump also turned his attention to the eurozone. At one point, Trump threatened to impose tariffs on imports from the eurozone, putting the region’s growth at further risk.

Against this backdrop, growth in the eurozone slowed significantly. In the first quarter of 2019, eurozone’s GDP growth rate was just 0.40%. On a seasonally adjusted basis, Q1 growth rose 1.2%, comparing to the same period in 2018.

Various international institutions also expect growth to average around just one percent this year.

The ECB’s shift to dovish monetary policy comes on the back of various central banks easing off the rate hike pedal. As a result, it is not surprising that the ECB will be joining ranks with the US Federal Reserve in shifting to a dovish stance.

By Orbex


The US Currency Is Consolidating. Investors Expect the ECB Meeting

by JustForex

The US dollar is changing slightly against a basket of major currencies. The US dollar index (#DX) closed with a slight increase (+0.03%). Yesterday, mixed economic data from the US were published. Thus, the manufacturing PMI counted to 50.0 in July instead of the expected value of 51.0. New home sales increased from 604K to 646K in June. At the same time, market expectations were at the level of 660K.

Investors are focused on the ECB meeting. It is expected that the European Central Bank will not change the key marks of monetary policy following the meeting results, but will give signals to cut interest rates at the next meeting in September.

The US-China trade negotiations are also in the spotlight. The White House announced that a delegation led by US Treasury Secretary Steven Mnuchin and US Trade Representative Robert Lighthizer would go to China on Tuesday, July 30 for the next round of talks. Mnuchin expects progress and believes that more meetings will be needed, which are likely to take place later in Washington.

Yesterday, new UK Prime Minister Boris Johnson delivered a keynote speech and announced his readiness to exit the country from the European Union before October 31. He noted that he intended to conclude a new and better agreement with the EU. The official believes that the deal with the union, which developed Theresa May, is dead.

The “black gold” prices have been recovering after a sharp collapse the day before. At the moment, futures for the WTI crude oil are testing the mark of $56.25 per barrel.

Market Indicators

Yesterday, there was a variety of trends in the US stock markets: #SPY (+0.47%), #DIA (-0.27%), #QQQ (+0.70%).

The 10-year US government bonds yield has fallen. Currently, the indicator is at the level of 2.03-2.04%.

The news feed for 2019.07.25:

– German IFO business climate index at 11:00 (GMT+3:00);
– ECB interest rate decision at 14:45 (GMT+3:00);
– Statistics on durable goods orders in the US at 15:30 (GMT+3:00).

by JustForex

USD Holds Strong Despite Weaker Data

By Orbex

The US dollar was seen holding on to its gains, marking a seven-week high. However, with price closing flat on Wednesday, we could expect to see some downside in the near term. Flash manufacturing PMI from Markit showed the index falling to 50.0. The data underlined weakness in the manufacturing sector. A drop below 50 would indicate a contraction in the sector.

EURUSD Subdued Ahead of Key Policy Meeting

EURUSD was seen holding on to the support area of 1.1140. With the ECB due to meet later today, the currency pair could remain in a consolidating phase for the short term. Depending on the outcome of the ECB meeting, the euro currency could react in either direction.

Will the EURUSD Hold the Support?

The common currency is expected to remain trading near the 1.1140 level in the near term. The bias remains to the downside. The next lower target is seen at 1.1100. However, there is scope for price to pullback modestly higher. The resistance area of 1.1188 will be tested in the near term. A breakout above this level could see further gains in the near term.

EURUSD

WTI Crude Oil Ignores EIA Inventory Draw

Crude oil prices were a bit volatile on Wednesday. The Energy Information Administration’s weekly crude oil inventory report showed a drawdown of 10.8 million bpd. This was larger than forecasts. Yet, oil prices ignored the report as they closed in the red by Wednesday.

Oil Likely to Extend Declines to 54.42 Support

The reversal in oil prices met with the resistance area of 57.50. As a result, oil prices failed to breakout higher above this level. The declines we see could eventually settle near the minor support that is at 54.42 level. As long as this support holds, oil prices could remain caught within the range.

WTI

Gold Prices Consolidate Ahead of ECB’s Meeting

The precious metal is trading within the range from the past few days. This comes as the European Central Bank is due to meet later today. The markets are expecting the ECB to announce plans to restart QE and potentially even cut interest rates lower. The dovish forward guidance could influence gold prices in the short term, to the upside.

Will XAUUSD Breakout from the Resistance?

Gold prices have been trading rather flat just below the resistance area of 1431–1428 level. This sideways range could remain in place in the short term. The bias remains mixed at the moment, however. Gold prices could see an upside breakout if it manages to close convincingly above the resistance area. Alternately, we expect the lower support at 1404 to hold the declines for now.

Gold

By Orbex


EURUSD: pair continues to inch towards 1.1108

By Alpari.com

Previous:

On Wednesday the 24th of July, trading on the euro closed slightly down against the dollar (-0.09%), with trading opening at 1.1150 and closing at 1.1139. The intraday high of 1.1155 was reached in both the European and US sessions, although the bears managed to bring the rate down to 1.1126 during the European session on the back of weak German data, where the manufacturing PMI came out worse than the already pessimistic expectations, marking a decline on the previous reading.

The Markit manufacturing PMI for July came out at 43.1 points, marking a 1.9 point drop on last month’s value of 45 points. The Eurozone is seeing a similar trend, with a drop from 52.2 to 51.5 points. The effects of these reports were short-lived, however, as US PMI data was also worse than expected, with the latest value dropping from its previous value of 50.6 points to 50 against a forecasted rise to 51, resulting in a rise for the euro and a decline on the dollar.

Day’s news (GMT+3):

  • 14:45 Eurozone: ECB interest rate decision.
  • 15:30 US: durable goods orders (Jun).
  • 15:30 Eurozone: ECB monetary policy statement and press conference.

EURUSD H1Current situation:

Nothing major has changed since yesterday, and the market continues to inch towards 1.1108. This level may be reached, and even breached, during the announcement of the ECB interest rate decision and the subsequent monetary policy statement. We may see some sharp fluctuations amid increased volatility, so any short positions that were opened with the breakout of 1.1194 should ideally have protective stop levels in place.

By Alpari.com