Fibonacci Retracements Analysis 02.08.2019 (BITCOIN, ETHEREUM)

Article By RoboForex.com

Fibonacci Retracements Analysis 02.08.2019 (BITCOIN, ETHEREUM)

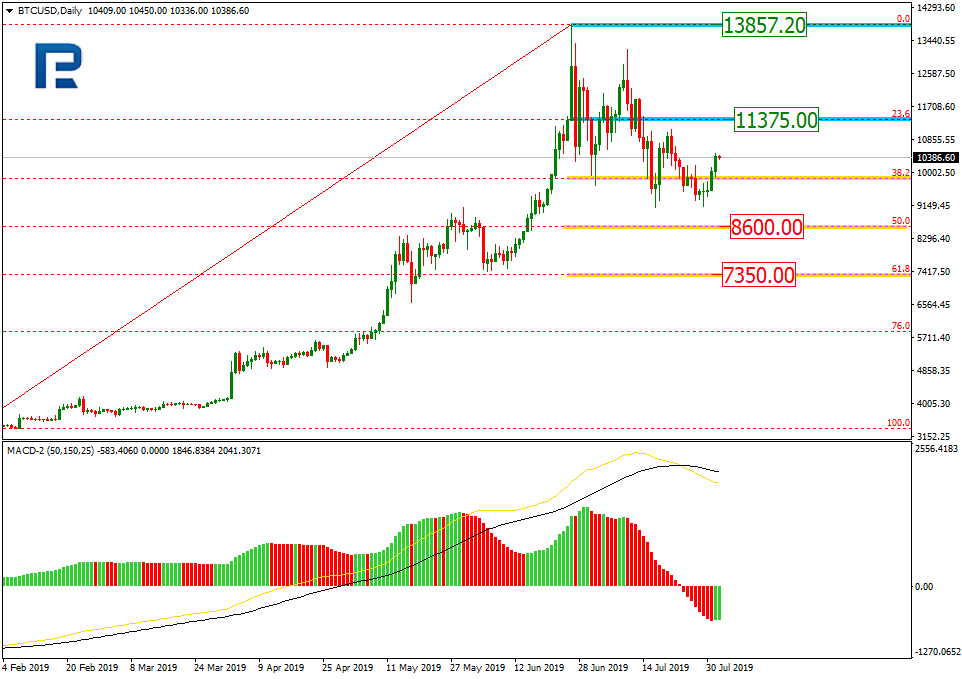
As we can see in the daily chart, BTCUSD is still testing 38.2% fibo. The nest downside targets may be 50.0% and 61.8% fibo at 8600.00 and 7370.00 respectively. The resistance is 23.6% fibo at 11375.00.

BITCOIN
Risk Warning: the result of previous trading operations do not guarantee the same results in the future

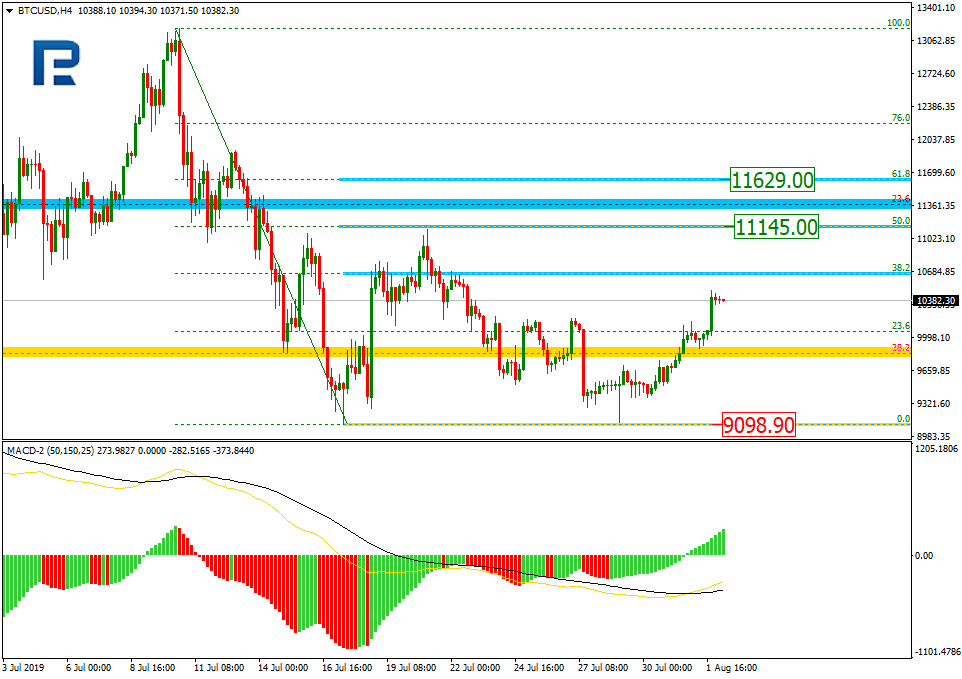
In the H4 chart, the pair is being corrected to the downside. The first correctional wave has almost reached 50.0% at 11145.00. The next wave may test this level and then grow towards 61.8% fibo at 11629.00. The support is the low at 9098.90.

BTCUSD
Risk Warning: the result of previous trading operations do not guarantee the same results in the future

ETHUSD, “Ethereum vs. US Dollar”

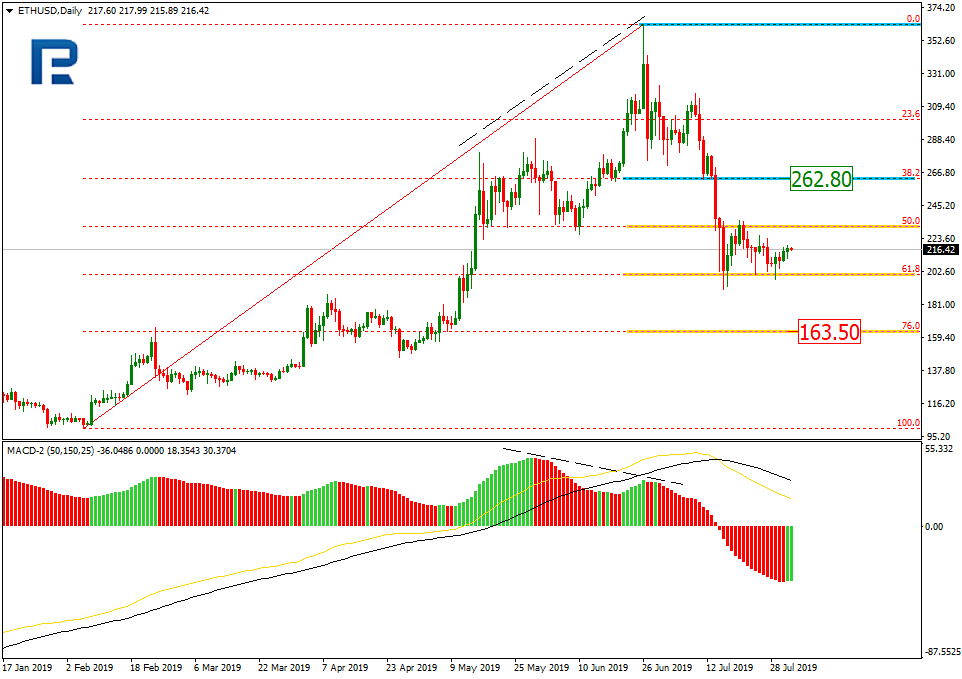
As we can see in the daily chart, ETHUSD is still being corrected between 50.0% and 61.8% fibo. After completing the correction, the pair may fall towards 76.0% fibo at 163.50. The resistance is 38.2% fibo at 262.80.

ETHUSD
Risk Warning: the result of previous trading operations do not guarantee the same results in the future

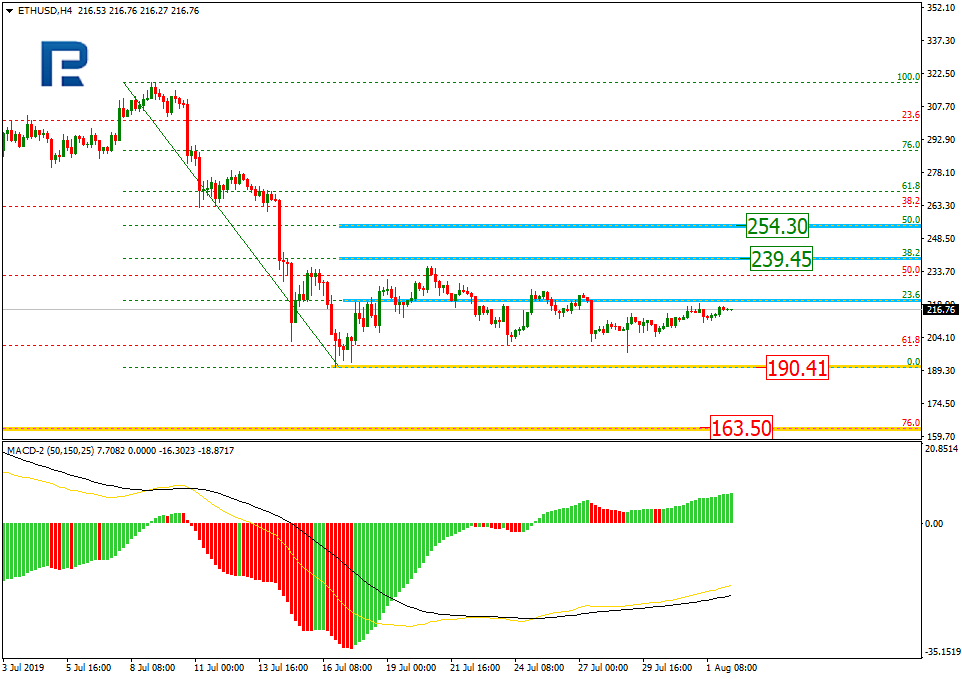
The H4 chart shows more detailed structure of the current correction. After testing 23.6% fibo for the second time, the pair may grow to reach 38.2% and 50.0% fibo at 239.45 and 254.30 respectively. If the price breaks the low at 190.41, the instrument may resume its mid-term decline.

ETHEREUM

Article By RoboForex.com

Attention!
Forecasts presented in this section only reflect the author’s private opinion and should not be considered as guidance for trading. RoboForex LP bears no responsibility for trading results based on trading recommendations described in these analytical reviews.

Trump escalates trade war and USDJPY rejects 109.00

By Admiral Markets

Source: Economic Events 02 August 2019 – Admiral Markets’ Forex Calendar

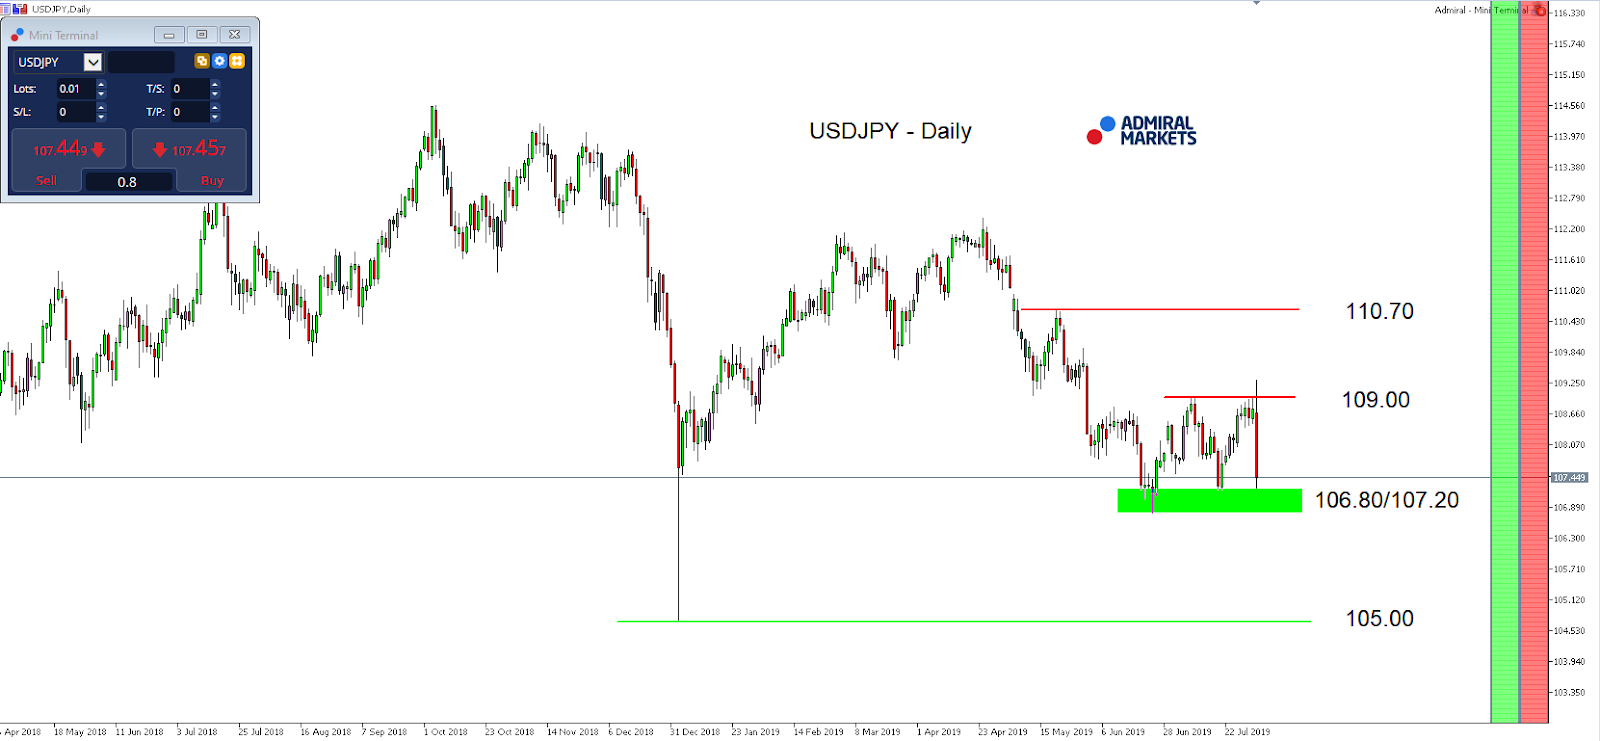
After the FED rate decision on Wednesday, the USDJPY took a short try to recapture 109.00.

After FED chairman Jay Powell characterised the 0.25% expected rate cut as a mid-cycle adjustment and signalled that markets shouldn’t expect a series of rate cuts now, markets started to price out three further rate cuts by December.

As a result, the USDJPY went back above 109.00, but was pushed significantly lower in the afternoon after disappointing ISM Manufacturing data. Trump then gave the currency pair the kiss of death by announcing 10% new tariffs on Chinese goods from September.

The most likely reason for Trump doing this: the FED rate cut can be considered as an anticipation of a global economic downturn. A downturn which could be triggered by a further trade war escalation between the US and China. And after Trump tweeted his disappointment about the FED rate decision on Wednesday, the new tariff announcement is intended to give Trump what he wants to get from FED: rate cuts, cheap money and fuel for further all time highs in US Equities – no matter what.

That said, into the weekly close the region round 106.80 comes into our focus in USDJPY, and a break lower activates the region around the current yearly lows around 105.00, while only sustainably recapturing 109.00 would brighten the technical picture.

Source: Admiral Markets MT5 with MT5SE Add-on USDJPY Daily chart (between 26 April 2018 to 02 August 2019). Accessed: 01 August 2019 at 10:00 PM GMT

Please note: Past performance is not a reliable indicator of future results, or future performance.

In 2014, the value of USDJPY increased by 13.7%, in 2015, it increased by 0.5%, in 2016 it fell by 2.8%, in 2017 it fell by 3.6%, in 2018 it fell by 2.7%, meaning that after five years, it was up by 4.1%.

Trade Forex & CFDs with Admiral Markets

Professional trading has never been more accessible than right now! Admiral Markets offers professional traders the ability to trade on the Forex market directly and via CFDs with 80+ currencies, including Forex majors, Forex minors, exotic pairs and more! Open your live trading account today by clicking the banner below!

Trade Forex

Disclaimer: The given data provides additional information regarding all analysis, estimates, prognosis, forecasts or other similar assessments or information (hereinafter “Analysis”) published on the website of Admiral Markets. Before making any investment decisions please pay close attention to the following:

  1. This is a marketing communication. The analysis is published for informative purposes only and are in no way to be construed as investment advice or recommendation. It has not been prepared in accordance with legal requirements designed to promote the independence of investment research, and that it is not subject to any prohibition on dealing ahead of the dissemination of investment research.
  2. Any investment decision is made by each client alone whereas Admiral Markets shall not be responsible for any loss or damage arising from any such decision, whether or not based on the Analysis.
  3. Each of the Analysis is prepared by an independent analyst (Jens Klatt, Professional Trader and Analyst, hereinafter “Author”) based on the Author’s personal estimations.
  4. To ensure that the interests of the clients would be protected and objectivity of the Analysis would not be damaged Admiral Markets has established relevant internal procedures for prevention and management of conflicts of interest.
  5. Whilst every reasonable effort is taken to ensure that all sources of the Analysis are reliable and that all information is presented, as much as possible, in an understandable, timely, precise and complete manner, Admiral Markets does not guarantee the accuracy or completeness of any information contained within the Analysis. The presented figures refer that refer to any past performance is not a reliable indicator of future results.
  6. The contents of the Analysis should not be construed as an express or implied promise, guarantee or implication by Admiral Markets that the client shall profit from the strategies therein or that losses in connection therewith may or shall be limited.
  7. Any kind of previous or modeled performance of financial instruments indicated within the Publication should not be construed as an express or implied promise, guarantee or implication by Admiral Markets for any future performance. The value of the financial instrument may both increase and decrease and the preservation of the asset value is not guaranteed.
  8. The projections included in the Analysis may be subject to additional fees, taxes or other charges, depending on the subject of the Publication. The price list applicable to the services provided by Admiral Markets is publicly available from the website of Admiral Markets.
  9. Leveraged products (including contracts for difference) are speculative in nature and may result in losses or profit. Before you start trading, you should make sure that you understand all the risks.

By Admiral Markets

The Analytical Overview of the Main Currency Pairs on 2019.08.02

by JustForex

The EUR/USD currency pair

Technical indicators of the currency pair:
  • Prev Open: 1.10757
  • Open: 1.10804
  • % chg. over the last day: +0.03
  • Day’s range: 1.10697– 1.10965
  • 52 wk range: 1.1034 – 1.1817

The EUR/USD currency pair stabilized after a long fall. At the moment, the trading instrument is consolidating in the range of 1.10600-1.10950. In the near future, a technical correction is highly possible. Participants in financial markets took a wait and see attitude before the publication of the US labor market report for July. These statistics can have a significant impact on the further rate of adjustment of the monetary policy of the Fed. We recommend that you pay attention to the difference between the actual and forecast values of the indicators. Positions need to be opened from key support and resistance levels.

At 15:30 (GMT+3:00), the investors will evaluate labor statistics from the United States for July.

EUR/USD

Indicators of accurate signals do not give: the price crossed 50 MA.

The MACD histogram is near the 0 mark.

The Stochastic Oscillator is in the neutral zone, the %K line is above the %D line, which indicates the correction of the EUR/USD currency pair.

Trading recommendations
  • Support levels: 1.10600, 1.10250, 1.10000
  • Resistance levels: 1.10950, 1.11200, 1.11600

If the price fixes above 1.10950, expect further correction toward 1.11400-1.11600.

Alternatively, the price can descend toward 1.10250-1.10000.

The GBP/USD currency pair

Technical indicators of the currency pair:
  • Prev Open: 1.21512
  • Open: 1.21199
  • % chg. over the last day: -0.29
  • Day’s range: 1.20903 – 1.21447
  • 52 wk range: 1.2080 – 1.3385

Yesterday, the Bank of England, as expected, kept its key interest rate unchanged at 0.75%. The regulator is concerned about the hard Brexit scenario. The central bank also worsened the forecast for UK GDP growth for 2019-2020. At the moment, the GBP/USD currency pair is in lateral movement. The trading tool tests the key support and resistance levels: 1.20800 and 1.21600, respectively. Investors are expecting a report on the US labor market. We recommend opening positions from key levels.

At 11:30 (GMT + 3: 00), the index of business activity in the UK construction sector will be published.

GBP/USD

The price fixed below 50 MA and 100 MA, which signals the strength of sellers.

The MACD histogram is in the negative zone and below the signal line, which gives a strong signal to sell GBP/USD.

The Stochastic Oscillator is in the neutral zone, the %K line crossed the %D line. There are no signals at the moment.

Trading recommendations
  • Support levels: 1.20800, 1.20200
  • Resistance levels: 1.21600, 1.22500, 1.23000

If the price consolidates below 1.20800, expect a further drop toward 1.20500-1.20200.

Alternatively, the price could recover toward 1.22000-1.22300.

The USD/CAD currency pair

Technical indicators of the currency pair:
  • Prev Open: 1.31891
  • Open: 1.32122
  • % chg. over the last day: +0.15
  • Day’s range: 1.32050 – 1.32247
  • 52 wk range: 1.2727 – 1.3664

An ambiguous technical picture has developed on the USD/CAD currency pair. CAD is trading in a flat. At the moment, the following key support and resistance levels can be distinguished: 1.32000 and 1.32400, respectively. The collapse of oil prices puts pressure on the Canadian dollar. Trading instrument has the potential for further growth. We recommend that you pay attention to the report on the US labor market. Positions must be opened from key levels.

The Economic News Feed for 02.08.2019:

  • – Trading balance (CAD) – 15:30 (GMT+3:00);
USD/CAD

Indicators indicate the strength of buyers: the price has fixed above 50 MA and 100 MA.

The MACD histogram is in the positive zone, but below the signal line, which gives a weak signal to buy USD/CAD.

The Stochastic Oscillator is in the neutral zone, the %K line crossed the %D line. There are no signals at the moment.

Trading recommendations
  • Support levels: 1.32000, 1.31800, 1.31500
  • Resistance levels: 1.32400, 1.32800, 1.33000

If the price consolidates above 1.32400, expect growth toward 1.32800-1.33000.

Alternatively, the price could drop toward 1.31700-1.31500.

The USD/JPY currency pair

Technical indicators of the currency pair:
  • Prev Open: 108.747
  • Open: 107.334
  • % chg. over the last day: -1.21
  • Day’s range: 106.850 – 107.567
  • 52 wk range: 104.97 – 114.56

USD/JPY is characterized by aggressive sales. The trading tool has updated the extremes. The demand for safe assets grew after Donald Trump announced his intentions to introduce new 10% fees on the imported wares from China. Right now the quotes are consolidating around 106.850-107.200. Focus on the US labour market report and open positions from the key levels.

The Economic News Feed for 02.08.2019 is calm.

USD/JPY

Indicators signal the strength of sellers: the price has fixed below 50 MA and 100 MA.

The MACD histogram is in the negative zone, which also indicates a bearish sentiment.

The Stochastic Oscillator is in the neutral zone, the %K line is above the %D line, which indicates a possible correction of USD/JPY quotes.

Trading recommendations
  • Support levels: 106.850, 106.500
  • Resistance levels: 107.200, 107.500, 107.800

If the price consolidates below 106.850, expect a further drop toward 106.500-106.200.

Alternatively, the price could correct toward 107.500-107.800.

by JustForex

Trump’s Tariff Tweet Sends Markets Lower

By Orbex

The equity markets were on a volatile ride on Thursday. A day after equities fell following the Fed rate cut, the markets recovered mid-day. This came following a weak patch of economic reports from the US. Markets rallied on hopes that the Fed will reassess the economic conditions and follow through with another rate cut. However, President Trump announced fresh 10% tariffs on China. This came in the midst of US and China trade talks. The announcement pushed equity markets lower while safe haven assets gained.

EURUSD Recovers off a Two-Year Low

The common currency initially fell to a fresh two-year low on the Fed announcement. But the currency pair managed to recover, posting some modest gains on the day. The rebound was helped by the US ISM manufacturing PMI which fell to 51.2, while construction spending was down 1.3% on the month.

Can the EURUSD Maintain the Upside?

The EURUSD currency pair’s rebound saw prices retesting the trend line from below. This potentially indicates a dynamic resistance area. If the currency pair fails to break out above this level, we anticipate price to retreat. For the moment, EURUSD is likely to remain within Wednesday’s lows.

EURUSD

WTI Crude Oil Drops Sharply

Crude oil prices fell over 5.50% on Thursday. The declines came late in the evening amid a mix of various factors. Earlier in the week, the EIA reported a drawdown in the stockpiles. This was further to the OPEC report about oil production slowing. However, oil prices ignored the fundamentals. The USD strength, along with the trade wars weighed on the commodity.

Crude Oil is Testing the Support

The decline in crude oil prices has sent the commodity down to the initial support level of 54.42. This marks the retest of the lower support. Currently, oil prices are attempting to post a rebound. But we expect price to settle back into the range between 57.50 and 54.40 region in the short term. A break down below 54.40 will trigger sharper declines to 50.00.

WTI

Gold Rebounds as Uncertainty Rises

The precious metal managed to post strong gains on Thursday. The gains came following the announcement of the new tariffs from the Washington administration. China could possibly retaliate once again with its own tariffs on US goods. Gold rallied to highs of 1449 before reversing the gains promptly.

XAUUSD Likely to Consolidate Again

The rebound in gold prices sent the precious metal to test previous highs from mid-June. However, the reversal off the highs has pushed gold back to the support area of 1431–1428 levels. We could expect to see prices holding on to this support in the near term. But a break down below the support will accelerate the declines. The previous support of 1404 remains the key target to the downside.

GOLD

By Orbex


Metals React To Fed Shockwaves – Ready For Next Move

By TheTechnicalTraders.com

On July 31, 2019, the US Federal Reserve decreased the Federal Funds Rate (FFR) by 25 basis points.  We believe the US Fed was pushed to take this action for three reasons that are directly related to the fear and greed that is abundant in the global markets.

Reason #1 Fed Had To Cut Rates

First, the US Fed is very concerned that the US housing market has stagnated and weakened over the past 16+ months.  The Fed has pushed the FFR towards our modeling system’s upper boundary (2.0 to 2.25) many months ago and this has pushed the housing market over a supply/demand precipice that may already be too far gone for a substantial recovery.  The US Fed, attempting to prevent another housing market collapse, must attempt to ease lending in an attempt to spark new real estate activity.

Reason #2 Fed Had To Cut Rates

Second, the US Fed must attempt to ease the foreign market US Dollar carry trade liabilities and attempt to allow more US Dollar opportunity in the foreign economy.  Over the past 2 to 3+ years, the supply of US Dollars within the foreign markets has diminished considerably while demand has increased.  Because of this, a US Dollar shortage currently exists in much of the global economy.  The US Fed is attempting to allow more US Dollar supply by lowering the FFR.

Reason #3 Fed Had To Cut Rates

Lastly, the US Fed, attempting to accommodate a more adaptable rates policy in order to more adequately facilitate the global economic turmoil that is persistent throughout the world.  Even though the US economy is still very strong and showing only mild signs of weakness currently, the US Fed felt the need to become more accommodating to allow more flexibility for global central banks to navigate through the current trade and geopolitical issues.

Dollar Hits Resistance And Should Reverse Down

Metals reacted by moving lower as the US Dollar rallied after the Fed announcement.  The US Dollar is currently near the upper price channel that we believe will prompt a weaker US Dollar over the next few weeks and will likely prompt a move lower over the next few weeks – allowing metals the ability to skyrocket higher over this same span of time.

Gold Set To Rock Higher

Gold is reacting to the US Dollar/Fed news by rotating within the black line and magenta arc levels that we highlighted weeks ago.  These Fibonacci Price Amplitude Arcs highlight key price levels that are acting as resistance for Gold right now.  Once price breaks these levels, Gold will skyrocket above $1550 and likely target $1650 or higher.

Silver Ready To Rally

As we’ve highlighted several times, Silver is likely the best trading opportunity set up on the planet right now.  We’ve highlighted where we are currently (“We Are Here”) and where we believe the price will move to in the future on this chart.  Using our Fibonacci Price Amplitude Arc levels and Fibonacci price ranges, we can “guess” where price may target in the future and where peaks and valleys may form.  We believe silver is setting up for a move to levels above $21~$22 right now and will begin this move higher within the next 2 to 5 weeks.

Even though the US Fed is attempt to act as a savior for the global central banks and attempting to easy US monetary policy while the global markets attempt to address their political and economic issues, we believe the US economy is uniquely strong in relation to other global economies and we believe the fear/greed factors will continue to increase over the next 15+ months or longer.

Gold and Silver are setting up to become some of the best trades we’ve seen in a very long time for us, technical traders.  We believe Silver could rally well above $30 over a very short period of time.  Don’t worry about the rotation in the metals markets as a reaction to the US Fed.  The real news is that the US Dollar has reached the upper price channel limit which should prompt a bigger upside move in the US metals.

CRUCIAL WARNING SIGNS ABOUT GOLD, SILVER, MINERS, AND S&P 500

In early June I posted a detailed video explaining in showing the bottoming formation and gold and where to spot the breakout level, I also talked about crude oil reaching it upside target after a double bottom, and I called short term top in the SP 500 index. This was one of my premarket videos for members it gives you a good taste of what you can expect each and every morning before the Opening Bell. Watch Video Here.

I then posted a detailed report talking about where the next bull and bear markets are and how to identify them. This report focused mainly on the SP 500 index and the gold miners index. My charts compared the 2008 market top and bear market along with the 2019 market prices today. See Comparison Charts Here.

On June 26th I posted that silver was likely to pause for a week or two before it took another run up on June 26. This played out perfectly as well and silver is now head up to our first key price target of $17. See Silver Price Cycle and Analysis.

More recently on July 16th, I warned that the next financial crisis (bear market) was scary close, possibly just a couple weeks away. The charts I posted will make you really start to worry. See Scary Bear Market Setup Charts.

CONCLUDING THOUGHTS:

In short, you should be starting to get a feel of where each commodity and asset class is headed for the next 8+ months. The next step is knowing when and what to buy and sell as these turning points take place, and this is the hard part. If you want someone to guide you through the next 12-24 months complete with detailed market analysis and trade alerts (entry, targets and exit price levels) join my ETF Trading Newsletter.

Be prepared for these incredible price swings before they happen and learn how you can identify and trade these fantastic trading opportunities in 2019, 2020, and beyond with our  Wealth Building & Global Financial Reset Newsletter.  You won’t want to miss this big move, folks.  As you can see from our research, everything has been setting up for this move for many months.

Join me with a 1 or 2-year subscription to lock in the lowest rate possible and ride my coattails as I navigate these financial market and build wealth while others lose nearly everything they own during the next financial crisis.

As a technical analysis and trader since 1997, I have been through a few bull/bear market cycles. I believe I have a good pulse on the market and timing key turning points for both short-term swing trading and long-term investment capital. The opportunities starting to present themselves will be life-changing if handled properly.

FREE GOLD OR SILVER WITH MEMBERSHIP!

Kill two birds with one stone and subscribe for two years to get your FREE PRECIOUS METAL and get enough trades to profit through the next metals bull market and financial crisis!

Chris Vermeulen – TheTechnicalTraders.com
 

The US Dollar Is in the Red After the Statements by Donald Trump. US Labor Market Data Is Expected

by JustForex

The US dollar is declining against the basket of major currencies. The US President, Donald Trump, violated a truce with China and announced the introduction of 10% tariffs on the remaining $300 billion of Chinese imports starting September 1. Trump emphasized that the new tariffs would include goods that had not yet been affected by tariffs. Also, according to the US President, 25% tariffs on $250 billion worth of Chinese goods are still in effect. As Trump said, in the future, tariffs could be raised even above 25%, depending on the progress of negotiations with Chinese President Xi Jinping. The decision by the US President has shocked financial markets. The US dollar index (#DX) closed in the negative zone (-0.22%). At the moment, financial market participants expect labor statistics from the US for July. We recommend paying attention to the difference between actual and forecasted values of the indicators.

China met the US decision with hostility. Chinese Foreign Minister, Wang Yi, believes that such a decision by Donald Trump regarding Chinese goods will become an obstacle in overcoming trade frictions between the two countries. As a result, the Chinese yuan has reached its lows since November 2018.

The British pound continues to decline. Yesterday, the Bank of England decided on the interest rate and left it unchanged at 0.75%, as experts expected. Optimistic data from the UK were also published yesterday. Thus, UK manufacturing PMI counted to 48.0 in July and was better than the expected value of 47.7. However, the British pound is under pressure due to the uncertainty concerning Brexit. Oncoming Brexit is increasingly putting pressure on the country’s economy.

The “black gold” prices are recovering after the collapse the day before. Currently, futures for the WTI crude oil are testing the $54.80 mark per barrel.

Market Indicators

Yesterday, there were aggressive sales in the US stock markets: #SPY (-0.87%), #DIA (-1.03%), #QQQ (-0.50%).

The 10-year US government bonds yield has updated lows for the first time in 2.5 years. At the moment, the indicator is at the level of 1.83-1.84%.

The news feed for 2019.08.02:

– UK construction PMI at 11:30 (GMT+3:00);
– US labor market data at 15:30 (GMT+3:00).

by JustForex

Markets Rocked By New Trade War Tariffs

By Orbex

Markets Wait For NFPs

It’s been an interesting week for the USD which rallied strongly over the week, only to concede a large portion of its gains later in the week. USD rallied initially as the Fed cut rates by only the expected .25% and downplayed the chances of further easing. However, later in the week USD collapsed as Trump took markets by surprise. The president announced a fresh set of tariffs on Chinese goods. USD index trades 98.01 last with price reversing lower ahead of the NFP and unemployment rate releases later today.

Euro Boosted By USD Sell-Off

EURUSD has been higher again today also. Along with benefiting from a weaker USD, EUR has also been boosted today by a surprisingly strong set of eurozone retail sales figures. These printed 2.6% in June, vs 1.3% expected. EURUSD has rallied firmly off the a.1027 base to trade 1.1098 last. Currently, the currency is sitting just ahead of a.1130 resistance.

GBP Muted Following BOE

GBPUSD remains subdued today with price retaining a heavy tone following the BOE meeting yesterday. While the BOE kept rates on hold it slashed its growth forecasts. They further sounded much more alarmed over the prospect of a no-deal Brexit. They said it is looking more likely than ever now and could send the UK into recession. GBPUSD trades 1.2120 last, hovering around the 1.2119 level still.

Risk Markets Rocked on Trade War News

Risk assets have had a heavily bearish week, suffering the double whammy of a less-dovish-than-expected FOMC and an unexpected set of new US tariffs. SPX500 has been knocked sharply lower this week breaking down below the 2970.95 level to trade 2940.43 last. The prospect of a further escalation in the trade war between the US and China is a major concern for investors. This is keeping equities under pressure on Friday.

Safe Havens Rally

Safe havens have had a strong reversal in fortune this week. Following initial losses in reaction to USD strength, both gold and JPY have rallied strongly against USD into the end of the week. USDJPY has collapsed lower from highs above 109 to trade 106.90s last, only just above the 2019 low at 106.72. XAUUSD has been a little softer over the morning. Although, the metal ends the week back up near highs following a surge back up to test the 1449.75 level yesterday.

Crude Stabilises But Ends Week Lower

Oil price has stabilized today though have been knocked strongly lower over the week in reaction to a post-FOMC USD rally. Then there was the disappointing announcement of fresh trade tariffs on China.The moves will be frustrating for crude bulls given the ongoing drawdown in US crude stores which should be supporting price. Crude trades 55.12 last, having fought back above the broken 54.94 level today.

High Betas Wiped Out

USDCAD remains supported today as the moves lower in oil have offset the weakness in USD to send CAD trading lower against the dollar. USDCAD trades 1.3218 last, remaining above the 1.3207 support for now and keeping focus on further upside in the near term.

AUDUSD has continued its devastating decline this week with price having now sunken below the former 2019 lows at .6830. Currently the currency is trading its lowest level since 2009 at .6793. News of a fresh outbreak of tariffs in the US/China trade war has hit AUD hard. This increases the likelihood of further RBA rate cuts over the remainder of the year.

By Orbex


EURUSD: signs of a correction to 1.1140

By Alpari.com

Previous:

On Thursday the 1st of August, trading on the euro closed 10 pips up against the dollar. The bulls recovered their losses incurred earlier in the day and moved into positive territory during the US session. This ambitious recovery was facilitated by a retreat towards safe haven assets as well as a rise on the EURGBP cross. As the appetite for risk subsided, investors moved towards safer assets (gold, yen, and Swiss franc). Brent oil has dropped 7% to 60.01 USD. The euro, as a funding currency, rose by 70 pips as stocks fell.

On Thursday, the US president tweeted that from the 1st of September, the US would impose 10% tariffs on 300bn USD of Chinese goods. He ramped up pressure following renewed trade talks on Wednesday after a 3-month pause. It now seems that those talks have failed.

Day’s news (GMT+3):

  • 10:30 Switzerland: SVME PMI (Jul).
  • 11:30 UK: Markit construction PMI (Jul).
  • 12:00 Eurozone: PPI (Jun), retail sales (Jun).
  • 15:30 Canada: imports (Jun), exports (Jun).
  • 15:30 US: trade balance (Jun), nonfarm payrolls (Jul), unemployment rate (Jul), average hourly earnings (Jul), average weekly hours (Jul), participation rate (Jul).
  • 17:00 US: Michigan Consumer Sentiment Index (Jun), factory orders (Jun).
  • 20:00 US: Baker Hughes US oil rig count.

EURUSD H1Current situation:

The euro hit fresh lows as expected in yesterday’s European session, after which a correctional phase began. The drop came to an end at the 135th degree. The pair didn’t reach the target level, but I did say that we should be prepared for a reversal. The euro has rebounded to the balance line, where it will most likely remain until 15:30 (GMT+3). Trade talks between the US and China have collapsed. I don’t make predictions on payrolls day. Considering that a pin bar has formed on the daily timeframe, we should be prepared for the euro’s rise to continue to 1.1130 – 1.1145.

By Alpari.com

NFP Expected To Rise At A Slower Pace In July

By Orbex

The much-awaited monthly payrolls data will be coming out today. Forecasts point to payrolls rising at a slower pace this month. Economists polled expect that nonfarm payrolls will rise 160k in July.

This marks a slower pace of increase comparing to June’s headline print of 224k.

The US unemployment rate is however likely to fall to 3.6%, after rising to 3.7% in June.

The average earnings continue to remain stagnant, with estimates showing a 0.2% increase on the month in July.

For the past few months, average earnings have remained well-anchored near the 3% yearly increase.

With inflation already tame, wages will continue to outstrip consumer prices. This will put more spending money in the hands of households.

U.S. Nonfarm payrolls
US Nonfarm payrolls

Today’s payrolls report comes on the backdrop of a number of other big-ticket items. Earlier this week, the Federal Reserve lowered the fed funds rate by a quarter basis point.

The central bank remains in a wait and watch mode. Besides inflation, the unemployment rate will also be another key factor for the Fed to watch out for.

Unemployment over the past few months has been somewhat shaky, compared to the strong stretch witnessed previously. This falls in line with the general view that the US economy is indeed slowing.

ISM’s Manufacturing PMI Sinks Further

Meanwhile, the ISM’s manufacturing PMI data showed the manufacturing activity for July fell to 51.2. This was the weakest pace of growth in nearly three years. The index is still above the 50-level which indicates growth in the manufacturing sector.

Amid the current backdrop, the question remains on whether there will be much impact from today’s payrolls report. While the estimates for July are lower, there is also the prospect of a downward revision to June’s data.

The ISM’s data showed that the employment index registered a reading of 51.7, which down by 2.8 points from June’s 54.5. The data suggested that while employment growth was rising, the pace was much slower.

This potentially indicates that the payrolls report will be somewhat in line with the estimates if now lower comparing to the numbers from the month before.

On Wednesday, the ADP payrolls data showed that hiring in the private sector rose 156k in July. This was slightly above the consensus estimates of 150k. The data for July showed that the labor market was still strong.

However, there were inherent weaknesses in the economy that was hitting the growth in the labor market sector.

Will the Payrolls Report Have any Impact on the Fed?

With the Fed staying less dovish than expected, today’s payrolls report could potentially change that view. Unless there is a strong negative deviation from the estimates, the report could simply be brushed aside.

To the upside, even if there is a strong positive deviation, we do not expect to see this impacting the monetary policy. The Fed is likely to simply wait to assess more data.

But it is unlikely that the payrolls will be strong enough for the Fed to hold back from further rate cuts. Today’s payrolls report will be one of the many ahead of the September Fed meeting. This is when the rate-setting committee will take further action on monetary policy if required.

Given the fact that the central bank has responded to slowing growth indicators, the data would simply justify the rate cut at some point in the future.

The trend in payrolls has been somewhat weaker over the past months. This coincides with the late business cycle. Although the risks of a recession is still a possibility, the Fed’s move to lower rates could help push the downside risks further down along the road.

The central bank is also quite likely to remain on the sidelines and wait for more incoming data before deciding on the next course of action.

By Orbex


SP500 logs fourth straight loss after Trump announces new China tariffs

By IFCMarkets

Dollar weakens as manufacturing slows

US stock indexes relinquished early gains on Thursday after President Trump tweeted US will impose a 10% tariff on $300 billion of Chinese imports from September 1. The S&P 500 lost 0.9% to 2953.56. The Dow Jones industrial average fell 1.1% to 26583.42. Nasdaq composite index slid 0.8% to 8111.12. The dollar weakening resumed as manufacturing indexes of both ISM and Markit indicated manufacturing expansion slowed in July: the live dollar index data show the ICE US Dollar index, a measure of the dollar’s strength against a basket of six rival currencies, fell 0.2% to 98.38 and is lower currently. Stock index futures point to lower market openings today

CAC 40 leads European indexes advance

European stocks extended gains on Thursday on back of strong quarterly results. EUR/USD turned higher while GBP/USD accelerated its decline yesterday as the Bank of England (BOE) held interest rates steady at 0.75%. Both pairs move in previous session’s directions currently. The Stoxx Europe 600 index ended 0.4% higher. Germany’s DAX 30 gained 0.5% to 12253.15. France’s CAC 40 rose 0.7% while UK’s FTSE 100 slipped 0.03% to 7584.87 as BOE cut its growth forecast to 1.3% for 2019 and 2020, down from 1.5% and 1.6% respectively.

Hang Seng leads Asian indexes losses

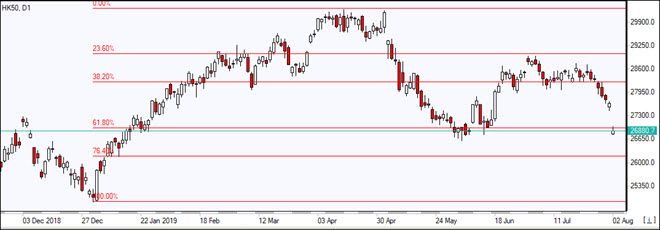
Asian stock indices are sharply lower today as President Trump tweeted about 10% tariffs to take effect September 1 on an additional $300 billion of Chinese imports after US negotiators briefed him of the recent trade meeting in Beijing. Nikkei fell 2.1% to 21087.16 as yen slowed its slide against the dollar. Chinese shares are tumbling as Chinese officials expressed their disagreement saying additional tariffs is not a constructive way to resolve economic and trade frictions: the Shanghai Composite Index is down 1.4% and Hong Kong’s Hang Seng Index is 2.4% lower. Australia’s All Ordinaries Index slid 0.3% as Australian dollar resumed its climb against the greenback.

HK50 drops gaps below Fibonacci 61.8 level    08/01/2019 Market Overview IFC Markets chart

Brent rising

Brent futures prices are recovering today. Prices sank yesterday: October Brent crude lost 7% to $60.50 a barrel on Thursday.

Market Analysis provided by IFCMarkets

Note:
This overview has an informative and tutorial character and is published for free. All the data, included in the overview, are received from public sources, recognized as more or less reliable. Moreover, there is no guarantee that the indicated information is full and precise. Overviews are not updated. The whole information in each overview, including opinion, indicators, charts and anything else, is provided only for familiarization purposes and is not financial advice or а recommendation. The whole text and its any part, as well as the charts cannot be considered as an offer to make a deal with any asset. IFC Markets and its employees under any circumstances are not liable for any action taken by someone else during or after reading the overview.