PBoC New Loans: AUD & NZD Implications

By Orbex

At the start of the week, commodity currencies got a bump. This came after the PBOC reduced reserve requirements for banks (RRR as it’s known). This highlights the importance of the Chinese credit situation in forex, and why traders ought to keep track of it.

Japan, New Zealand and Australia, in particular, are intimately related to their largest trade partner, though in different ways.

Chinese authorities have been taking a series of measures in an effort to offset the economic impact of the ongoing trade war with the US. Many of these are related to credit and loan capabilities. Therefore, they are directly related to how much Chinese businesses, consumers and individuals can buy or invest from other countries.

Chinese investors were the drivers of the real estate boom in Australia. And the collapse of it is what precipitated the decline in the economy and the change in outlook by the RBA.

What We Are Looking For

The forecast is for a substantial increase in the total number of new loans for Chinese enterprises and individuals. The consensus shows CNY2.2T new loans, compared to CNY1.5T in the prior month.

A result like this would be the highest amount since the Lunar New Year. Around that time, there is typically an unusually large amount of borrowing. However, this would be the largest amount of new borrowing in years, on a seasonally adjusted basis.

The normal range for this figure is between CNY1-2T. Projections above that could have a significant market effect. More borrowing in China often correlates with increased capital outflows to pay for exports and make foreign investments. The largest beneficiaries are the US, Australia and the euro area.

Much smaller in comparison to other countries, but bigger as a proportion, New Zealand receives a significant amount of capital investment from China.

On the flip side, a miss in expectations would likely contribute to weakness in currencies from countries who trade significantly with China. This primarily impacts  Australia and New Zealand. The yen would likely move in the other direction, as a safe haven play.

The End of Carry Trade?

Among the primary drivers of strength in the NZD and AUD has been their relatively high interest rates supported by their erstwhile conservative reserve banks.

Since the last recession, the bond yield spread (that is, the difference in cost to borrow money) between Australia and the two largest economies in the world has been around 150 basis points. With the RBA aggressively cutting rates, that spread could shrink if the Fed doesn’t follow through with a rate cut in September.

That would make the carry trade option increasingly less profitable. This means less interest in buying dollars of the Australian and New Zealand persuasion. While governments and banks might see this as a positive because it helps exporters, it would put medium-term pressure on the currencies.

The combination of weaker exports to China would imply a generally weak outlook for both the NZD and AUD in the near future.

It’s Not Just Interest Rates

What could push in the opposite direction are unconventional easing measures. These include the rumored QE plan from the ECB, and what was effectively an interest rate cut in China last month.

Increased liquidity in such a low interest rate environment would be searching for yields. And even with the rate cuts, commodity currencies are still the most attractive.

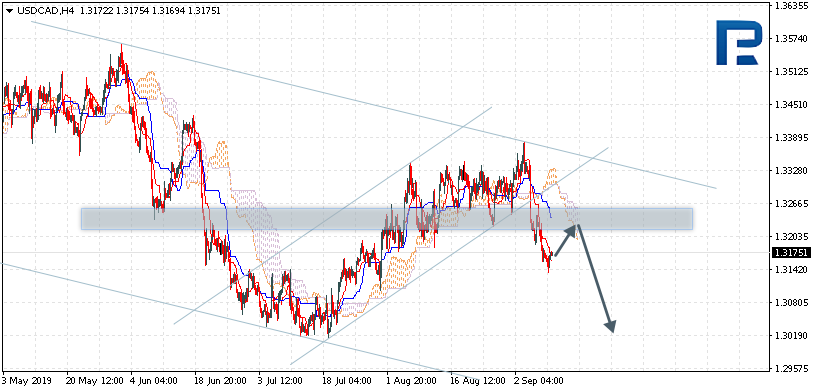
The exception there, however, is Canada. With not even a rumor of rate cuts and largely sidelined by the US-China impasse, Canada has remained strong. It’s bond yields are now just a quarter-point away from Australia And the next rate cut from the RBA could just push carry traders to look to the north for a better investment. That would further pressure the NZD and AUD but help the CAD.

By Orbex


COPPER Analysis: Improving Chinese economy prospect bullish for copper price

By IFCMarkets

Improving Chinese economy prospect bullish for copper price

China’s manufacturing sector resumed growth in August. Will the copper price advance continue?

Caixin and Markit reported China’s factory activity rebounded to a five-month high in August. Caixin China manufacturing purchasing managers’ index rose to 50.4 in August compared with 49.9 in July. Manufacturing activity resumed expanding: readings above 50.0 indicate sector expansion, and contraction below. Caixin had mentioned the uncertainty of US-China trade dispute as a downside risk. Last Thursday China’s commerce ministry stated Beijing and Washington had set a tentative date for “early October” meeting for resuming trade negotiations. Improving prospect of US-China trade dispute resolution raises Chinese economy’s growth rate estimate. And China’s central bank last Friday cut the amount of cash that banks must hold as reserves for the third time this year, releasing 900 billion yuan ($126.35 billion) in liquidity to stimulate the economy. Improving growth prospect and stimulus measures for China, world’s biggest consumer of copper, is bullish for copper.

COPPER testing MA(50) 09/10/2019 Technical Analysis IFC Markets chart

On the daily timeframe COPPER: D1 is retracing higher after hitting 29-month low in the beginning of September. It is testing the 50-day moving average MA(50), which is falling.

  • The Parabolic indicator has formed a buy signal.
  • The Donchian channel indicates no trend yet: it is flat.
  • The MACD indicator is below the signal line with the gap narrowing. This is a bullish signal.
  • The RSI oscillator has not reached the overbought zone and has formed a bullish divergence.

We believe the bullish momentum will continue after the price breaches above the upper Donchian boundary at 2.6467. This level can be used as an entry point for placing a pending order to buy. The stop loss can be placed below the lower fractal at 2.4804. After placing the pending order the stop loss is to be moved every day to the next fractal low, following Parabolic signals. Thus, we are changing the expected profit/loss ratio to the breakeven point. If the price meets the stop-loss level (2.4804) without reaching the order (2.6467) we recommend cancelling the order: the market sustains internal changes which were not taken into account.

Technical Analysis Summary

OrderBuy
Buy StopAbove 2.6467
Stop lossBelow 2.4804

Market Analysis provided by IFCMarkets

Thin Trading Takes Over

By Orbex

Today, trading activity is thin compared to Monday.

All of the FX major currencies seem reluctant to move in any direction with narrow and short-lived spikes making the best of the session so far.

Pound Lower on Poor Jobs Data

Despite Monday’s upbeat session, cable struggled to get past the multiweek high of 1.2380 registered only yesterday. Not only did bulls take a break but they also initiated a sizeable sell-off after receiving a rather disappointing jobs report.

That, however, marks a good setup as bulls rejected bears at the psychological $1.23. With that said, unemployment and wages in the UK grew. This means that the steep decline could only have been headline-based infused, rather than ending as a reversal.

EURUSD and USDJPY Unmoved

With the ECB meeting on Thursday, it is uncertain whether we will see Monday’s flows again before the crucial event. EURUSD had a good session yesterday. But, the rejection caused at the $1.1050 is likely to keep the currency pair in a tight range.

German trade data did support EURUSD on Monday. However, since the trade war remains unresolved, traders must stay cautious. At least until further clues on policy guidance come to light on Thursday!

The continuous recovery in risk appetite has led safe-haven flows to lower levels. This has caused the yen, as well as the Swiss Franc, of course, to move lower against the greenback.

USDJPY recorded a nice breakout move above 107 on Monday. But with the US calendar somewhat light until Friday, it will most likely be safe-haven activity affecting dollar-yen.

USDJPY does indeed look bullishly biased on the back of the PBOC’s decision last Friday to lower the reserve requirement ratio (RRR) for financial institutions by 50 basis points.

Commodity Pairs Bullishly Eco-Biased

Australian home loans and electronic card retail sales in New Zealand are keeping Aussie and Kiwi firm against the buck. Not only has risk appetite sent both pairs to fresh multiweek highs, but recent data also suggest that both economies are walking on a healthier path than before.

Although mixed in the first half of the session, Monday’s closing saw AUDUSD and NZDUSD adding another positive session onto their consecutive winning streak. It is only a matter of time before bulls continue adding more bets.

Commodities Also Lackluster

WTI is currently taking a breather from yesterday’s surge. This comes amid the Saudi Minister reshuffle and a reach of the psychological resistance at $58 per barrel. Crude oil prices could move higher as profit-taking hasn’t yet initiated. It could be the NY open that triggers a fresh breakout to new highs.

Gold also remains unchanged early on Tuesday, similarly to yen and the Swiss franc. However, XAUSUD was little unchanged on Monday as well. It didn’t follow the yen/franc rhetoric as investors seem to be more confident on the precious metal than they are on currency safe-havens. Gold is likely to put on a good fight around the $1500 per ounce as this remains the most active level for both sellers and buyers. At least for now.

Equities Slide but Dollar Mixed

The dollar slid yesterday and equities closed mixed. However, today, the two markets seem to have replaced one another. The DXY trades near its open price and SPX is weak, falling below 2970 from an open of 2980.

Lacking economic data and despite the PBOC’s decision, the dollar ended Monday with a Doji candlestick, albeit bearishly biased. With 98.20 holding strong we could see a short-term bullish pullback registering in one of the following sessions (if not today.) But that should be supported by either politics or economics.

The PBOC’s decision didn’t seem to have much of an effect on equities. So the current decline could be attributed to recent, minor trade talk development between the US and China.

By Orbex


EURUSD Analysis: Germany’s trade surplus increase bullish for EURUSD

By IFCMarkets

Germany’s trade surplus increase bullish for EURUSD

Germany’s trade surplus rose more than expected in July. Will the EURUSD start climbing?

EURUSD falling above MA(200)

The price chart on 1-hour timeframe shows EURUSD: H1 is still trading sideways. The price is above the 200-period moving average MA(200) which is declining. And the RSI is below 50 level and falling toward oversold zone. There is no trend yet formed, traders have to decide when it would be a best time to enter the market.

Market Analysis provided by IFCMarkets

ECB Measures To Be Less Dovish

By Orbex

The week started off on good footing for the euro on Monday, supported by economic developments as well as monetary policy expectations.

Dollar, on the other hand, kicked this week’s trading session off on a rather weak footing despite US consumer borrowing coming out better than expected.

ECB Expectations Less Dovish

Traders and investors alike might expect euro to remain somewhat unchanged ahead of the widely expected ECB monetary policy meeting on Thursday. However, EURUSD kickstarted the week with a fresh 3-day high at $1.1067.

Apparently, there are growing expectations that the ECB will be less dovish than anticipated last week. After all, Draghi won’t want to leave his position providing a pessimistic outlook.

Fundamentals identify three areas of focus for this week’s meeting:

– potential interest rate cuts and how deep into negative territory, if any
– the size of the easing package and its form (e.g reinitiating TLTRO II or bond-buying), if any, and
– cost of easing package/negative rates for banks and investors alike (called “tiering”), if any of course

German Trade Boosted Euro Flows

In Germany, Europe’s strongest economy, exports increased from the -0.1% expected to 0.7% actual. They increased 3.8% year-on-year to 115.5 billion euros. This brought the 2019 surplus to 131.1 billion euros.

When looking at the 2019 figures, however, the trade surplus is tighter compared to the corresponding 2017 period. The monthly export figures rose on the back of boosted sales outside the European Union.

A Weaker Dollar Supported EURUSD

The most recent performance on eurodollar suggests that market participants placed several dollar shorts as well, it wasn’t just euro flows affecting the eurodollar’s exchange rate. USD shorts were likely initiated amid last week’s bearish momentum following Friday’s disappointing NFPThey were also in defiance of upbeat US consumer data. The economic report is a weak indicator nevertheless and doesn’t normally cause much noise.

EURUSD Struggles At $1.1050

With a positive trading day already in the books on Monday, the euro is on a +1 against the dollar. However, adding today’s earlier attempt, this marks the fourth failed attempt to break above the $1.1050 psychological resistance.

EURUSD could receive another rejection here and turn lower to take out breakeven stops near the 78.6% Fibonacci retracement of the Jan ’17-Fen ’18 bullish impulse. This could validate the current structure, which suggests another last slide towards 1.0810 to complete wave 5 of the minute C Elliot wave triangle.

eurusd struggles

By Orbex


Ichimoku Cloud Analysis 10.09.2019 (AUDUSD, NZDUSD, USDCAD)

Article By RoboForex.com

AUDUSD, “Australian Dollar vs US Dollar”

AUDUSD is trading at 0.6853; the instrument is moving above Ichimoku Cloud, thus indicating an ascending tendency. The markets could indicate that the price may test the cloud’s upside border at 0.6810 and then resume moving upwards to reach 0.7015. Another signal to confirm further ascending movement is the price’s rebounding from the support level. However, the scenario that implies further growth may be canceled if the price breaks the cloud’s downside border and fixes below 0.6745. In this case, the pair may continue falling towards 0.6655.

AUDUSD
Risk Warning: the result of previous trading operations do not guarantee the same results in the future

NZDUSD, “New Zealand Dollar vs US Dollar”

NZDUSD is trading at 0.6426; the instrument is moving above Ichimoku Cloud, thus indicating an ascending tendency. The markets could indicate that the price may test the cloud’s upside border at 0.6380 and then resume moving upwards to reach 0.6575. Another signal to confirm further ascending movement is the price’s rebounding from the support level. However, the scenario that implies further growth may be canceled if the price breaks the cloud’s downside border and fixes below 0.6315. In this case, the pair may continue falling towards 0.6235. After breaking the descending channel’s upside border and fixing above 0.6475, the price may continue moving upwards.

NZDUSD
Risk Warning: the result of previous trading operations do not guarantee the same results in the future

USDCAD, “US Dollar vs Canadian Dollar”

USDCAD is trading at 1.3175; the instrument is moving below Ichimoku Cloud, thus indicating a descending tendency. The markets could indicate that the price may test the cloud’s downside border at 1.3205 and then resume moving downwards to reach 1.3020. Another signal to confirm further descending movement is the price’s rebounding from the resistance level. However, the scenario that implies further decline may be canceled if the price breaks the cloud’s upside border and fixes above 1.3285. In this case, the pair may continue growing towards 1.3355.

USDCAD
Risk Warning: the result of previous trading operations do not guarantee the same results in the future

Article By RoboForex.com

Attention!
Forecasts presented in this section only reflect the author’s private opinion and should not be considered as guidance for trading. RoboForex LP bears no responsibility for trading results based on trading recommendations described in these analytical reviews.

Effective Ways To Use The Moving Averages Indicator

By Orbex

The moving average indicator as we know it is one of the most widely used technical indicators in Forex trading. Primarily used for determining Forex market trends, the moving average indicator is also used in a number of other technical analysis applications.

The popularity of this MT4 indicator comes due to its simplicity. Because the mathematical calculations behind the moving average are so easy to understand, traders at all levels find it a very comfortable indicator to start Forex trading with.

When one talks about moving averages, perhaps one of the first things that come to mind is the moving average crossover strategy.

Yet, besides this and a few other applications of the moving averages in other strategies, this versatile indicator can be used in many other ways.

In this article, we will outline a few ways you could use the moving average.

An important thing to note is that the moving average is merely a reflection of the average price.

As a result, some FX traders might find that the moving average is lagging. This is indeed true. Moving averages show you the average price of the instrument over a period of time. Thus, they tend to reflect the trends in the past, rather than predict Forex market trends. Understanding this is crucial when it comes to getting one’s expectations right with this MT4 indicator.

Dynamic Support and Resistance Levels

The moving average indicator is a versatile indicator in identifying dynamic support and resistance levels. Of course, this is a bit subjective.

Typically, the 200 and 50-day moving averages are commonly used on the daily chart time frame. Because these indicators are so widely used, they tend to act as dynamic support and resistance levels.

Support and Resistance Levels
MA Support and Resistance

For example, the chart above shows an instrument on the daily timeframe. You can see how the indicator tends to act as support and resistance for the prices.

You could, of course, make use of a moving average of any other lookback period or on any timeframe of your choosing. However, the most commonly used moving averages are better at acting as dynamic support and resistance levels.

The Moving Average Slope

The slope of the moving average reflects the intensity or the momentum in the instrument. Thus, when you find that the moving average is sloping at a steep angle, you can deduce that the price is declining or rising rapidly.

Moving Average Slope

This can give FX traders information such as the momentum and can even lead you to identify the fundamental factors behind such a move. Forex traders tend to mistake the slope of the moving average as something that is currently happening.

However, bear in mind that given the lagging nature of this indicator, it reflects only the past price action. Still, the information one can get out of this can be used in different ways to find an edge in the Forex market.

Reversion to the Mean

Mean reversion in finance is a tendency of an instrument’s value that changes over time.

In the long term, the price tends to gravitate to its long-term average value. The concept of mean reversion is not predictive in nature. Furthermore, mean reversion can behave differently depending on the asset class as well.

200-day MA Mean Reversion

Some FX traders tend to disregard mean reversion because it means that the forex markets do not follow a random walk, thus leading to an inefficient market. Still, depending on how you look at it, prices tend to correct (after extreme moves) to the long-term mean.

A 200-day moving average is a great example of mean reversion. Prices that tend to move significantly away from the long-term mean tend to revert to the mean price over time.

While this isn’t the basis for building a Forex trading strategy, one could still apply the concepts in different ways. For example, FX traders could avoid buying near extreme highs or lows.

In conclusion, the moving average indicator finds its uses not just in Forex trading strategies but also helps in building advanced math based trading systems as well.

By Orbex


Business conditions and confidence decreased severely in Australia

By ForexNewsNow

According to a new study from the National Australian Bank, the business confidence and conditions have drastically fallen in Australian is Q2 of 2019, with the remnants of the issues spilling well over in Q3.

On a more detailed level, it needs to be said that the Business Confidence Index dropped from 4 to 1 in August, while the Business Condition index dropped from 3 to 1. Naturally, this is an astounding loss in terms of future capabilities of remaining profitable, or in the worst-case scenario, surviving a major global recession.

The reasons can also be associated with the slight downfall of the AUD against the USD in 2019.

To be more exact, AUD started at $0.69 at the start of the year, after which it managed to reach a peak of $0.72 in the first quarter, but failed to maintain balance and bounced right back down to $0.69 at the moment of writing this article.

Although it may seem like an insignificant decrease, let’s not forget that AUD is one of the major currencies of the world, therefore even a single cent lost to volatility is a great hit to the economy.

The NAB further states that in terms of conditions, confidence and overall profitability the mining industry seems to be the most stable one out of all that Australia can muster.

However, recent studies also show that Australia’s already large gaming industry is showing no signs of stopping its growth pattern and continues to expand well beyond its borders.

A representative from Playamo AU, a local gaming operator mentioned:

“It was obvious that Q2 of 2019 was little less than a disaster. The revenue was down, the currency was depreciating and the overall operations were at risk. But this was just by looking at the paper and not doing too much research.

Once we saw the decline in revenue, it almost felt like a 50% hit to overall performance, but luckily, we have offshore operations as well.

Thanks to those offshore operations, where we are usually paid in USD or EUR, we managed to compensate for the relatively small losses or no gains in the Australian market.

However, we still believe that the gaming market here has much more potential, as long as the government doesn’t interfere too much”.

What could be derived from these facts?

One of the most important takeaways from the explanation of the Playamo representative could be the additional hostility the Australian government could start seeing towards the gaming industry.

Almost every government’s ideal economic plan is a diversified economy, where consumer spending is really divided into both private and state sectors. Having so many funds concentrated in just one industry, to a point where companies had only slight issues with revenue is already an alarming revelation.

Naturally, the funds spent on these platforms are going to return to the government via corporate tax, but in a sense, they will be sacrificing almost all the other retail sectors.

It is quite possible that this study by NAB, will lead to new guidelines and corrections in the country’s fiscal and monetary policies, to somehow get the economy back on track.

Although it is always best to let the economy sort itself out, a slight push or direction can do wonders for the whole process.

By ForexNewsNow


Japanese Candlesticks Analysis 10.09.2019 (EURUSD, USDJPY)

Article By RoboForex.com

EURUSD, “Euro vs. US Dollar”

As we can see in the H4 chart, after completing Hammer pattern and rebounding from the descending channel’s downside border, EURUSD has formed several reversal patterns at the horizontal resistance level, including Shooting Star. Later, the price may finish the correction and fall to reach 1.1093, thus continuing forming the descending channel. However, one shouldn’t exclude a possibility that the price may continue growing towards 1.1100.

EURUSD
Risk Warning: the result of previous trading operations do not guarantee the same results in the future

USDJPY, “US Dollar vs. Japanese Yen”

As we can see in the H4 chart, the pair is moving downwards. USDJPY has formed Shooting Star reversal pattern close to the channel’s upside border. Right now, it is trying to reverse. Judging by the previous movements, it may be assumed that after finishing the correction the price may continue growing to reach 107.77 and then rebound towards 106.12 to continue forming the descending channel.

USDJPY

Article By RoboForex.com

Attention!
Forecasts presented in this section only reflect the author’s private opinion and should not be considered as guidance for trading. RoboForex LP bears no responsibility for trading results based on trading recommendations described in these analytical reviews.

Investors need to avoid complacency, despite improving market sentiment

By George Prior

Global financial markets are feeling more confident, but investors must avoid complacency, warns a leading analyst at one of the world’s largest independent financial advisory organisations.

The warning from Tom Elliott, deVere Group’s International Investment Strategist, comes following calming economic data and the announcement of further U.S. – China trade talks next month.

Mr Elliott comments: “There is some reassuring economic data from the U.S., namely the August non-manufacturing ISM index of business confidence.

“Investors are conscious that the current U.S. economic cycle is the longest on record and many are looking for issues that might induce a recession. Some analysts point to falls in U.S. second quarter corporate earnings and capital spending as a potential trigger, others place greater emphasis on the risk to the U.S and the global economy of the U.S – China trade dispute.”

Furthermore, Mr Elliott says the pound’s volatility is set to continue as the risk of a no-deal Brexit has diminished.

He states: “Prime Minister Boris Johnson’s authority has weakened, and it appears likely he will be forced to seek an extension to Article 50 beyond 31st October.

“The currency’s recent volatility, with several days of swings against the dollar of over 1 per cent in late August and early September, looks set to persist.

deVere’s International Investment Strategist goes on to say: “While some ultra-bearish analysts suggest the pound could fall to $1.00 on a no-deal Brexit, others suggest a floor of around $1.09.

“But we might also see a strong rally in sterling if the anti-Brexit Conservative rebels and opposition parties continue with their recent successes in confounding Johnson’s Brexit plan. A return to levels around $1.50 may be possible if the UK eventually abandons Brexit, given the likely surge of investment and pent-up spending that would boost economic growth.”

Mr Elliott adds: “Boris Johnson’s attempt to stop Parliament passing a law preventing a no-deal Brexit, through proroguing Parliament, has failed. So too has his attempt to have a general election this side of 31st October, on the binary choice of ‘support my no-deal Brexit or have Jeremy Corbyn for Prime Minister’.

“Meanwhile his attempts to strike a new deal are regarded by many as a sleight of hand, with no new proposals made to solve the Irish backstop issue that will meet the EU’s minimum requirements.

“Indeed, the government’s chief negotiator in Brussels has reportedly demanded a revision not only to the Irish backstop provision that Theresa May agreed to, but is also demanding the right for the UK to have its own regulatory standards for goods – which would make a future trade deal with the U.S. easier to do, but make one with the EU harder.”

deVere’s Investment Strategist continues: “The PM looks set to lead the Conservatives into a general election after 31st October, having failed to achieve Brexit, nothing to show in terms of negotiations with the EU, and deep hostility towards him from a large part of his party after having removed the party whip from 21 Conservative lawmakers last week who voted to avoid a no-deal Brexit.

Mr Elliott concludes: “Geopolitical issues drive investor returns.  Investors can and should protect themselves from market uncertainty through exposure to a broad range of assets, currencies and geographic regions. The mantra of an investor should always be ‘diversification’ – this is especially pertinent in today’s uncertain market conditions.”

About:

deVere Group is one of the world’s largest independent advisors of specialist global financial solutions to international, local mass affluent, and high-net-worth clients.  It has a network of more than 70 offices across the world, over 80,000 clients and $12bn under advisement