China exempted US pork from additional tariffs and stated support for more imports from US. Will the LHOG continue gaining?
China’s pig farming has been decimated by African swine fever outbreak, studies estimate China’s pig supply may have fallen by about 40% from a year ago. Pork is the most consumed meat in China, Beijing announced last week it will not increase tariffs on certain US agricultural products, including pork. And stated it supported buying soybeans, pork and other agricultural products in accordance with market principles and WTO rules. Lower pig supply and higher Chinese demand is bullish for LHOG.
On the daily timeframe the LHOG: D1 is rising toward the 200-day moving average MA(200).
The Parabolic indicator gives a buy signal.
> The Donchian channel indicates uptrend: it is widening up.
The MACD indicator gives a bullish signal: it is below the signal line and the gap is narrowing.
We believe the bullish momentum will continue after the price breaches above the upper boundary of Donchian channel at 68.257. This level can be used as an entry point for placing a pending order to buy. The stop loss can be placed below the lower Donchian boundary at 59.151. After placing the order, the stop loss is to be moved every day to the next fractal low, following Parabolic signals. Thus, we are changing the probable profit/loss ratio to the breakeven point. If the price meets the stop loss level (59.151) without reaching the order (68.257), we recommend cancelling the order: the market has undergone internal changes which were not taken into account.
The latest economic data this week has once again illuminated the extent of the damage caused by the ongoing trade war between the US and China. Industrial production in China hit a fresh 17 year low over August growing at just 4.4%, down from the prior month’s 4.8% reading. Industrial production is now at its lowest level since February 2002.
The data is particularly worrying given its timing. The reading reflected a move lower in industrial production ahead of the implementation of fresh US trade tariffs which took effect (partially) from September 1st.
Fixed Asset Investment Weakness
The break-down of the data highlights the severity of the downturn in China. Fixed asset investment which includes physical assets such as real estate and infrastructure, grew at just 5.5% in August. This was down from the prior month’s 5.7% reading and was also below analyst expectations.
The slowdown in industrial production was evident across both manufacturing and mining. Manufacturing rose by just 4.3% last month. This was down from 4.4% in July and further still from the 5.2% reading in June. Meanwhile, mining output rose at just 3.7%, down starkly from the prior month’s 6.6% reading.
Exports Down
Furthermore, exports were down over the month, falling 1% in August, while imports declined also by 5.6%. Imports have now fallen in each month of the year besides April, providing a clear commentary on the impact of the trade war. The data also showed that the manufacturing purchasing manager’s index remained in negative territory over the month as expectations of new export orders moved lower yet again.
Retail Sales Fall
Alongside the weakness in industrial production, China’s National Bureau of Statistics also released Retail Sales data. This grew at just 7.5% over the month. This reading marks a decline from the prior month’s 7.6% reading. It further came in below analysts forecasts of a 7.9% print.
Both Sides Making Concessions
The data makes for bleak reading on the Chinese economy which has been rocked by the nearly two-year-long trade war. There is some light at the end of the tunnel, however. Trump recently announced that the planned 5% increase in tariffs on $250bilion of Chinese goods will be postponed from October 1st to October 15th. This comes amidst growing speculation that the two nations might strike a partial deal at the upcoming trade talks this month. Indeed, China itself has also made some concessions, announcing last week that it will exempt some US products (including some agricultural products) from tariffs.
Cautious Optimism
These positive signs have been met with cautious optimism by traders. The relationship between the two nations has been notoriously volatile and similar periods of progress have resulted in collapse. Until such an interim deal is made, we are unlikely to see much of a price action driver. This is especially true given the backdrop of heightened concerns around tensions in the Middle East.
Technical Perspective
A retest of the broken trend-line from 2018 lows has once again capped the rally in the SPX500. However, while we remain above the broken base at 2941.92, focus is on a further grind to the upside with bulls looking to penetrate above all-time highs at 3028.27 next. The near term bullish bias will only if price slips back below the 2941.92 level.
Some FX traders prefer to make use of indicators, while others prefer using seasonality or other aspects of technical trading. Among the different types of trading, price action trading is one such approach.
The term often evokes complexity in analyzing the chart or the price of the security. However, price action and its concepts are very simple.
Simply put, price action forex trading is a method of technical analysis. In price action trading, a forex trader reads the market based on the recent and historical price movements.
Instead of relying on technical indicators or other technical analysis trading tools, price action forex traders rely solely on price. A major distinction between price action trading and other forms of FX trading is that price forms the basis of the trading decisions.
Price action trading is quite subjective compared to other forms of technical analysis. This is because there are no defined rules. It is partly due to this subjectivity that price action is not as widely popular as indicators.
Therefore, it is quite possible that no two forex traders would be able to interpret price in the same way.
One thing that distinguishes price action forex trading from technical indicator trading is that the former is used as predictive analysis. In other words, FX traders use price action in real-time to predict what the next move will be.
In contrast, indicator-based trading is reactive in nature. Only after a trading signal is triggered, based on the technical indicators, is a trade entered.
Why is Price Action Trading Subjective?
Price action forex trading is subjective because there are many different ways to analyze the markets. Forex traders make use of a host of different techniques before making a trading decision. Even traders who use similar price action tools can often interpret the price chart differently.
Due to the subjectivity of price action trading, it can be cumbersome to come up with a mechanical trading system that uses price action trading.
What Tools Can We Use in Price Action Trading?
There are a number of tools that forex traders use in price action trading. Firstly, price is the most important variable in price action analysis. Therefore, regardless of the various tools one can use, price itself remains the key factor when it comes to decision making.
Price action forex trading techniques involve:
Candlestick Patterns
These are patterns that evolve on the candlestick chart. They visually represent the investor or the forex trader’s sentiment in the security. While there are many candlestick patterns, there are a few that are commonly recurring. FX traders use these patterns to predict what price will do next.
Chart Patterns
Chart patterns involve analyzing certain repeating patterns. For example, price moves into a consolidation phase after a strong rally. Depending on the way the consolidation turns out, it can be deemed a bullish flag or a bullish pennant pattern. Because technical analysis is all about analyzing past price history to predict future price movements, there is considerable evidence that price will once again resume the previous rally.
There are many other chart patterns such as the head and shoulders pattern, double tops and bottoms and so on. One might argue the validity of the patterns. But, in fact, it is the market sentiment that leads to the formation of such patterns.
Support/Resistance
Support and resistance form the basis of price action. Regardless of the methods used, the price of any security tends to respect the laws of support and resistance. It is also known as supply and demand. Price action forex traders rely heavily upon support and resistance to draw their conclusions.
Who Uses Price Action FX Trading?
Price action trading is primarily used by speculators and day traders. You can also find a few forex trading strategies based on price action techniques. Interestingly, price action can be applied to just about any security and not just forex.
A unique aspect of price action trading is that one can design and develop their custom price action FX trading system.
Many traders might wonder about the pros and cons of price action trading and if indeed one can gain an edge in the markets. The bottom line remains that price action trading is merely one of the many ways to analyze the FX markets.
There is no proven edge with price action trading. In the end, forex trading is all about managing one’s risk while ensuring to make profits consistently. Price action trading is, therefore, just one of the many means available in technical analysis.
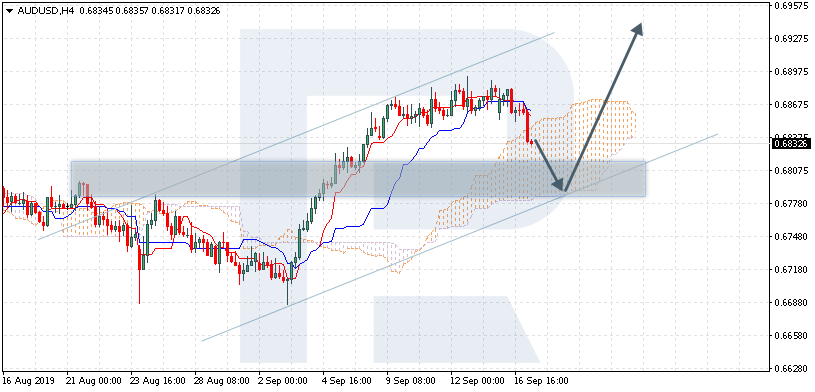
AUDUSD is trading at 0.6832; the instrument is moving inside Ichimoku Cloud, thus indicating a sideways tendency. The markets could indicate that the price may test the cloud’s downside border at 0.6780 and then resume moving upwards to reach 0.6935. Another signal to confirm further ascending movement is the price’s rebounding from the rising channel’s downside border. However, the scenario that implies further growth may be canceled if the price breaks the cloud’s downside border and fixes below 0.6765. In this case, the pair may continue falling towards 0.6685. After breaking the cloud’s upside border and fixing above 0.6875, the price may continue moving upwards.
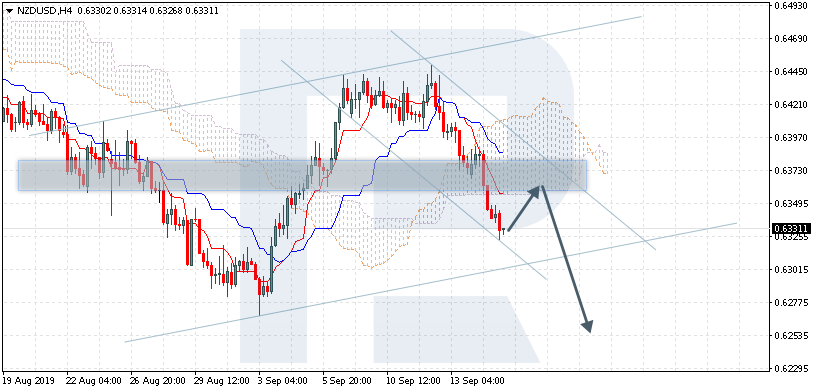
NZDUSD, “New Zealand Dollar vs US Dollar”
NZDUSD is trading at 0.6331; the instrument is moving below Ichimoku Cloud, thus indicating a descending tendency. The markets could indicate that the price may test the cloud’s downside border at 0.6355 and then resume moving downwards to reach 0.6255. Another signal to confirm further descending movement is the price’s rebounding from the descending channel’s upside border. However, the scenario that implies further decline may be canceled if the price breaks the cloud’s upside border and fixes above 0.6405. In this case, the pair may continue growing towards 0.6485. After breaking the rising channel’s downside border and fixing below 0.6295, the price may continue moving downwards.
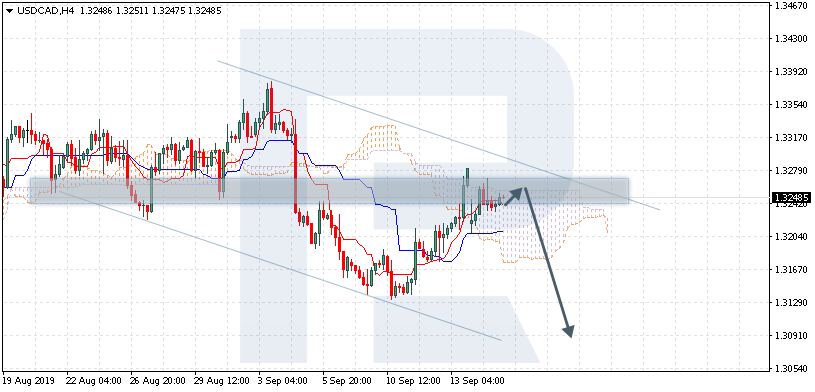
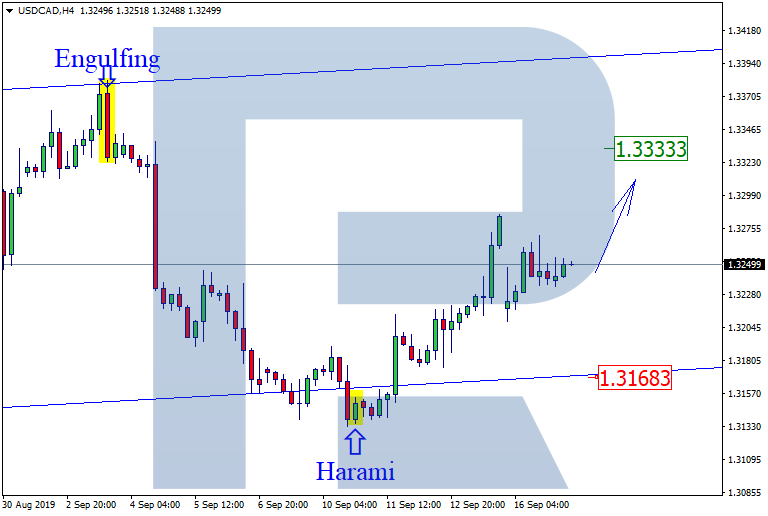
USDCAD, “US Dollar vs Canadian Dollar”
USDCAD is trading at 1.3248; the instrument is moving inside Ichimoku Cloud, thus indicating a sideways tendency. The markets could indicate that the price may test the cloud’s upside border at 1.3255 and then resume moving downwards to reach 1.3090. Another signal to confirm further descending movement is the price’s rebounding from the descending channel’s upside border. However, the scenario that implies further decline may be canceled if the price breaks the cloud’s upside border and fixes above 1.3275. In this case, the pair may continue growing towards 1.3345. After breaking the cloud’s downside border and fixing below 1.3160, the price may continue moving downwards.
Attention! Forecasts presented in this section only reflect the author’s private opinion and should not be considered as guidance for trading. RoboForex LP bears no responsibility for trading results based on trading recommendations described in these analytical reviews.
German ZEW sentiment improvement bullish for EURUSD
ZEW Indicator of economic sentiment for Germany rose significantly in September 2019, after a decline in August. Will the EURUSD rise?
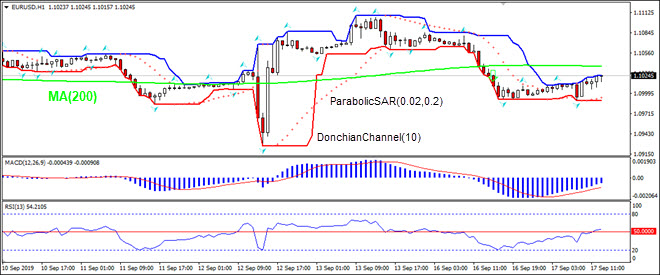
The price chart on 1-hour timeframe shows EURUSD: H1 is trading sideways. The price is below the 200-period moving average MA(200) which has leveled off. And the RSI is at 50 level and set to fall below. There is no trend yet formed, traders have to decide when it would be a best time to enter the market.
As we can see in the H4 chart, after rebounding from the rising channel’s downside border, USDCAD has formed several reversal patterns. Right now, the pair is trying to reverse after forming Harami pattern. At the moment, it may be assumed that the price may complete a slight correction and resume growing towards 1.3333. However, we shouldn’t ignore a possibility that the instrument may return to the support line and update the low.
AUDUSD, “Australian Dollar vs US Dollar”
As we can see in the H4 chart, AUDUSD has formed several reversal patterns, including Shooting Star, close to the resistance level. Right now, the pair is trying to reverse. Judging by the previous movements, we may assume that the price may finish a slight pullback and then continue trading downwards to reach 0.6792. However, we shouldn’t ignore a possibility that the instrument may resume growing towards 0.6900.
Attention! Forecasts presented in this section only reflect the author’s private opinion and should not be considered as guidance for trading. RoboForex LP bears no responsibility for trading results based on trading recommendations described in these analytical reviews.
The US dollar remains in the green today ahead of tomorrow’s FOMC meeting thoughthe market is widely expecting the Fed to ease by a further .25% in line with commentary from Powell and other policymakers since the last meeting. Optimism around US/China trade negotiations offers some risk to this view though. Given the uncertainty, the Fed is not likely to hold off on easing solely for this reason. USD index trades 98.19 last having bounced off the 97.57 low.
EUR Lower
EURUSD remains subdued today with price hovering just below the 1.1025 level which was broken yesterday under the weight of a resurgent US dollar. EUR has pulled back strongly from the post-ECB highs printed last week. However, any easing from the Fed this week could stem the declines.
GBP Traders Await Supreme Court Decision
GBPUSD has been a little softer today. Although for now, the pair remains above the 1.2382 level. While above here focus remains on a further push higher to test the bear channel top. The market is waiting on the outcome of the UK Supreme Court hearing taking place today. This will determine whether UK PM Johnson acted illegally when proroguing parliament. If the decision is upheld, this would be firmly bullish for GBP as it could see MPs being returned to parliament ahead of the current October 14th date. Doing so would allow more time for counter-moves against Johnson.
Risk Assets Soften
Risk assets have been a little weaker today as the market remains cautious over the escalating tensions between the US and Iran. Following a suspected Iranian drone strike on the world’s largest oil processing plant in Saudi Arabia, Iran has responded to US accusations with a firm warning that it is ready for war. SPX500 trades 2966.88 last having been capped by a retest of the broken bullish trend line from 2018 lows.
Safe Haven Inflows Seen
Safe havens have been a little higher against USD today with both gold and JPY rising in light of the pullback in equities. USDJPY trades 108.19 last with price having lost momentum in the recent rally following the drone strikes over the weekend. XAUUSD, though in the green today, remains weaker following the rejection from 1522.75. However, the potential for further easing from the Fed tomorrow could see gold prices trading higher again over the week.
Crude Remains Above 61.06
Oil prices continue to hold above the 61.06 level today following the explosive moves seen at the open as the market reacted to around 5% of the global oil supply being wiped out. Following the spike higher on Sunday, price subsequently dipped back down to the 58.27 level which held as support, turning price higher once again. Elevated concerns around the potential for military conflict between the US and China are keeping oil prices supported here.
CAD Capped
USDCAD price action has stagnated over recent sessions with volatility drying up ahead of the FOMC tomorrow, despite the wild moves in oil. USDCAD trades 1.3248 last, with price remaining rangebound between the 1.3207 level and 1.33 level for now.
RBA Minutes Weigh on AUD
AUDUSD has been firmly lower today as the release of the RBA meeting minutes overnight has heightened expectations of further easing in the near term. Indeed, with the latest China data showing severe weakness, the near term picture remains bearish for AUD which is also being weighed on by softer gold prices.
President Duterte’s joint exploration framework with China is a historical breakthrough. But since it has potential to de-escalate tensions over time, it is opposed by those interests that prefer rearmament, even if that would lead to a split of Southeast Asia and new nuclearization.
In early 2018, the Philippines and China agreed to set up a special panel to work out how the two could jointly explore oil and gas in parts of the South China Sea that both sides claim without having to address the issue of sovereignty. That was something of a breakthrough.
Last fall, President Xi Jinping’s state visit to the Philippines resulted in the bilateral memorandum of understanding on oil and gas development in the contested South China Sea (SCS). It was one of the some 30 documents signed during Xi’s visit in Manila.
Following a recent meeting with President Xi, Duterte said the Philippines could set aside the ruling of the international arbitral tribunal on China’s SCS claims, in exchange for a joint oil and gas exploration deal with Beijing.
The Xi-Duterte framework relative to Malampaya
To undermine the breakthrough and cooperation, critics argue that Duterte is “abandoning” the international ruling on South China Sea. In reality, setting aside the ruling does not mean abandoning it.
As I have argued since the early 2010s, the friction between the Philippines and China can be overcome by focusing on the economic cooperative potential, suspending the stated bilateral differences, creating mechanisms to settle those disagreements over time and fostering joint confidence-building measures. That’s what most ASEAN countries aspire to, including those that have SCS disagreements with China.
It may be useful to compare the stated joint exploration framework with another historical precedent. In 1989, during the rule of President Corazon Aquino, a gas field was discovered offshore Palawan. Following successful appraisal in the ‘90s – the reign of Fidel Ramos and Joseph Estrada, respectively – the Malampaya field became operational in 2001.
According to its operators’ estimate, as of 2018, the Malampaya, whose supply is forecast to start declining by 2022, has surpassed $10 billion in Philippine government revenues. That’s a nice way to say that that 90% of the Malampaya revenues go to multinationals in Europe and the US. In reality, the Philippine interest in the gas field is a just 10%, as opposed to the British-Dutch Shell (45%) and the US Chevron (45%).
According to President Duterte’s statement, China has promised to give the Philippines 60% of the profit from any gas or oil deal as opposed to China’s 40%. That’s a breakthrough; something that none of Duterte’s precursors achieved in the past decades.
Of course, there is another possible approach to the SCS issues, as well. After Duterte’s statement, Vice President Leni Robredo, the last major holdout of the Liberal Party meltdown following the 2016 election, blamed Duterte for a “shameful’ sellout to China over the joint-exploration deal. In turn, Duterte has argued that the Philippines needs to stop the “foolishness” of such scenarios.
Where would such scenarios lead?
The other scenario
In the April phone conversation between President Trump and President Duterte, Trump boasted about two US nuclear submarines near North Korea. “We have a lot of firepower over there,” Trump said. “We have two nuclear submarines — not that we want to use them at all.” The willingness to use nuclear weapons in the region is the latest phase in the ongoing rearmament.
During the Cold War, Washington created the security architecture in the region, including the Southeast Asia Treaty Organization (SEATO) signed in Manila, in the mid-50s. The SEATO’s stated task was to contain Soviet Communism. Hence, the U.S.-led wars from the Korean Peninsula in the early 1950s and the massacre of almost a million Communists and Chinese in Indonesia in the mid-‘60s to the war in Vietnam and subsequent conflicts in the former Indo-China in the ‘70s until the SEATO’s dissolution.
Today, the region looks very different. In relative terms, America’s economic role has been descending. Meanwhile, China has matured into a major economic contributor, as reflected by the economic spillovers associated with One Road One Belt initiatives.
Ever since President Obama’s pivot to Asia in the early 2010s, Pentagon has been pushing rearmament in the region, through arms sales. In 2017, the U.S. sold $42 billion in weapons to foreign countries, but $8 billion (20% of the total) in the “Indo-Pacific” region. Yet, in global arms transfers, Asia Pacific is the most lucrative region (over 40% of world total). Consequently, US defense contractors would like to double their revenues in the region.
Pentagon’s highest executives have a personal stake in rearmament. Former US Defense Secretary James Mattis served on the board of General Dynamics, a leading US defense contractor. His successor Patrick Shanahan served over 30 years in executive roles at Boeing, the largest US military exporter.
Current Defense Secretary Mark Esper has been recognized as America’s top military lobbyist. He spent seven years as the head of government relations at the leading defense contractor Raytheon.
In the early 2010s, the strategic goals of the former Aquino government and those of current Vice President Robredo have largely converged with the US “pivot to Asia.” As President Obama’s Defense Secretary Leon Panetta affirmed in 2012, this plan was predicated on the deployment of 60% of US warships to Asia Pacific by 2020 – that is, next year.
Last month, Pentagon’s new chief Esper illuminated the next phase of US rearmament in the region.
Pentagon’s missile aspirations in Asia
A day after Washington withdrew from the landmark Intermediate-Range Nuclear Forces (INF) treaty with Russia – that President Reagan and Gorbachev in 1987 hoped would ensure peace in the 21st century – Esper stated the US will be looking to deploy new ground-launched, intermediate- range missiles in Asia.
According to Pentagon estimates, a low-flying cruise missile with a potential range of about 1,000km could be ready for deployment in 18 months. The US continues to have almost 4,000 nuclear warheads.
Estimated Global Nuclear Warhead Inventories, May 2019
Esper has acknowledged the US is considering placing new medium-range conventional weapons in Asia: “We would like to deploy a capability sooner rather than later.” While he has not specified where the US intends to deploy these weapons, US allies in the region are historically prioritized.
In brief, geopolitical pressure toward missile deployments is about to begin in Southeast Asia.
ASEAN versus nightmare scenarios
In the Philippines, the history of nuclear deployments has been largely covert. Article II Section 8 of the Philippine Constitution forbids the presence of nuclear weapons in the country. But such clauses do not constrain its allies.
During the Cold War Marcos era, US nuclear warheads were secretly stockpiled in the Philippines. When the US Navy withdrew from Subic Bay naval base in 1992, it was due to the failure to iron out differences, including Manila’s ban on nuclear weapons.
By 1995, the ASEAN nations agreed on the Southeast Asian Nuclear-Weapon-Free Zone Treaty (SEANWFZ). The Bangkok Treaty entered into force on March 28, 1997 and obliges its members not to develop, manufacture or otherwise acquire, possess or have control over nuclear weapons. However, allies are not constrained by such limitations.
When President Aquino and Foreign Minister Rosario agreed with the US on a rotating US military presence at Philippine bases in March 2016 – right before Duterte’s landslide win – the effort seems to have been to lock in a path to closer military alignment (which eventually would require such deployments).
That scenario could bury the economic promise of the Philippines in the 21st century. President Duterte’s rebalancing, including a joint exploration deal, is an effort to foster new economic cooperation with China, in addition to the old ties with the US.
That rebalancing is very much in line with ASEAN’s efforts at peaceful, regional economic integration. Rearmament and nuclearization aren’t.
About the Author:
Dr. Dan Steinbock is the founder of Difference Group and has served at the India, China and America Institute (US), Shanghai Institute for International Studies (China) and the EU Center (Singapore). For more, see http://www.differencegroup.net/
The original commentary was released by The Manila Times on September 15, 2019
Aggressive sales were observed on the EUR/USD currency pair yesterday. The fall in quotes exceeded 70 points. The trading instrument is currently consolidating. The local support and resistance levels are: 1.09850 and 1.10150, respectively. Participants in financial markets continue to monitor the development of the situation in the oil market. Today we expect the publication of important economic releases. We recommend opening positions from key support and resistance levels.
The Economic News Feed for 17.09.2019:
– ZEW economic sentiment index in Germany and EU – 12:00 (GMT+3:00);
– Industrial production in the USA (EU) – 12:00 (GMT+3:00);
Indicators do not give accurate signals: 50 MA began to cross 100 MA.
The MACD histogram is in the negative zone but above the signal line, which gives a weak signal to sell EUR/USD.
The Stochastic Oscillator is in the neutral zone, the %K line began to cross the %D line. There are no signals at the moment.
Trading recommendations
Support levels: 1.09850, 1.09450
Resistance levels: 1.10150, 1.10550, 1.10850
If the price consolidates above 1.10150, expect further growth toward 1.10500-1.10700.
Alternatively the quotes could decrease to 1.09600-1.09400.
The GBP/USD currency pair
Technical indicators of the currency pair:
Prev Open: 1.24649
Open: 1.24248
% chg. over the last day: -0.56
Day’s range: 1.23960 – 1.24316
52 wk range: 1.1995 – 1.3385
The GBP/USD currency pair stabilized after a protracted rally. A trading instrument is consolidating. In the near future, technical correction is not ruled out. At the moment, GBP/USD quotes are testing a round level of 1.24000. Mark 1.24600 acts as local resistance. Investors are waiting for new information regarding the Brexit process. Positions must be opened from key levels.
The Economic News Feed for 17.09.2019 is calm.
Indicators do not give accurate signals, the price has fixed between 50 MA and 100 MA.
The MACD histogram is in the negative zone, which signals a possible correction of the GBP/USD currency pair.
The Stochastic Oscillator is in the neutral zone, the %K line crossed the %D line. There are no signals at the moment.
Trading recommendations
Support levels: 1.24000, 1.23550, 1.22850
Resistance levels: 1.24600, 1.25000
If the price consolidates below the round level of 1.24000, expect a correction toward 1.23600-1.23300.
Alternatively, the quotes can grow toward 1.24900-1.25200.
The USD/CAD currency pair
Technical indicators of the currency pair:
Prev Open: 1.32203
Open: 1.32392
% chg. over the last day: +0.21
Day’s range: 1.32343 – 1.32595
52 wk range: 1.2727 – 1.3664
An ambiguous technical picture has developed on the USD/CAD currency pair. Looney is in lateral movement. There is no defined trend. USD/CAD quotes test local support and resistance levels: 1.32350 and 1.32650, respectively. The Canadian dollar is supported by the positive dynamics of oil quotes. We recommend that you closely monitor the development of the situation in the oil market. Positions must be opened from key levels.
At 15:30 (GMT+3:00), data on sales in the manufacturing sector of Canada will be published.
Indicators do not give accurate signals: the price crossed 50 MA.
The MACD histogram is near 0.
The Stochastic Oscillator is in the neutral zone, the %K line is below the %D line, which gives a signal to sell USD/CAD.
Trading recommendations
Support levels: 1.32350, 1.32100, 1.31800
Resistance levels: 1.32650, 1.32850, 1.33150
If the price consolidates below 1.32350, USD/CAD quotes are expected to fall. The potential movement is to 1.32000-1.31800.
An alternative could be the growth of the USD/CAD currency pair to a round level of 1.33000.
The USD/JPY currency pair
Technical indicators of the currency pair:
Prev Open: 107.531
Open: 108.148
% chg. over the last day: +0.37
Day’s range: 108.022 – 108.369
52 wk range: 104.97 – 114.56
The USD/JPY currency pair continues to trade flat. There is no defined trend. At the moment, the local support and resistance levels are: 107.850 and 108.250, respectively. Demand for safe haven currencies has grown due to the tense situation in the Middle East. In the near future, technical correction of the trading instrument is not ruled out. We also recommend that you pay attention to the dynamics of the yield of US government securities. Positions must be opened from key levels.
The Economic News Feed for 17.09.2019 is calm
Indicators do not give accurate signals: the price is consolidating near 50 MA.
The MACD histogram is in the positive zone, but below the signal line, which gives a weak signal to buy USD/JPY.
The Stochastic Oscillator is in the neutral zone, the %K line crossed the %D line. There are no signals at the moment.
Trading recommendations
Support levels: 107.850, 107.500, 107.200
Resistance levels: 108.250, 108.500
If the price consolidates below 107.850, expect a correction toward 107.500-107.200.
Alternatively, the quotes could grow toward 108.500-108.700.
Equity markets fell while the safe-haven assets rose following reports of the drone attacks on Saudi oil fields.
The incident which took place late on Friday saw investors reacting as the markets opened on Monday.
Economic data was spare on the day, with only China reporting the industrial production and retail sales numbers.
Euro Slips on a Stronger Greenback
The euro gave back some of the gains from last week. Economic data from both the eurozone and the US was sparse. The dollar gained as investors rushed to the safe-haven USD in response to the drone attacks on Saudi oil facilities. Investors will be looking to the German ZEW economic sentiment report due later today.
EURUSD Reverses Gains
The currency pair erased some of the gains from last week’s ECB meeting. Price slipped off the support level of 1.1030 to test the dynamic support of the trend line. The pair could now move into a consolidation phase below the support/resistance level. To the downside, the lower support area of 1.0944 – 1.0925 could be tested if the bearish momentum continues.
Sterling Holds Steady Near Two-Month Highs
The pound sterling was muted to the strength of the US dollar. The GBPUSD held steady near Friday’s highs, which marks a two-month high in the currency pair. British Prime Minister Boris Johnson is in Luxembourg meeting with the European Commission President, Jean-Claude Juncker.
GBPUSD Slips a Few Pips Away From Resistance
The currency pair reversed gains, just a few pips off the resistance level of 1.2533 – 1.2511. But following the reversal yesterday, price action is forming a higher low. This could confirm a possible breakout from the resistance area. However, we expect the gains to stall near the resistance level. GBPUSD could, therefore, settle within the range of the said resistance and the lower support of 1.2328.
Gold Rises More Than 1% in Response to Saudi Oil Attacks
The precious metal surged more than one percent on Monday. Gold was reacting to news about the drone attacks on Saudi oil facilities. The news saw investors rushing to safe haven assets in anticipation of rising tensions in the Middle East. In response, Saudi Arabia shut down half of its oil production. US President Trump blamed Iran while Yemen’s Houthi rebels claimed responsibility for the attack.
XAUUSD Fails to Breakout Higher
While gold prices surged at the open, the precious metal failed to close above the resistance level of 1508. Price action held steady within the range over the day. Despite the gap higher, XAUUSD remains within the range and will remain that way in the run-up to Wednesday’s Fed meeting. The bias continues to the upside as gold is likely to form a lower high in the longer-term trend.