The key points regarding recent drill results and next steps are presented in a Haywood report.
In a Sept. 4 research note, Haywood analyst Mick Carew reported that GT Gold Corp.’s (GTT:TSX.V) recent drill results from the Saddle North discovery at its Tatogga project in British Columbia are “positive overall.”
“The results complement earlier results from Saddle North and demonstrate continuity within both high-grade core and lower-grade, near-surface mineralization,” he added.
Carew reviewed the new drill results, which are from the completed first phase, consisting of 10,000 meters (10,000m), of the Saddle North program.
Assay highlights included 1,206 meters (1,206m) grading 0.57 grams per ton (0.57 g/t) gold, 0.26% copper, 0.96 g/t silver from 18m downhole, including 51m grading 4.05 g/t gold, 0.3% copper and 3.06 g/t silver.
Mineralization extended downplunge and along strike. Specifically, hole TTD126 extended copper-gold mineralization at depth to about 1,4001,500m downplunge. At that depth, the higher-grade core spans about 250300m in width by about 250300m in strike length.
Hole TTD125 suggested the potential for near-surface, open-pit mining as it showed lower-grade, near-surface copper-gold mineralization. It extended this shallow zone 200m to the northwest. Carew pointed out, however, that the bulk of the Saddle North deposit would likely require underground mining if an economic resource were defined, and such an approach can be capital intensive.
Carew noted the next steps for GT Gold and Saddle North. The company is now in the drill program’s second phase, which will consist of a total of 15,000m of infill and expansion drilling along with drilling of peripheral targets around Saddle North.
Once phase two is completed, likely in October, GT Gold intends to pursue preparation of an initial resource estimate. Already management has started “to consult with external engineering groups and others to garner a better understanding of what is required for an initial resource estimate as well as the economic potential of the project,” added the analyst.
GT Gold is trading today at around CA$0.98 per share.
Disclosure: 1) Doresa Banning compiled this article for Streetwise Reports LLC and provides services to Streetwise Reports as an independent contractor. She or members of her household own securities of the following companies mentioned in the article: None. She or members of her household are paid by the following companies mentioned in this article: None. 2) The following companies mentioned in this article are billboard sponsors of Streetwise Reports: None. Click here for important disclosures about sponsor fees. 3) Comments and opinions expressed are those of the specific experts and not of Streetwise Reports or its officers. The information provided above is for informational purposes only and is not a recommendation to buy or sell any security. 4) The article does not constitute investment advice. Each reader is encouraged to consult with his or her individual financial professional and any action a reader takes as a result of information presented here is his or her own responsibility. By opening this page, each reader accepts and agrees to Streetwise Reports’ terms of use and full legal disclaimer. This article is not a solicitation for investment. Streetwise Reports does not render general or specific investment advice and the information on Streetwise Reports should not be considered a recommendation to buy or sell any security. Streetwise Reports does not endorse or recommend the business, products, services or securities of any company mentioned on Streetwise Reports. 5) From time to time, Streetwise Reports LLC and its directors, officers, employees or members of their families, as well as persons interviewed for articles and interviews on the site, may have a long or short position in securities mentioned. Directors, officers, employees or members of their immediate families are prohibited from making purchases and/or sales of those securities in the open market or otherwise from the time of the interview or the decision to write an article until three business days after the publication of the interview or article. The foregoing prohibition does not apply to articles that in substance only restate previously published company releases.
Disclosures from Haywood Securities, GT Gold Corp., Uncovered Radar Flash, September 4, 2019
Analyst Certification: I, Mick Carew, hereby certify that the views expressed in this report (which includes the rating assigned to the issuers shares as well as the analytical substance and tone of the report) accurately reflect my/our personal views about the subject securities and the issuer. No part of my/our compensation was, is, or will be directly or indirectly related to the specific recommendations.
Important Disclosures
Of the companies included in the report the following Important Disclosures apply: ▪Haywood Securities, Inc. has reviewed lead projects of GT Gold Corp. (GTT-V) and a portion of the expenses for this travel have been reimbursed by the issuer.
▪ Haywood Securities Inc. or an Affiliate has managed or co-managed or participated as selling group in a public offering of securities for GT Gold Corp. (GTT-V) in the past 12 months.
Other material conflict of interest of the research analyst of which the research analyst or Haywood Securities Inc. knows or has reason to know at the time of publication or at the time of public appearance: n/a.
Fund manager Matt Geiger provides his overview of the resource market and shares some principles he is using to invest in today’s market.
The natural resource landscape has shifted dramatically since the end of 2018. At the time, we were still nursing our wounds from an unexpectedly vicious 2018 and hoping to avoid a repeat performance in 2019. I did speculate that “we may have already exited the bear market as of late December 2018. The nickel price is up roughly 25% YTD, the gold price is up roughly 10% since early December, the TSXV is up 15% since mid-December, and the MJG partnership itself was up 20.5% in January alone.”
In hindsight, it looks like we did indeed exit the bear market as of late December 2018. The nickel price is now up 54% YTD. The price of gold is now up 25% since earlier December. The MJG partnership was up 42% in the first half of the year. The major diversified miners have hit 52-week highs within the past 60 days. The major precious metal royalty names have hit either multi-year or all-time highs recently. The same applies to the GDX and GDXJ. These are the types of moves you’d expect to see in a mining bull market.
While other metals such as nickel and iron ore have also seen sharp price increases this year, the stars of the show have been gold and its sister metal silver. In June, the gold price rallied sharply above $1370breaking through a stiff technical resistance level that had existed since mid-2013. The gold price has since continued its ascent to above $1500 and currently sits at $1505 per ounce. This move has been driven primarily by generalists re-positioning into precious metals after nearly eight years of neglect, though it should be noted that the big Wall Street institutions remain largely on the sideline (as demonstrated by the GLD Inventory to Price ratio often cited in the IKN Newsletter). This lack of Wall Street participation is a positive as far as I’m concerned and indicates that this move may be more sustained that the short-lived, euphoric rally that we experienced in 2016.
The most devastating argument used against owning gold is that the metal sits in a safe deposit box and generates no interest. The opportunity cost of holding gold is too high, argues its critics, given that there are plenty of other safe haven instruments in which to shelter capital and still earn interest. To be fair, this anti-gold stance was the correct call for much of the past eight years.
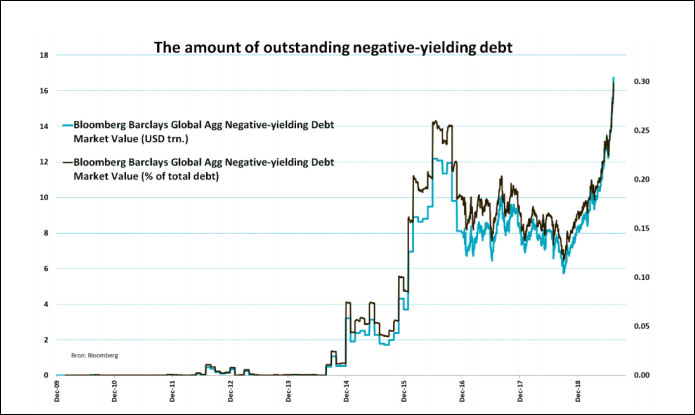
However, this argument has been flipped on its head over the past nine months due to a global surge in negative-yielding debt. The market value of global negative-yielding debt has surpassed $16 trillion for the first time in history. A staggering 30% of investment grade bonds globally now yield below zero. (This includes government, corporate, and securitized.) As seen in the chart below from Bloomberg, there was virtually no negative-yielding debt as recently as five years ago. This is a very new phenomenon.
This is astounding when you think about it. Why would an investor pay somebody else to hold their money? It simply doesn’t pass the smell test. Suddenly, a shiny rock sitting in a safe deposit box paying 0% interest looks very attractive relative to this alternative. The strongest argument against gold has now become the chief justification for owning the metal.
As one would expect in a bull market, silver has outperformed gold over this recent period. It is possible, if not likely, that we saw a peak in the gold to silver ratio at just above 93 in early July. Assuming that this bull market continues apace, we can expect this ratio (now sitting at 85) to trend lower over the months ahead. The historical average during the 20th century was a 47:1 ratio; we have been due for some time for a significant mean reversion.
While the immediate future looks bright for precious metals, the outlook is murkier for much of the rest of the commodities complex. U.S. farm income remains roughly 50% below its 2013 peak and, while farmland is due for a multi-year bull market, the immediate future depends more on U.S./China trade war dynamics than anything else. Industrial metals like zinc have struggled mightily over worries of a global slowdown, despite record low inventories and limited expected supply growth. Energy metals such as uranium, vanadium, lithium and cobalt are particularly hated as investors have cooled for the moment on the electrification narrative.
My expectation is that the rest of the metals complex will begin to play catch up sometime within the next 12 months. This scenario hinges on the global economy holding together and not dipping into a sustained recession. If I’m wrong on this account and we do see a sustained global recession, then precious metals equities will surge from current levelsto the detriment of base metals, energy metals and much of the rest of the natural resource arena aside from farmland. In a worst-case scenario, we see another 2008-like financial panic where all risk assets are sold off indiscriminately. Even though the price of physical gold would likely skyrocket during such a panic, this would not be to the benefit of those invested in precious metal equitiesat least until the initial panic subsides.
Given the variability in potential outcomes, the best course of action is to stick to the basics. Continue to back experienced, well-incentivized management teamsirrespective of whether they are focusing on precious metals, base metals, energy metals or any other commodity. Prioritize high quality “in the money” projects over optionality plays, even when temptation exists to bet on $2,000 Au and $30 Ag. Avoid stocks with less than twelve months of working capital and mercilessly sell holdings that deviate from their stated plans. Average down when a company’s share price falls but the investment thesis remains intact. Take profits when a company’s share price doubles without a fundamentally positive development. The list goes on. None of this is particularly complex or groundbreaking, but by doing these simple things we set ourselves up for long-term successirrespective of how the rest of 2019 unfolds.
Matt Geiger is Managing Partner at MJG Capital, a limited partnership specializing in natural resource investments. The partnership is long-only and holds a concentrated portfolio of resource equities. Investments include explorers, developers, and producers of energy metals, industrial metals, precious metals and ag minerals. Geiger is a graduate of the Wharton School at the University of Pennsylvania and previously founded a venture-backed technology company recently valued at $150 million.
Disclosure: 1) Statements and opinions expressed are the opinions of Matt Geiger and not of Streetwise Reports or its officers. Matt Geiger is wholly responsible for the validity of the statements. Streetwise Reports was not involved in any aspect of the article preparation. The author was not paid by Streetwise Reports LLC for this article. Streetwise Reports was not paid by the author to publish or syndicate this article. 2) This article does not constitute investment advice. Each reader is encouraged to consult with his or her individual financial professional and any action a reader takes as a result of information presented here is his or her own responsibility. By opening this page, each reader accepts and agrees to Streetwise Reports’ terms of use and full legal disclaimer. This article is not a solicitation for investment. Streetwise Reports does not render general or specific investment advice and the information on Streetwise Reports should not be considered a recommendation to buy or sell any security. Streetwise Reports does not endorse or recommend the business, products, services or securities of any company mentioned on Streetwise Reports. 3) From time to time, Streetwise Reports LLC and its directors, officers, employees or members of their families, as well as persons interviewed for articles and interviews on the site, may have a long or short position in securities mentioned. Directors, officers, employees or members of their immediate families are prohibited from making purchases and/or sales of those securities in the open market or otherwise from the time of the interview or the decision to write an article, until one week after the publication of the interview or article.
I’m Mike Gleason and welcome to another addition of the Weekly Market Wrap Podcast.
Later in today’s program we’ll hear from Forbes CEO, business icon and two-time presidential candidate, Steve Forbes. Mr. Forbes unloads on the Fed and its horrific track record — with accuracy that’s worse than a bunch of monkeys throwing darts at a dartboard, he says.
Forbes discusses Donald Trump’s chances at reelection and lays out the case why you simply must have at least some gold in your portfolio. So be sure to stick around for an encore of Money Metals exclusive interview with Steve Forbes, coming up after this week’s market update.
It’s been a big week of geopolitical strife and potential crisis points for financial markets. The week began with one of the biggest single day oil spikes on record, then saw the Federal Reserve lose control of its own interest rate in the repo market before announcing another rate cut.
Yet these and other developments are having surprisingly little impact on Wall Street. We aren’t seeing huge stock market gyrations or a mass migration by investors into precious metals. The S&P 500 is essentially flat for the week while gold prices are trading modestly higher.
As of this Friday recording, the yellow metal comes in at $1,505 an ounce and is posting a weekly gain of 1.0%. Silver is showing some relative strength, up 1.9% since last Friday’s close to trade at $17.86 an ounce. Platinum is essentially unchanged at $950. And finally, palladium shows a weekly gain of 2.4 % to come in at a lofty $1,653 per ounce.
On Wednesday, the Federal Reserve cut its benchmark Fed funds rate by a quarter point. Though the move was widely expected, it was not without controversy.
The Federal Open Market Committee showed some unusual division within its ranks. One policymaker favored a bigger cut while two wanted no cut at all. The more hawkish voices within the Fed objected to the cut on grounds of inflation risk – especially following Monday’s $9 spike in crude oil.
Other current and former Fed officials are taking great umbrage at the idea of using loose monetary policy to help facilitate President Donald Trump’s trade policies. Of course, it is impossible to separate that particular objection from underlying political biases at the supposedly non-political Fed.
President Trump himself expressed dissatisfaction with what he continues to view as too slow a pace of easing. He hammered Fed chair Jerome Powell for having “No guts, no sense, no vision.”
Powell and company also apparently lack the ability to keep their own interest rate within the range they announce to the world. In the so-called repo market used by banks and other institutions for short-term funding needs, interest rates have surged above the Fed’s target level.
The abnormal activity in the repo market threatened the liquidity of banks and the stability of money market funds. Nervous Fed officials responded with a massive $203 billion injection of cash over the past few days. It was the central bank’s biggest emergency intervention into financial markets since 2008.
Yet investors seem totally complacent about the risks of another financial crisis taking hold. The lack of any fear gauges flashing in the stock market suggests investors view the Fed’s reversion to rate cuts and Quantitative Easing as some kind of new normal.
Not even the growing threats of oil supply disruptions, war with Iran, and escalating conflict with Russia and China seem to register with Wall Street.
One threat to Wall Street and wealth holders in general that could soon become impossible to ignore is the rise of Elizabeth Warren.
In recent weeks, the Massachusetts ultra-liberal has stolen much of Bernie Sanders’ thunder. She has shot up in the polls to become the top challenger to Joe Biden in the Democrats’ presidential sweepstakes.
According to Election Betting Odds, Warren now has a better chance than anyone – including Joe Biden – of winning the Democrat nomination. The odds can swing back and forth just as dramatically as the polls, but political futures markets tend to be a step or two ahead of the pollsters.
Warren’s policy positions essentially replicate the socialist platform of Bernie Sanders. Warren wants the federal government to take over everything from private healthcare to energy to education.
She would partially fund her government takeovers by imposing a new “wealth tax.” She has also talked vaguely about changing the monetary system to enable the government to essentially print dollars directly – rather than have to borrow from the bond market.
An Elizabeth Warren victory in 2020 could be akin to another financial crisis. Billionaire hedge fund manager Leon Cooperman sees the rise of Warren, along with rising debt in the economy, as major threats to the stock market.
Leon Cooperman: As much as I feel the market’s okay near term, I am concerned looking out 2020 and beyond. Number one, the debt. There’s nobody in government seems to be worried about the debt we’re creating. Now personally, I was very surprised by how abruptly the economy slowed in the fourth quarter in the face of very nominal increase in interest rates. That tells me there’s too much debt. Secondly, it was referenced earlier, I think there’s shift to the left in the country is a real concern.
CNBC Anchor: Elizabeth Warren, what if she gets the nomination? What does that mean for the stock market?
Leon Cooperman: The significance of an event is a function of where the market is when the event occurs. Right now, the market, is assuming Donald Trump is re-elected. If it looks like Elizabeth Warren is a credible, or Bernie Sanders, is a credible opponent to Trump, the market will not be higher. It’ll be lower.
President Trump would likely relish the opportunity to run against “Pocahontas.” But such a matchup would make many on Wall Street nervous.
Wise investors will make sure they have their hedges in place well in advance of Election Day!
Well now, without further delay, let’s get right to our exclusive interview with a business icon.
Mike Gleason: It is my great privilege now to be joined by Steve Forbes, Editor-in-Chief of Forbes Magazine, CEO of Forbes Media, and author of many fabulous books, including Flat Tax Revolution, How Capitalism Will Save Us, and Money: How the Destruction of the Dollar Threatens the Global Economy and What We Can Do About It. He’s also a two-time presidential candidate, having run in the Republican primaries in both 1996 and in the year 2000.
Mr. Forbes, I really want to thank you for your time today and for joining us again. It’s a tremendous honor to have you back on, welcome.
Steve Forbes: Good to be with you. Thank you.
Mike Gleason: Well, let’s start with one of the big topics on Wall Street these days, that being tariffs and trade. The president has been working to rewrite trade deals and reduce the trade deficit. Recently, the dispute with China escalated and tariffs were increased to 25%. There has been some volatility in the equity markets, but so far, at least, investors seem to be optimistic that a deal will be reached, or perhaps trade tensions don’t matter as much as they should, because the Federal Reserve is already signaling they will ride to the rescue.
Do you think the tariffs will be effective, and we wonder if America’s hand is as strong as the president thinks it is, or are people really prepared for much higher prices as the extra costs associated with tariffs get passed along? What are your thoughts there?
Steve Forbes: Well, so far the tariffs have been more of a border skirmish than a real all-out trade war, and the markets are assuming that some sort of agreement will be reached, as you saw in the case of Mexico, you saw in the case of, related to that obviously, NAFTA. If the markets really thought we were going to have a full-scale trade war, you would see it clipped 10, 20% pretty quickly. The thing to keep in mind about tariffs, tariff is another word for sales tax, and so when you put tariffs on, you’re taxing American consumers and American businesses.
In the case of China, there are very real trade abuses, and we should hold them to account for it. We really haven’t done so consistently in the past, and I think that by going after specific companies as we now did with the CFO of Huawei, or specific abusers, we almost could have taken a company called ZTE, a major Chinese telecom company, we could’ve knocked them out, if we’d denied them parts from Qualcomm. President Trump chose not to cut them off, even though they once before had engaged in abusive practices. He got no credit for it, but if you knock a company like that out, or take a bank that does anything overseas, this so-called SWIFT system of international payments, you would decapitate that bank.
So I think going after specific abusers, and if we have to update the WTO, World Trade Organization, so we get these things resolved far more quickly and not have the loopholes we have now, that countries like China take advantage of, I think we can move forward. But one of the things we should do vis-a-vis China is unite with our European allies and Japan and Canada and Mexico and others, because they suffer the same thing in China. If you present a united front, the Chinese would hate that, but they would respond very, very quickly.
Mike Gleason: A lot of gold has been flowing from West to East in recent years. That trend seems to have accelerated lately. The U.S. has certainly been more and more aggressive at using the dollar and the U.S. financial system as sort of a weapon. Nations that don’t toe the line are threatened with loss of access. This has even included strong allies like Europe. We wonder if this movement of gold to the East another side of nations working to end the U.S. dollar hegemony in trade. What do you make of the growing central bank gold reserves, particularly in the East?
Steve Forbes: Well, the dollar is the currency of the world, just out of convenience and the size and importance of the U.S. economy. Our capital markets, for example, are much broader, deeper, sophisticated than those of any other country. In Europe, for example, most of their capital still comes from large banks, one reason why they don’t have the vibrant smaller company sector that we traditionally have had in the U.S. But the flow of gold to Asia, part of that is hedging, and part of it too is, I wouldn’t be surprised if one of those countries doesn’t move towards more of a gold-based standard, monetary system.
Just the other day, the prime minister of Malaysia proposed a gold standard as a way of replacing the dollar, having gold-backed currency. If China did it, that would be an enormous change. And so I think, one, they want the gold just as a hedge, but two, I think one of them may have the idea of going to a new gold-based monetary system, which would be good. The dollar needs the competition.
Mike Gleason: On that note, there’s been a tremendous amount of gold flowing from western vaults to eastern vaults over the last few years. Obviously, Russia is another big accumulator of gold here in recent years. Do you look at that as maybe an issue of national security in the long run, where we’re losing a lot of our gold to these other nations?
Steve Forbes: It doesn’t really matter who holds the gold. It’s a broad international market. Every ounce of gold that’s been mined is still with us on Earth somewhere. And the national security comes from not somebody holding some gold but from the fact that we haven’t learned yet, even though we once knew how to do it, of a stable dollar, strong, stable dollar, which would be tying it to gold as we did under a gold standard right up until the 1970s. We did it for 180 years, and it worked pretty well. So the threat is an unstable currency, not who owns particular pieces of gold.
Mike Gleason: The fact that there’s really no currency left in the world that’s not fiat, obviously you talked about Malaysia talking about maybe doing some sort of a gold-backed currency there, but for the most part, we live in a world of fiat currency. Has that really allowed the U.S. dollar to last as long as it has, just because you’re not talking about nations that have a true gold-backed currency. Everybody’s playing the same game.
Steve Forbes: They are, and the dollar wins out, just because of the U.S. economy and our markets and the convenience of denominating commodities into a single currency. But the U.S. would be far better off if it did what it did for most of its existence until the 1970s, and that is a stable gold-backed dollar. And there are various ways you can do a gold standard. We outline them in the book Money, which you mentioned, and also Reviving America also lays it out, very simple way to do it.
Gold is like a measuring rod, a ruler. It just measures value. It’s not using gold coins to buy stuff at Walmart. It’s like 12 inches in a foot or 60 minutes in an hour. And it’s worked for 4,000 years when people have done it and done it right. Again, in terms of the currency, we once knew how to do it. I think we can learn quickly how to do it again. If not, I’ll be glad to show them in my books. That’s the threat, is we have an unstable dollar, because it hurts us and the world.
Mike Gleason: U.S. Congressman Alex Mooney of West Virginia recently introduced a bill in Congress to eliminate capital gains related to sales of gold and silver. Give us your thoughts on that bill and the IRS rule that not only taxes nominal gains on metals, which the Constitution says is money, we should remind everyone, but does so at a discriminatory rate by lumping them in at the 28% collectibles rate. You’ve written on the general topic of taxation on gold. Share your comments on that subject, if you would.
Steve Forbes: Well, if you buy, say, 10 $1 bills for a $10 bill, you would be very surprised if the government said, “Oh, you should pay sales tax on that purchase,” or something like that. So, what should be done is the capital gains levy should be eliminated anyway on all things, and it should be eliminated certainly on gold and perhaps sliver as well, because it hurts having an alternative currency. Governments like to have monopolies, but the best way to have governments behave themselves is by people having an alternative. I’m surprised the cryptocurrency world hasn’t come up with a stable cryptocurrency, but in the meantime, gold should not be subjected to capital gains tax. It should not be subjected to sales taxes, any more than buying 20 $1 bills should be subjected to a sales tax.
Mike Gleason: I’m curious, how do you view gold as an investment? People call it an investment, but it’s really just a different form of savings. After all, gold and silver are money, as the Constitution outlines it. Some also consider it more like an insurance product, financial insurance in a way. How do you view it in terms of an asset class or an investment?
Steve Forbes: Gold is an insurance policy. And you should have it, because you never know what our political leaders are going to do. Whether you’re comfortable with 5%, 10%, pick a number, but it should be there, even though people say well, other assets have done better over time. Well, that’s just a reflection of currency fluctuations. Gold keeps its intrinsic value better than anything else. When you see the nominal price change, that’s not the value of gold changing, that’s the value of the dollar or whatever currency you’re talking about, changing in value. Gold is the constant, like the North Star. Yes, you should have it, a piece of it, just for peace of mind.
Mike Gleason: Yeah, well put. Let’s change gears and talk about Fed policy for a moment. The central bank put additional rate hikes on pause late last year, which was their response to falling stock prices and pressure from the Trump administration. Now stock prices have recovered. Unemployment remains very low, and price inflation is rather low, at least for the moment, yet the Fed is signaling rate cuts are on the way. It looks like they’ve been caught in a tricky situation here. Yield curves have inverted, the Fed funds rate for overnight lending is higher than both the 2-year and the 10-year Treasury yield. Where do you think the FOMC is headed on rates, and what do you think it will mean for U.S. markets, including precious metals?
Steve Forbes: Well, the Fed should not be in the business of fooling around with interest rates. Remember, “interest rate” is another word for rent. When you go and borrow money, you’re in effect renting the money. You pay a price for it. In this case, they call it interest. When you rent an apartment, they call it a rent payment. But it’s rent, and controlling the price of money, borrowing money, just leads to mischief. It’s only a question of how much mischief are you going to do? So, I don’t think that the Fed should be in the business of trying to control the economy, but it does and will.
It never works the way they think it’ll work. You read their forecasts for the last 15, 20 years, a monkey throwing darts at a dartboard would have a better success record than they’ve had, and you don’t have to pay the monkey’s tuition at the university. The Fed should just stand on the side, keep the dollar stable, otherwise go home early.
Mike Gleason: One other thing that I’ve heard you say the Fed shouldn’t be doing, in fact you said it on this podcast three and a half years ago when we had you on last, is that they should not be having this inflation target. You called it a travesty that they’ve somehow decided that our dollar should lose 2% in purchasing power every year. Comment on that again for our listeners that maybe didn’t hear that.
Steve Forbes: Well, the Fed worships this theory called the Phillips curve, which posits that there’s a trade-off between inflation and unemployment, that if you have high unemployment, you will have low inflation. Or if you have low unemployment, that means you have to accept high inflation. There have been at least seven Nobel-winning economists who say that’s junk. You have the current reality. We don’t have very much inflation, and we have very low unemployment rates. So how do they square that circle? The answer is, they don’t. They blame the weather or something.
But it just goes to show that the Fed will hold on, like any agency will, to an obsolete theory, because they aren’t subject to free market forces. The Phillips curve is nonsense, but the Fed believes that prosperity causes inflation. So, the word you should always watch out for, especially if the economy starts to really do well – and we’re going to have a slower second quarter – but if the economy is really doing well, which I think it would really boom, far better than what it’s already doing, if we got rid of these trade uncertainties. But the word you have to watch out for is the word “overheat”. The Fed will start talking about the economy “overheating”, as if the economy was a machine in your automobile. Well, it isn’t. The economy is made up of individuals, 330 million in this country, seven billion around the world, and just ask yourself this question. Do you feel yourself overheating, getting a temperature if your income goes up?
Mike Gleason: Yeah, interesting thought there, certainly. In terms of precious metals, if we have an inflationary environment, if the Fed does get the inflation that they’re looking for, what is your outlook for precious metals over, say, the medium to long term?
Steve Forbes: Well, it’s very basic. Here you can really plot a curve. When a central bank undermines the integrity of its currency, hard asset prices go up. Precious metals have been doing that for long before any of us were born, or even our ancestors. We know it’s going to happen. That’s why you have a little bit as an insurance policy. These people don’t know better.
Mike Gleason: Now, we can’t let you go without asking you about presidential politics. As people know, you were a candidate for president two times, so you know a thing or two about the subject. Now the 2020 campaign promises to be interesting, to say the least. It seems to us that Trump is in the driver’s seat here. Nobody too credible has emerged on the left to challenge him. But one Achilles heel is the U.S. economy. If we fall into a significant recession before 2020, Trump could be held responsible. We would love to get your thoughts on Trump’s chances for reelection, at least as things stand now. What do you think there?
Steve Forbes: Well, if the economy does well, and it would if we got rid of these trade uncertainties – it’s already doing splendidly now, but you always worry about the future, business investment, a lot of it’s been put on hold until we learn the rules of the road on the trade front – but if these trade disputes were resolved or put off indefinitely, you’d see the economy do extremely well, even better than it is now. And for reelection purposes, that’s pretty hard to beat, and Trump would make that, I think, his key issue, in effect saying, “Do you trust these guys? Here we have a good economy. Why put it in jeopardy?”
Mike Gleason: Well, we’ll leave it there. Mr. Forbes, I can’t thank you enough for your fantastic insights and for being so generous with your time. It was a real pleasure, and we wish continued success to you and Forbes Magazine and Forbes Media. I just want to thank you for everything you do for the causes of freedom, capitalism, and liberty. And thanks so much for joining us again. Take care.
Steve Forbes: Thank you. Have a good one.
Mike Gleason: Well, that will do it for this week. Thanks again to Steve Forbes, CEO of Forbes Media, Editor-in-Chief of Forbes Magazine, and author of many bestselling books, and a true business icon.
And don’t forget to check back here next Friday for our next Weekly Market Wrap Podcast. Until then, this has been Mike Gleason with Money Metals Exchange, thanks for listening, and have a great weekend, everybody.
The Money Metals News Service provides market news and crisp commentary for investors following the precious metals markets.
Here are the latest links to our coverage of the Commitment of Traders data changes.
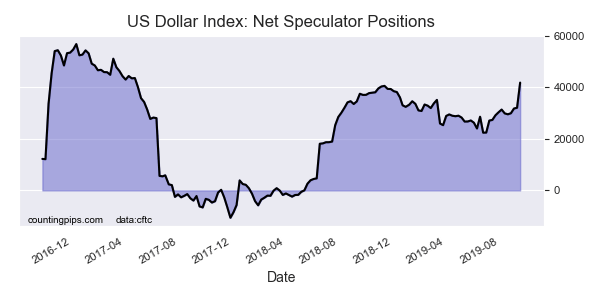
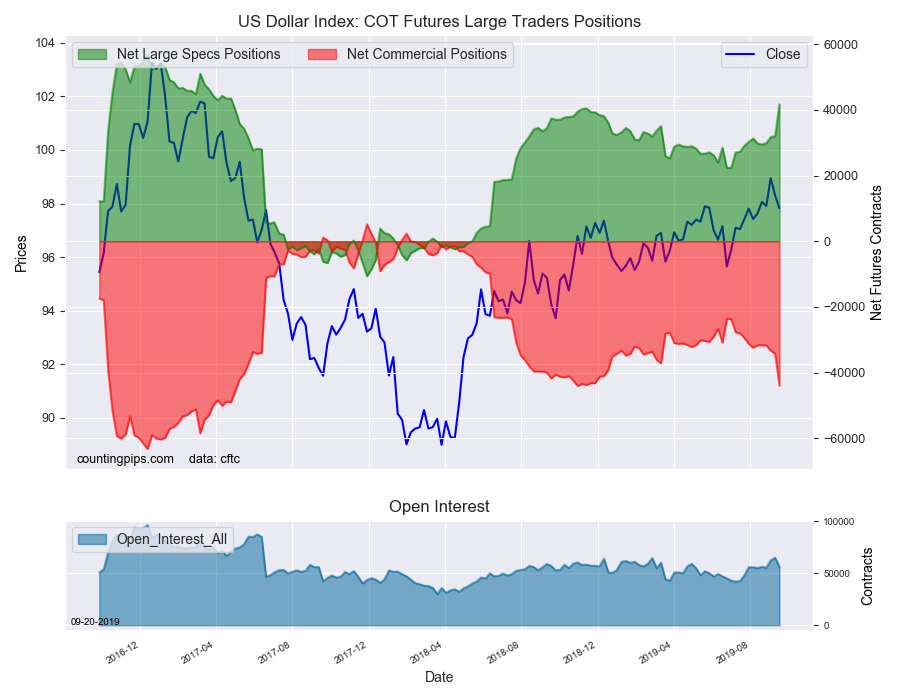
This week in the COT data, currency speculators sharply raised their US Dollar Index bullish positions for a 4th straight week and pushed the USD position to the highest level since April 25th of 2017.
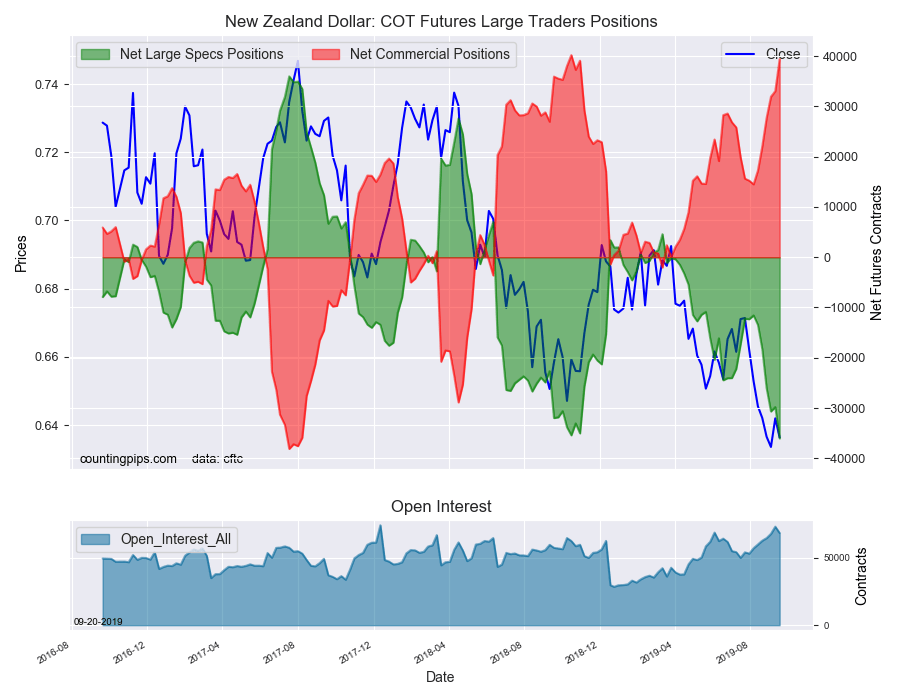
Speculators decreased their New Zealand dollar positions for the fifth time in six weeks and boosted their bets to a new all-time record bearish level. The NZD has now been in short territory for 27 weeks.
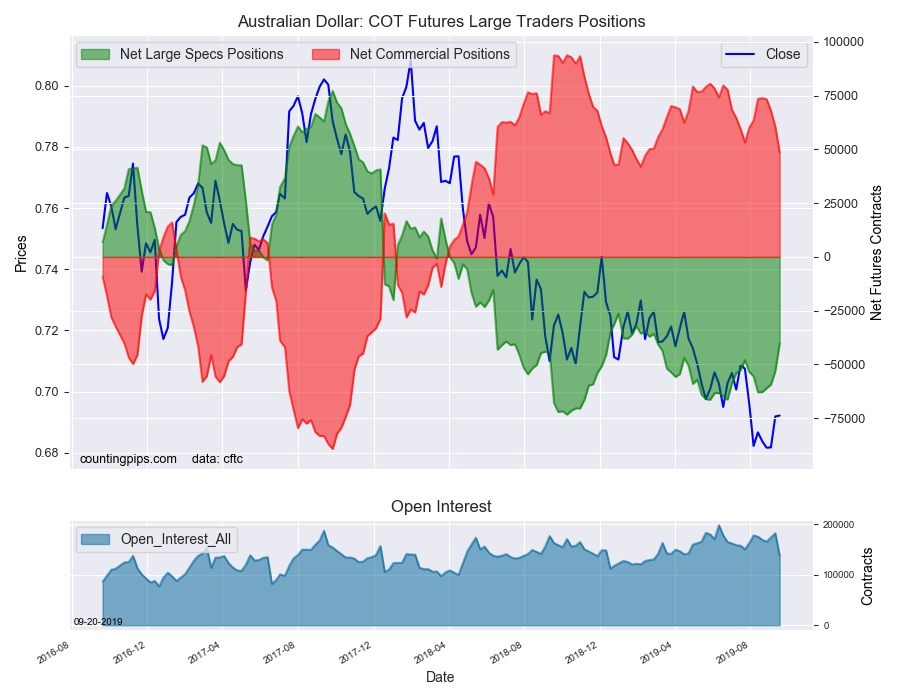
Australian dollar positions, on the other hand, improved for the fifth straight week and rose by over +12,000 contracts. Euro positions dropped again this week by over -18,000 contracts, falling for a 4th straight week and now are at the most bearish level since June.
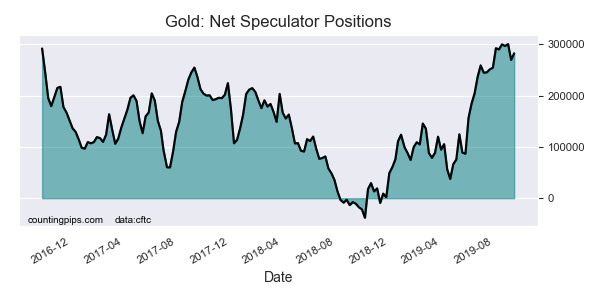
Precious metals speculators raised their Gold bullish positions higher after a sharp pullback last week. Two weeks ago, bullish bets rose above the +300,000 net contract level for the first time in just about 3 years.
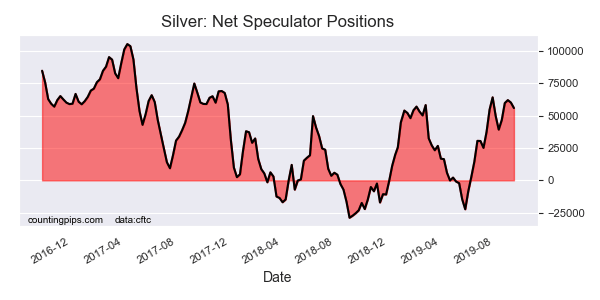
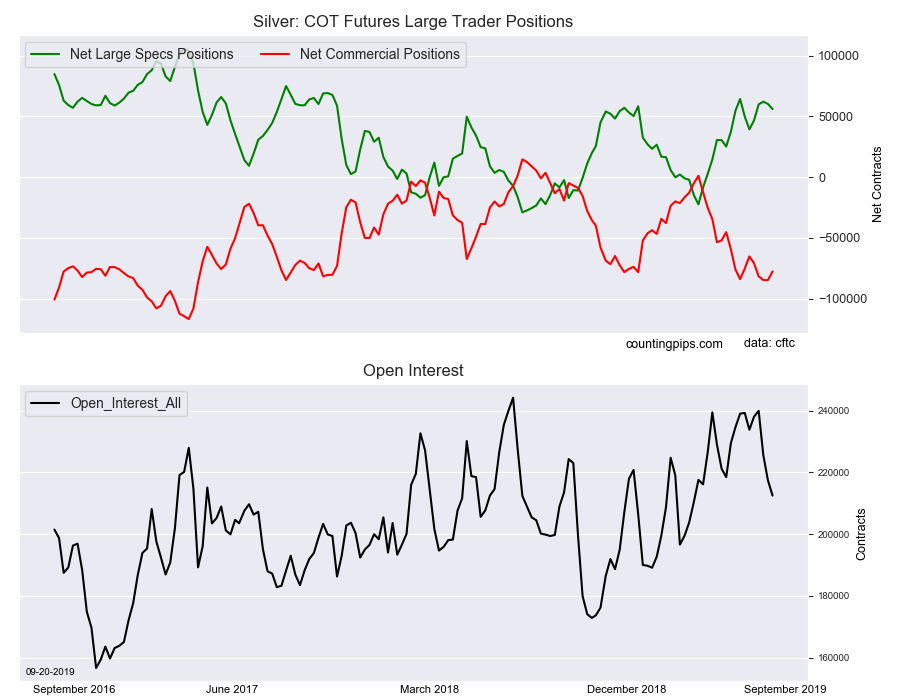
Silver speculator betsdipped slightly again this week after rising in the previous 3 weeks. The silver position, despite the recent pullbacks, remains over the +50,000 net contract level for a 4th straight week.
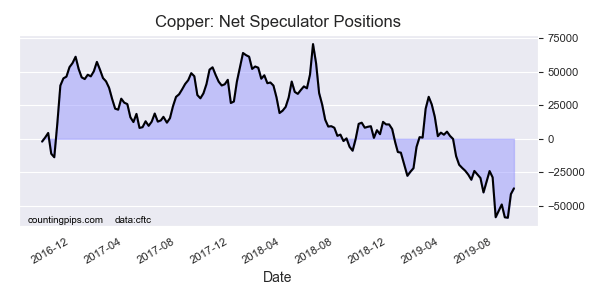
Copper speculators decreased their bearish positions for a second week this week after previously recording a new all-time record high bearish position on September 3rd.
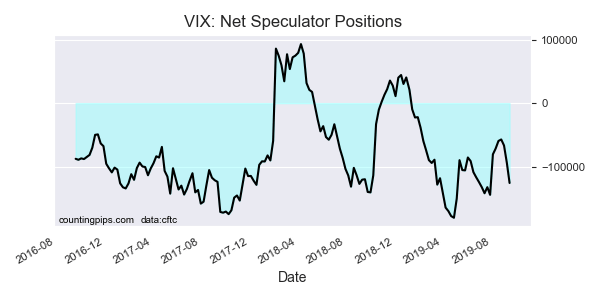
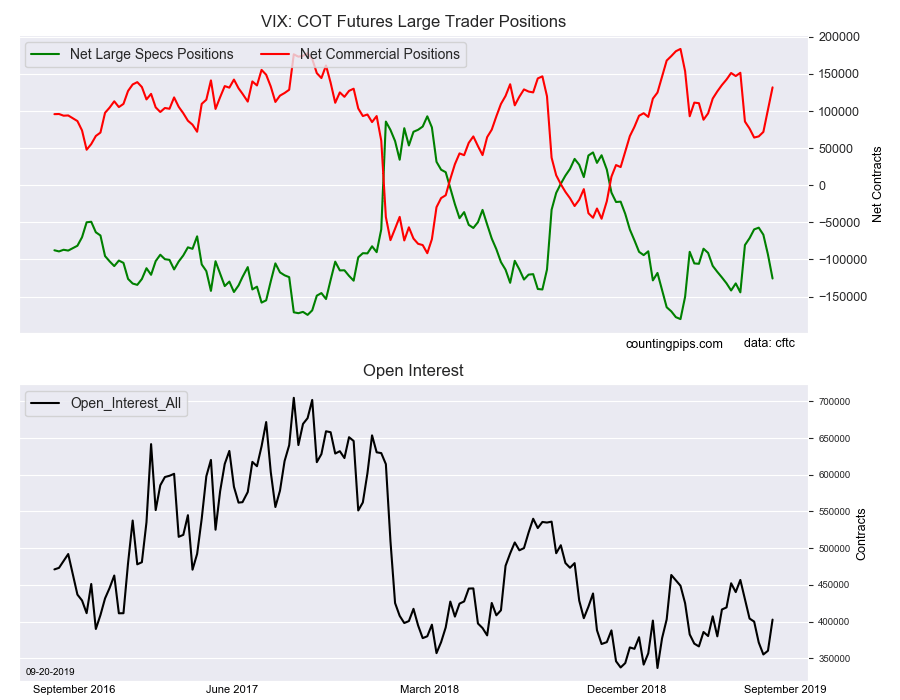
VIX speculators are continuing to build back their bearish positions and sharply added bearish bets to their overall net position. This week saw -32,222 contracts added to the bearish level and the VIX spec position is at the most bearish level since July 30th.
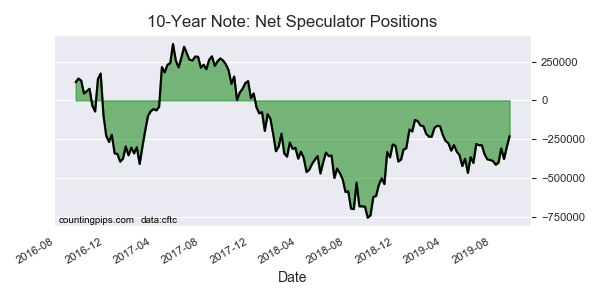
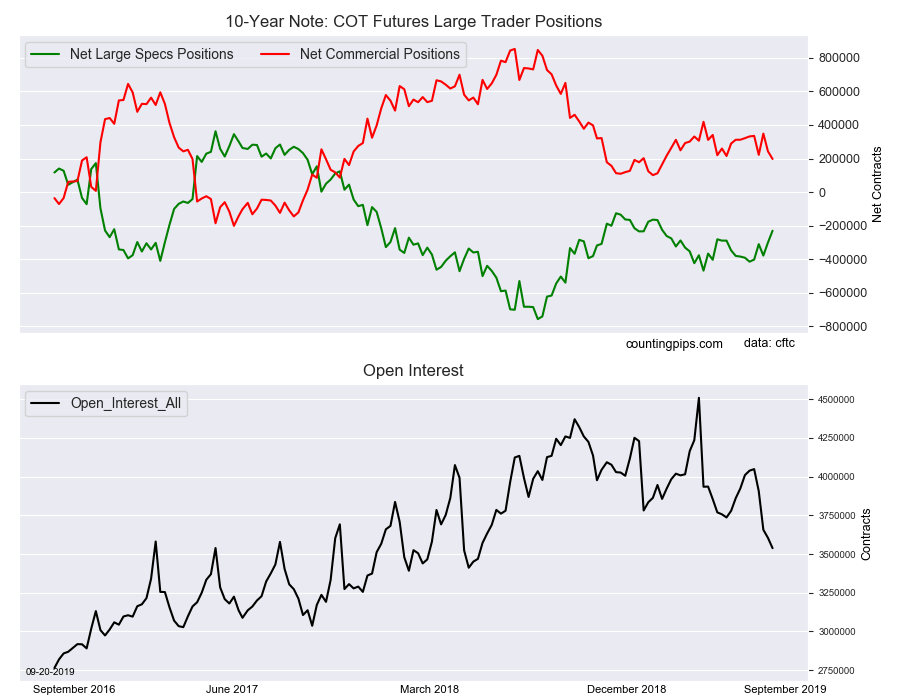
The 10-Year Bond speculators once again decreased their bearish bets this week for the 4th time out of the past 5 weeks. Specs have dropped their bearish positions by over 70,000 contracts in each of the past two weeks.
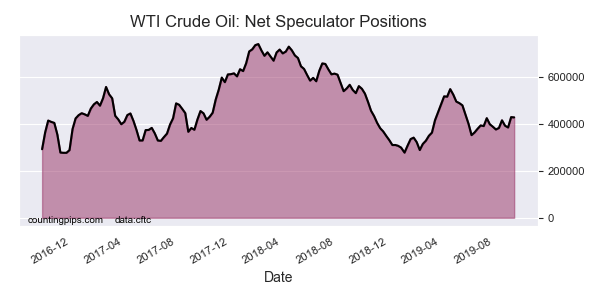
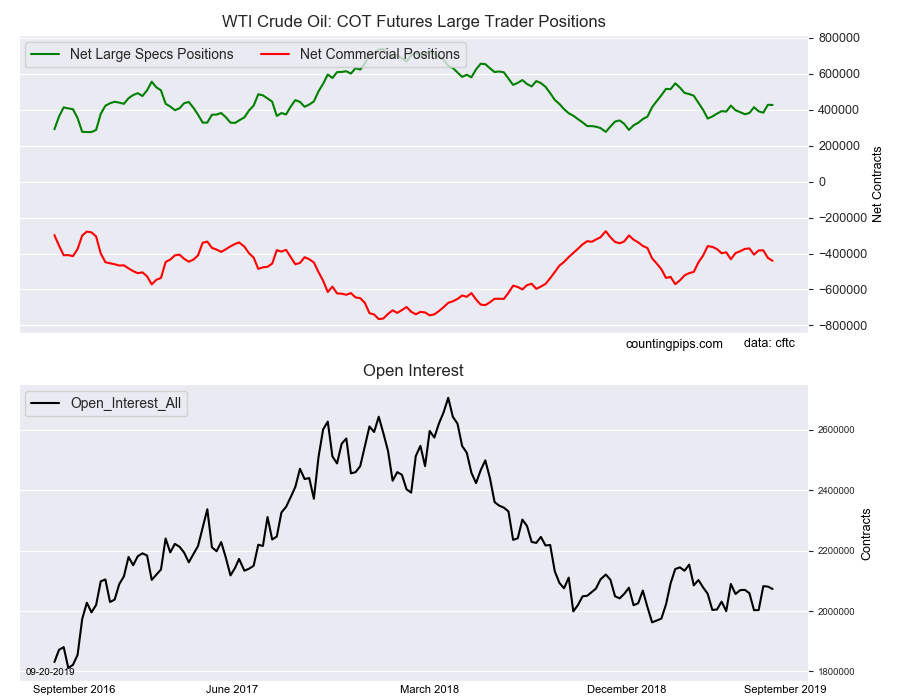
Lastly, the WTI Crude Oil speculators very slightly trimmed their bullish bets this week following last week’s strong gain (the most in 25 weeks). Crude bets have now totaled more than +400,000 contracts for a second straight week.
Large currency speculators boosted their net positions in the US Dollar Index futures markets this week, according to the latest Commitment of Traders (COT) data released by the Commodity Futures Trading Commission (CFTC) on Friday. See full article.
The large speculator contracts of WTI crude futures totaled a net position of 427,105 contracts, according to the latest data this week. This was a change of -1,100 contracts from the previous weekly total. See full article.
Large speculator contracts of the 10-Year Bond futures totaled a net position of -229,963 contracts, according to the latest data this week. This was a change of 70,470 contracts from the previous weekly total. See full article.
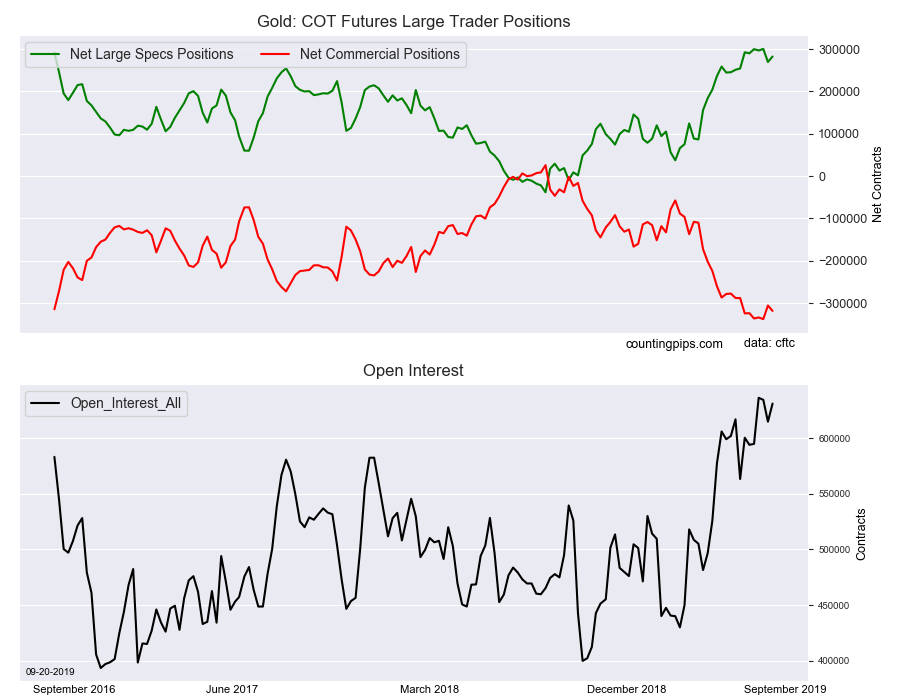
Large precious metals speculator contracts of the Gold futures totaled a net position of 282,599 contracts, according to the latest data this week. This was a change of 12,874 contracts from the previous weekly total. See full article.
Large stock market volatility speculator contracts of the VIX futures totaled a net position of -125,651 contracts, according to the latest data this week. This was a change of -32,222 contracts from the previous weekly total. See full article.
Large precious metals speculator contracts of the silver futures totaled a net position of 55,978 contracts, according to the latest data this week. This was a change of -4,253 contracts from the previous weekly total. See full article.
Metals speculator contracts of the copper futures totaled a net position of -36,950 contracts, according to the latest data this week. This was a change of 4,236 contracts from the previous weekly total. See full article.
*COT Report: The COT data, released weekly to the public each Friday, is updated through the most recent Tuesday (data is 3 days old) and shows a quick view of how large speculators or non-commercials (for-profit traders) were positioned in the futures markets.
The CFTC categorizes trader positions according to commercial hedgers (traders who use futures contracts for hedging as part of the business), non-commercials (large traders who speculate to realize trading profits) and nonreportable traders (usually small traders/speculators).
Large currency speculators sharply increased their net bullish positions in the US Dollar Index futures markets again this week while New Zealand dollar traders pushed bets to a record bearish level, according to the latest Commitment of Traders (COT) data released by the Commodity Futures Trading Commission (CFTC) on Friday.
The non-commercial futures contracts of US Dollar Index futures, traded by large speculators and hedge funds, totaled a net position of 41,774 contracts in the data reported through Tuesday September 17th. This was a weekly gain of 9,742 contracts from the previous week which had a total of 32,032 net contracts.
This week’s net position was the result of the gross bullish position (longs) rising by just 143 contracts (to a weekly total of 49,626 contracts) while the gross bearish position (shorts) dropped sharply by -9,599 contracts on the week (to a total of 7,852 contracts).
The US Dollar Index speculators boosted net positions by the largest one-week amount since June 19th of 2018, which is a span of sixty-five weeks. Dollar bets have now gained for ten out of the past twelve weeks and this week’s jump puts the current dollar standing at the most bullish level since April 25th of 2017.
Individual Currencies Data this week:
In the other major currency contracts data, we saw three substantial changes (+ or – 10,000 contracts) in the speculators category and three others very close to that level as well this week.
New Zealand dollar speculator positions did not drop by over 10,000 contracts this week but did manage to hit a record high bearish level at over -36,000 contracts. This eclipses the previous record of -35,412 contracts on October 16th of 2018. The NZD bets have fallen in five out of the last six weeks and have now been in an overall bearish position for twenty-seven consecutive weeks.
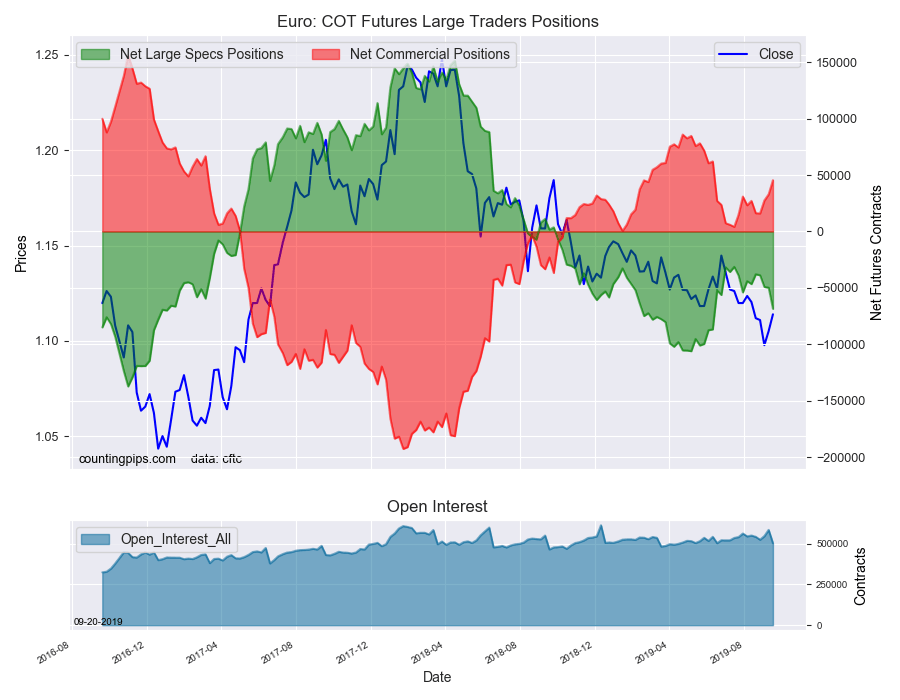
Euro positions dropped sharply this week by over -18,000 contracts and fell for a fourth consecutive week. The euro net position is now at the most bearish level since June 11th. Overall, the euro speculative level has been in bearish territory for 51 straight weeks.
Australian dollar bets improved sharply this week by over +12,000 contracts and have now improved for five straight weeks. The recent rise in sentiment has brought the overall net position to the least bearish level since February 26th.
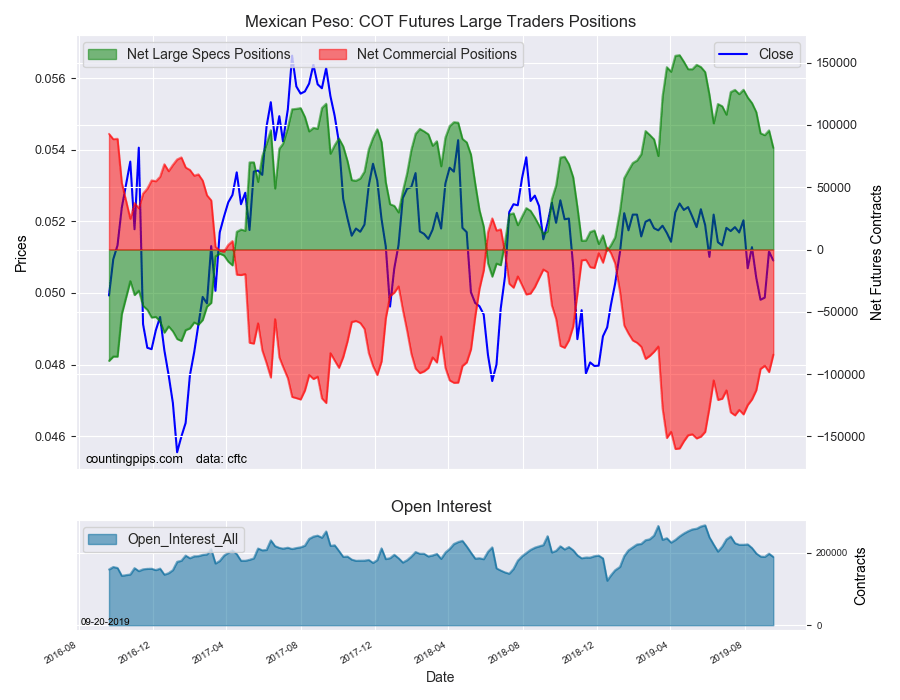
Mexican peso bets dropped this week by over -14,000 net contracts and fell for the sixth time out of the past seven weeks. The peso speculative position has continued on a slow decline in recent weeks and months after reaching an all-time record high of +156,030 contracts on April 16th.
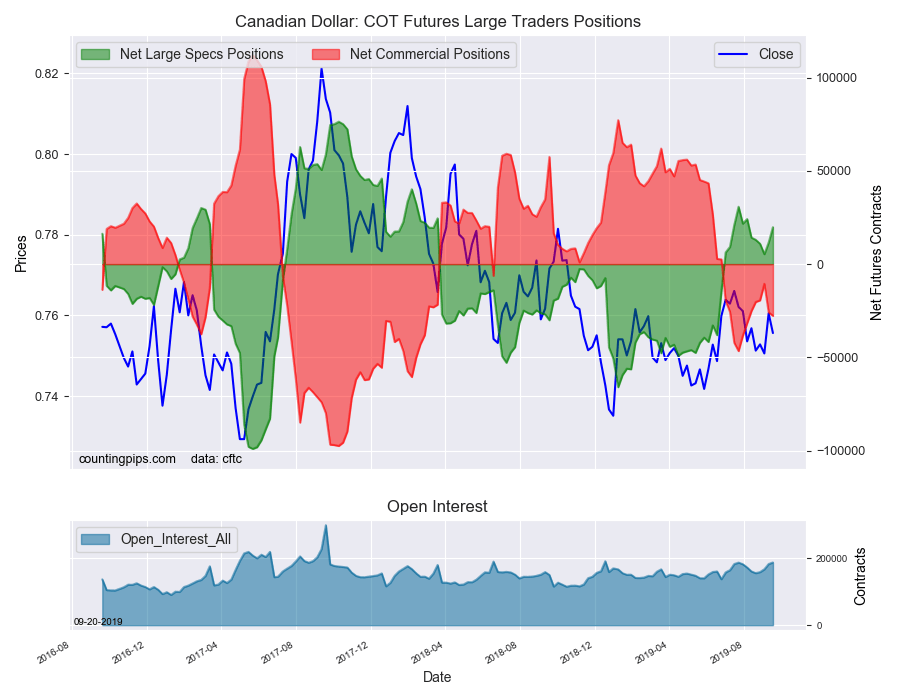
Overall, the major currencies that saw improving speculator positions this week were the US dollar index (9,742 weekly change in contracts), British pound sterling (6,109 contracts), Canadian dollar (8,300 contracts) and the Australian dollar (12,932 contracts).
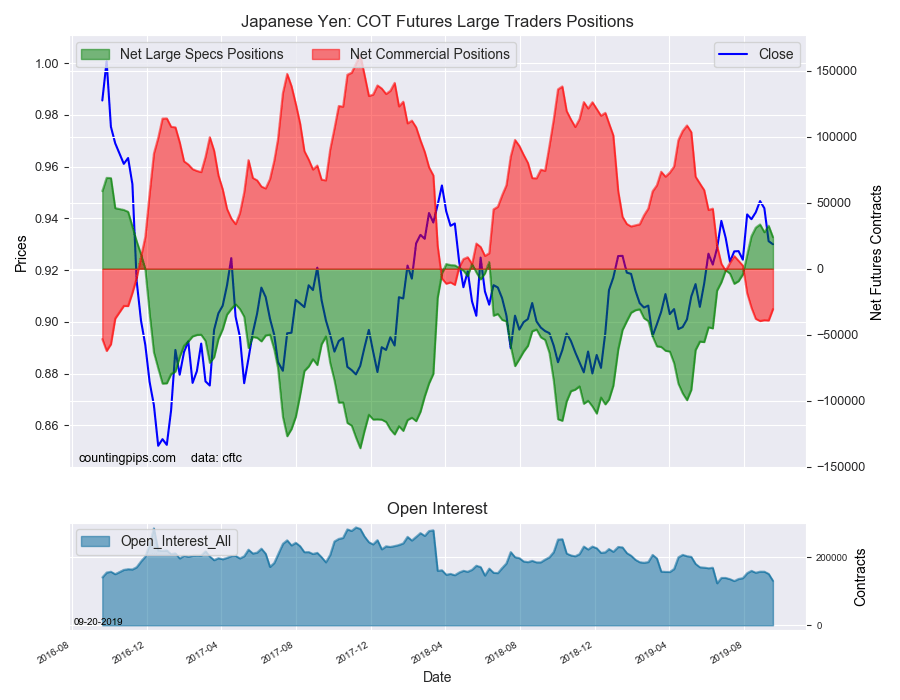
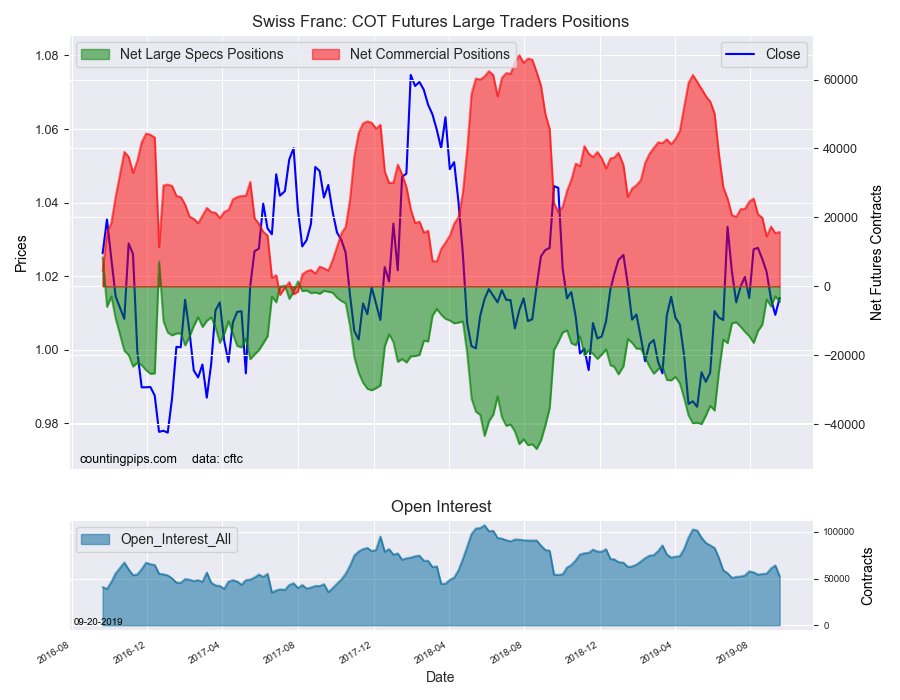
The currencies whose speculative bets declined this week were the euro (-18,717 weekly change in contracts), Japanese yen (-8,729 contracts), Swiss franc (-1,664 contracts), New Zealand dollar (-6,253 contracts) and the Mexican peso (-14,011 contracts).
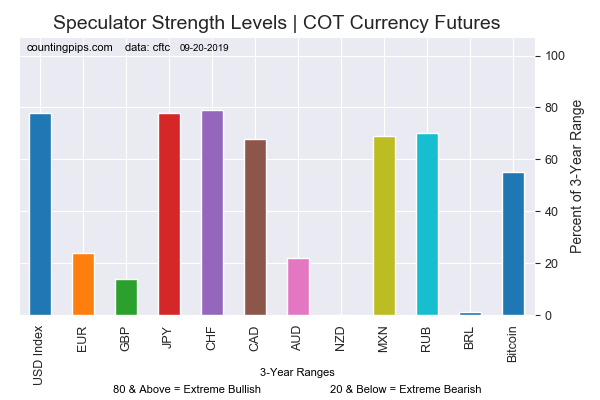
Chart: Current Strength of Each Currency compared to their 3-Year Range
See table and individual currency charts below.
Table of Large Speculator Levels & Weekly Changes:
Currency
Net Speculator Position
Specs Weekly Change
USD Index
41,774
9,742
EuroFx
-68,559
-18,717
GBP
-86,124
6,109
JPY
23,862
-8,729
CHF
-4,556
-1,664
CAD
19,823
8,300
AUD
-40,082
12,932
NZD
-36,043
-6,253
MXN
81,626
-14,011
This latest COT data is through Tuesday and shows a quick view of how large speculators or non-commercials (for-profit traders) were positioned in the futures markets. All currency positions are in direct relation to the US dollar where, for example, a bet for the euro is a bet that the euro will rise versus the dollar while a bet against the euro will be a bet that the dollar will gain versus the euro.
Weekly Charts: Large Trader Weekly Positions vs Price
EuroFX:
The Euro large speculator standing this week recorded a net position of -68,559 contracts in the data reported through Tuesday. This was a weekly reduction of -18,717 contracts from the previous week which had a total of -49,842 net contracts.
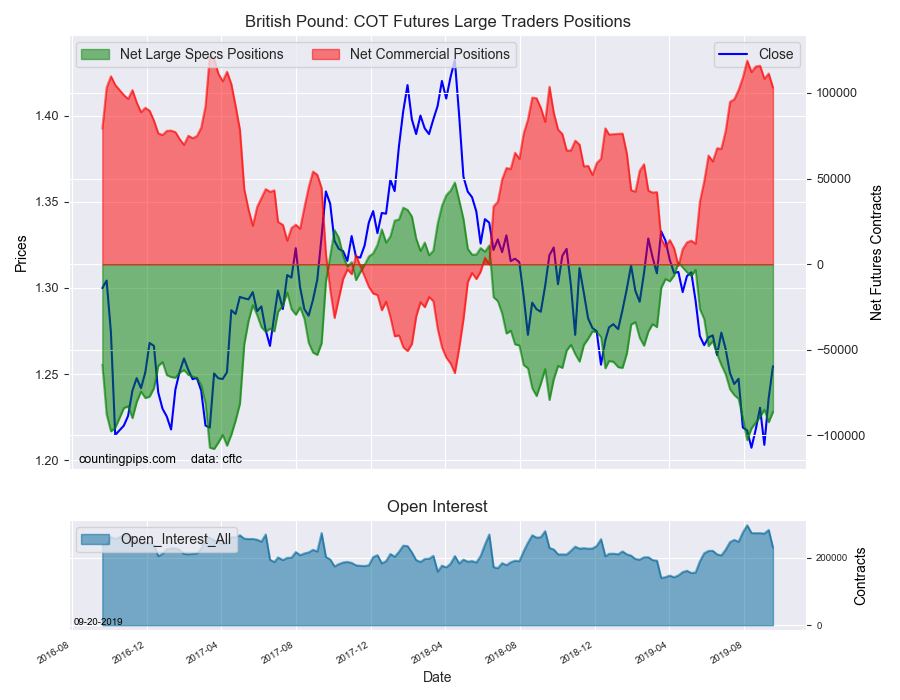
British Pound Sterling:
The large British pound sterling speculator level recorded a net position of -86,124 contracts in the data reported this week. This was a weekly rise of 6,109 contracts from the previous week which had a total of -92,233 net contracts.
Japanese Yen:
Large Japanese yen speculators totaled a net position of 23,862 contracts in this week’s data. This was a weekly decline of -8,729 contracts from the previous week which had a total of 32,591 net contracts.
Swiss Franc:
The Swiss franc speculator standing this week came in at a net position of -4,556 contracts in the data through Tuesday. This was a weekly decline of -1,664 contracts from the previous week which had a total of -2,892 net contracts.
Canadian Dollar:
Canadian dollar speculators equaled a net position of 19,823 contracts this week. This was a advance of 8,300 contracts from the previous week which had a total of 11,523 net contracts.
Australian Dollar:
The large speculator positions in Australian dollar futures was a net position of -40,082 contracts this week in the data ending Tuesday. This was a weekly increase of 12,932 contracts from the previous week which had a total of -53,014 net contracts.
New Zealand Dollar:
The New Zealand dollar speculative standing resulted in a net position of -36,043 contracts this week in the latest COT data. This was a weekly lowering of -6,253 contracts from the previous week which had a total of -29,790 net contracts.
Mexican Peso:
Mexican peso speculators recorded a net position of 81,626 contracts this week. This was a weekly lowering of -14,011 contracts from the previous week which had a total of 95,637 net contracts.
*COT Report: The COT data, released weekly to the public each Friday, is updated through the most recent Tuesday (data is 3 days old) and shows a quick view of how large speculators or non-commercials (for-profit traders) were positioned in the futures markets.
The CFTC categorizes trader positions according to commercial hedgers (traders who use futures contracts for hedging as part of the business), non-commercials (large traders who speculate to realize trading profits) and nonreportable traders (usually small traders/speculators).
Large energy speculators slightly decreased their bullish net positions in the WTI Crude Oil futures markets this week, according to the latest Commitment of Traders (COT) data released by the Commodity Futures Trading Commission (CFTC) on Friday.
The non-commercial futures contracts of WTI Crude Oil futures, traded by large speculators and hedge funds, totaled a net position of 427,105 contracts in the data reported through Tuesday September 17th. This was a weekly dip of -1,100 net contracts from the previous week which had a total of 428,205 net contracts.
The week’s net position was the result of the gross bullish position (longs) increasing by 2,778 contracts (to a weekly total of 530,357 contracts) while the gross bearish position (shorts) rose by a slightly greater amount of 3,878 contracts for the week (to a total of 103,252 contracts).
Speculators trimmed their bullish positions following a sharp jump up in bullish bets last week (+44,048 contract). The speculative position has now declined in three out of the past four weeks. Despite the recent pullbacks and thanks to last week’s bullish surge higher, the overall net position has now been above the +400,000 contract level for two consecutive weeks.
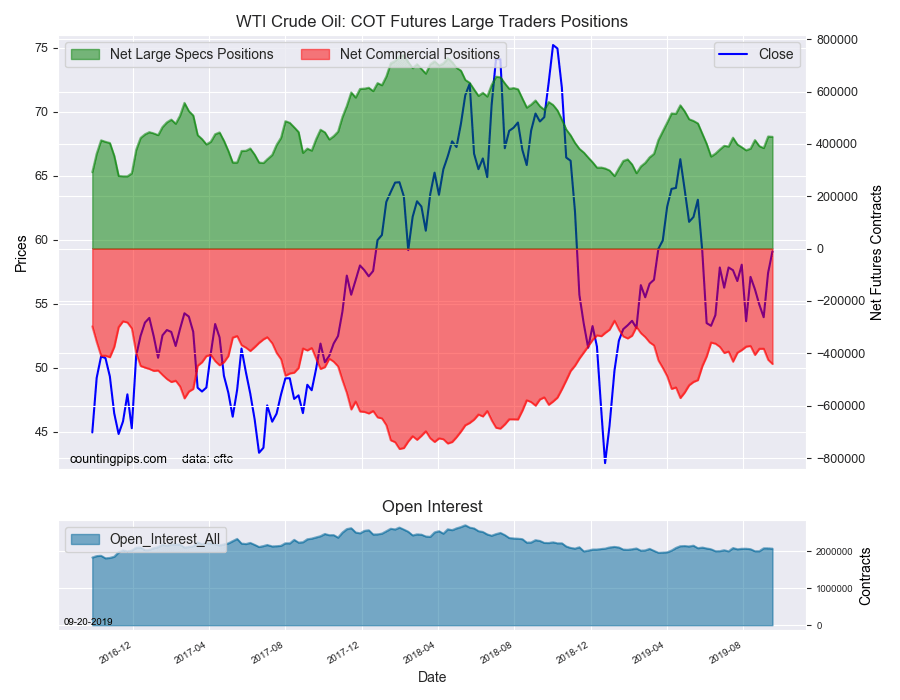
WTI Crude Oil Commercial Positions:
The commercial traders position, hedgers or traders engaged in buying and selling for business purposes, totaled a net position of -440,283 contracts on the week. This was a weekly fall of -16,095 contracts from the total net of -424,188 contracts reported the previous week.
WTI Crude Oil Futures:
Over the same weekly reporting time-frame, from Tuesday to Tuesday, the WTI Crude Oil Futures (Front Month) closed at approximately $59.10 which was an uptick of $1.70 from the previous close of $57.40, according to unofficial market data.
*COT Report: The COT data, released weekly to the public each Friday, is updated through the most recent Tuesday (data is 3 days old) and shows a quick view of how large speculators or non-commercials (for-profit traders) as well as the commercial traders (hedgers & traders for business purposes) were positioned in the futures markets.
The CFTC categorizes trader positions according to commercial hedgers (traders who use futures contracts for hedging as part of the business), non-commercials (large traders who speculate to realize trading profits) and nonreportable traders (usually small traders/speculators).
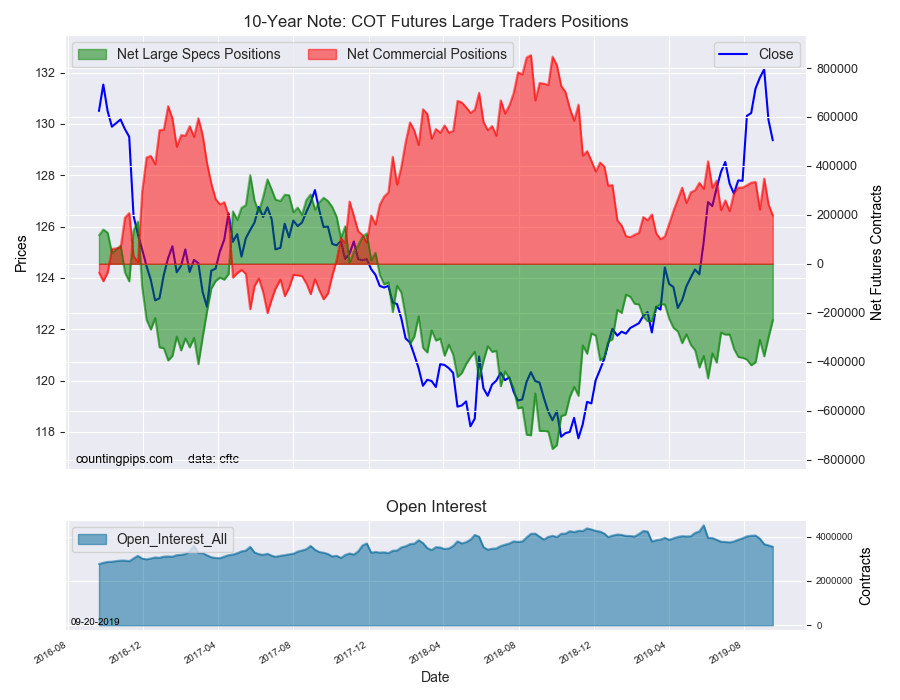
Large bond speculators decreased their bearish net positions in the 10-Year Note futures markets this week, according to the latest Commitment of Traders (COT) data released by the Commodity Futures Trading Commission (CFTC) on Friday.
The non-commercial futures contracts of 10-Year Note futures, traded by large speculators and hedge funds, totaled a net position of -229,963 contracts in the data reported through Tuesday September 17th. This was a weekly change of 70,470 net contracts from the previous week which had a total of -300,433 net contracts.
The week’s net position was the result of the gross bullish position (longs) going up by just 444 contracts (to a weekly total of 623,614 contracts) while the gross bearish position (shorts) dropped by -70,026 contracts for the week (to a total of 853,577 contracts).
The 10-year speculators reduced their bearish positions by over twenty percent this week for a second straight week and by a total of 147,904 net contracts over these past 2 weeks. In fact, the bearish position has also declined in four out of the past five weeks and by a total of 184,383 contracts in that time-frame.
Despite the recent pullbacks, the speculator net position remains in bearish territory although at the least bearish level since April 2nd.
10-Year Note Commercial Positions:
The commercial traders position, hedgers or traders engaged in buying and selling for business purposes, totaled a net position of 197,395 contracts on the week. This was a weekly decline of -45,689 contracts from the total net of 243,084 contracts reported the previous week.
10-Year Note Futures:
Over the same weekly reporting time-frame, from Tuesday to Tuesday, the 10-Year Note Futures (Front Month) closed at approximately $129.35 which was a drop of $-0.79 from the previous close of $130.15, according to unofficial market data.
*COT Report: The COT data, released weekly to the public each Friday, is updated through the most recent Tuesday (data is 3 days old) and shows a quick view of how large speculators or non-commercials (for-profit traders) as well as the commercial traders (hedgers & traders for business purposes) were positioned in the futures markets.
The CFTC categorizes trader positions according to commercial hedgers (traders who use futures contracts for hedging as part of the business), non-commercials (large traders who speculate to realize trading profits) and nonreportable traders (usually small traders/speculators).
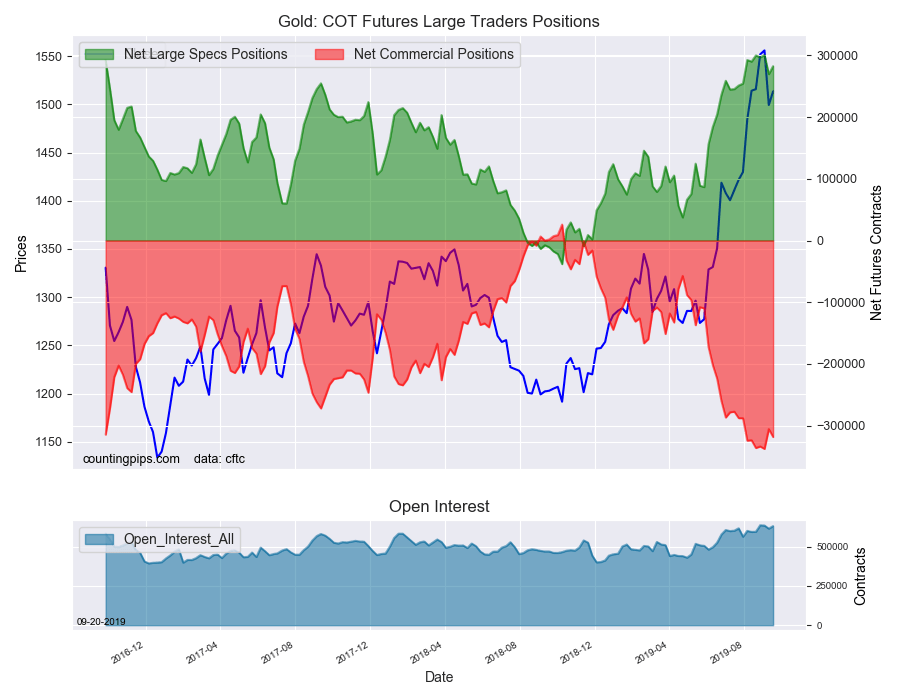
Large precious metals speculators increased their bullish net positions in the Gold futures markets this week, according to the latest Commitment of Traders (COT) data released by the Commodity Futures Trading Commission (CFTC) on Friday.
The non-commercial futures contracts of Gold futures, traded by large speculators and hedge funds, totaled a net position of 282,599 contracts in the data reported through Tuesday September 17th. This was a weekly rise of 12,874 net contracts from the previous week which had a total of 269,725 net contracts.
The week’s net position was the result of the gross bullish position (longs) going up by 7,397 contracts (to a weekly total of 341,511 contracts) while the gross bearish position (shorts) declined by -5,477 contracts for the week (to a total of 58,912 contracts).
Gold speculators boosted their bullish bets this week following a sharp selloff in positions last week (-30,822 contracts). Two weeks ago, bullish bets had risen to over +300,000 net contracts for the first time in approximately three years, dating back to September of 2016. This week’s gain doesn’t quite bring the position back to that level but keeps the net position above the +250,000 net contract threshold for a ninth consecutive week.
Gold Commercial Positions:
The commercial traders position, hedgers or traders engaged in buying and selling for business purposes, totaled a net position of -318,399 contracts on the week. This was a weekly fall of -12,788 contracts from the total net of -305,611 contracts reported the previous week.
Gold Futures:
Over the same weekly reporting time-frame, from Tuesday to Tuesday, the Gold Futures (Front Month) closed at approximately $1513.40 which was a rise of $14.20 from the previous close of $1499.20, according to unofficial market data.
*COT Report: The COT data, released weekly to the public each Friday, is updated through the most recent Tuesday (data is 3 days old) and shows a quick view of how large speculators or non-commercials (for-profit traders) as well as the commercial traders (hedgers & traders for business purposes) were positioned in the futures markets.
The CFTC categorizes trader positions according to commercial hedgers (traders who use futures contracts for hedging as part of the business), non-commercials (large traders who speculate to realize trading profits) and nonreportable traders (usually small traders/speculators).
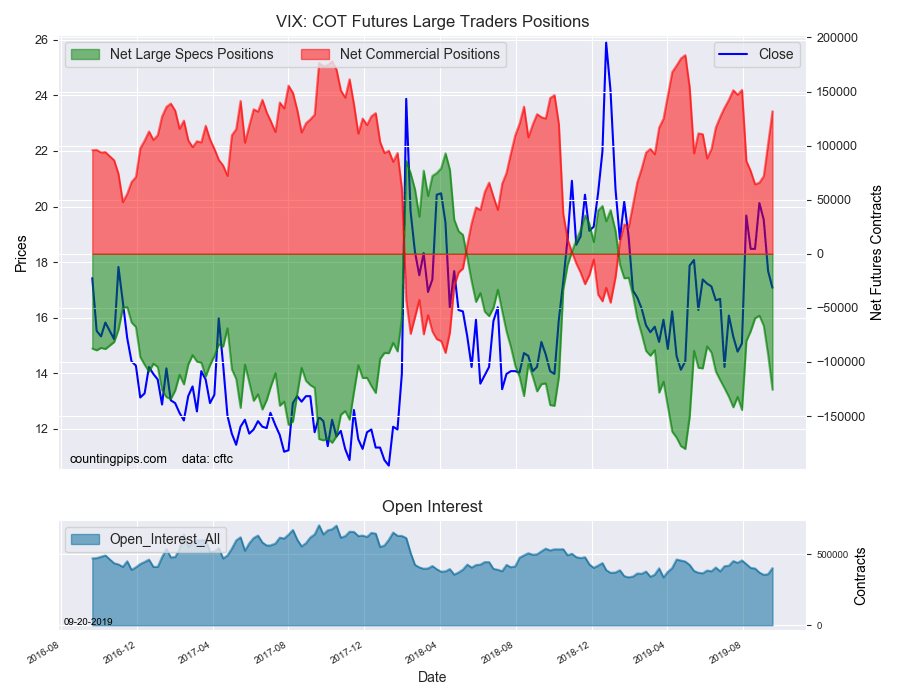
Large volatility speculators continued to raise their bearish net positions in the VIX futures markets again this week, according to the latest Commitment of Traders (COT) data released by the Commodity Futures Trading Commission (CFTC) on Friday.
The non-commercial futures contracts of VIX futures, traded by large speculators and hedge funds, totaled a net position of -125,651 contracts in the data reported through Tuesday September 17th. This was a weekly change of -32,222 net contracts from the previous week which had a total of -93,429 net contracts.
The week’s net position was the result of the gross bullish position (longs) lowering by -10,596 contracts (to a weekly total of 86,088 contracts) while the gross bearish position (shorts) jumped by 21,626 contracts for the week (to a total of 211,739 contracts).
VIX bearish bets jumped again this week as risk has come back in favor in recent weeks. The bearish bets have now risen for three straight weeks and by a total of -68,498 contracts in that time-frame. The current standing is now back over the -100,000 net contract level and is at the most bearish level since July 30th.
VIX Commercial Positions:
The commercial traders position, hedgers or traders engaged in buying and selling for business purposes, totaled a net position of 131,936 contracts on the week. This was a weekly boost of 29,895 contracts from the total net of 102,041 contracts reported the previous week.
VIX Futures:
Over the same weekly reporting time-frame, from Tuesday to Tuesday, the VIX Futures (Front Month) closed at approximately $17.07 which was a decrease of $-0.60 from the previous close of $17.67, according to unofficial market data.
*COT Report: The COT data, released weekly to the public each Friday, is updated through the most recent Tuesday (data is 3 days old) and shows a quick view of how large speculators or non-commercials (for-profit traders) as well as the commercial traders (hedgers & traders for business purposes) were positioned in the futures markets.
The CFTC categorizes trader positions according to commercial hedgers (traders who use futures contracts for hedging as part of the business), non-commercials (large traders who speculate to realize trading profits) and nonreportable traders (usually small traders/speculators).
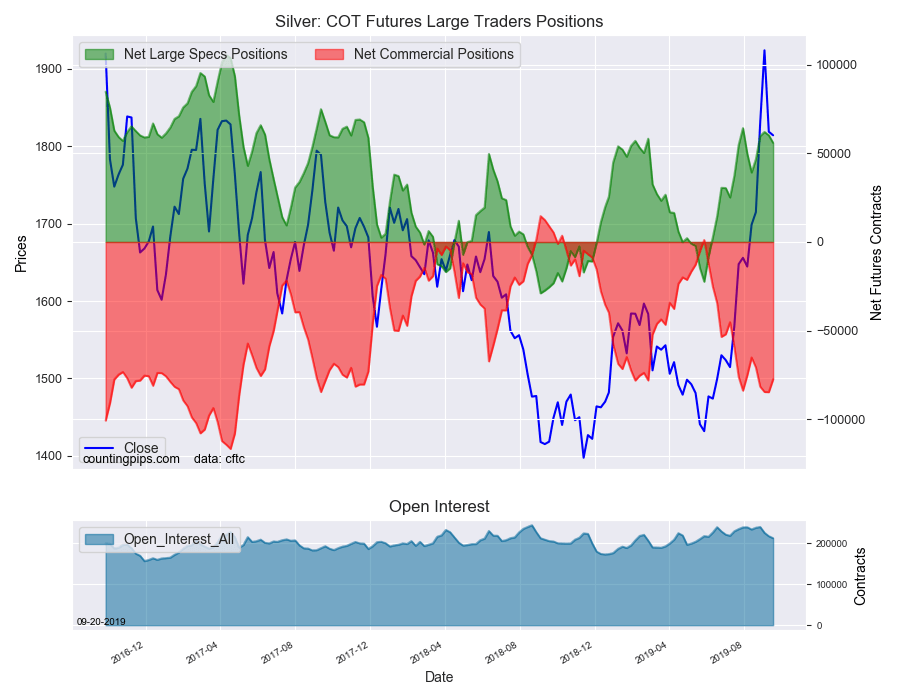
Large precious metals speculators trimmed their net positions in the Silver futures markets this week, according to the latest Commitment of Traders (COT) data released by the Commodity Futures Trading Commission (CFTC) on Friday.
The non-commercial futures contracts of Silver futures, traded by large speculators and hedge funds, totaled a net position of 55,978 contracts in the data reported through Tuesday September 17th. This was a weekly lowering of -4,253 net contracts from the previous week which had a total of 60,231 net contracts.
The week’s net position was the result of the gross bullish position (longs) falling by -5,788 contracts (to a weekly total of 94,625 contracts) while the gross bearish position (shorts) also declined but by a smaller amount of -1,535 contracts for the week (to a total of 38,647 contracts).
Silver speculators slightly reduced their bullish bets for a second week following three straight weeks of increases previously. The current speculator position remains highly bullish and above the +50,000 net contract level for a fourth consecutive week.
Silver Commercial Positions:
The commercial traders position, hedgers or traders engaged in buying and selling for business purposes, totaled a net position of -77,547 contracts on the week. This was a weekly uptick of 7,221 contracts from the total net of -84,768 contracts reported the previous week.
Silver Futures:
Over the same weekly reporting time-frame, from Tuesday to Tuesday, the Silver Futures (Front Month) closed at approximately $1814.00 which was a decline of $-4.60 from the previous close of $1818.60, according to unofficial market data.
*COT Report: The COT data, released weekly to the public each Friday, is updated through the most recent Tuesday (data is 3 days old) and shows a quick view of how large speculators or non-commercials (for-profit traders) as well as the commercial traders (hedgers & traders for business purposes) were positioned in the futures markets.
The CFTC categorizes trader positions according to commercial hedgers (traders who use futures contracts for hedging as part of the business), non-commercials (large traders who speculate to realize trading profits) and nonreportable traders (usually small traders/speculators).