Besides the Reserve Bank of New Zealand’s monetary policy meeting, there aren’t that many market-moving events.
A host of economic reports will, however, keep traders busy. Data includes the final revised GDP figures from the US, including the durable goods orders report and the personal income and spending data.
ECB President Mario Draghi is due to speak mid-week. His scheduled speech comes just two weeks after the ECB restarted its QE program and cut the key deposit rate. For the EURUSD currency pair which has been trading rather flat, this could be an opportunity.
On the geopolitical front, developments on the Saudi oil field attacks and Brexit will likely keep investors on edge.
Here’s a brief look at the key economic events coming up for the week ahead.
Flash PMIs & Draghi Speech to Set the Tone for Euro
Two weeks ago, the European Central Bank announced its fresh stimulus package and key deposit rates. While it will take time for the effects of the monetary policy to see its effects, this week will focus on the flash PMIs for September and Mario Draghi’s speech.
Eurozone Flash PMIs to Remain Sluggish
Forecasts for the manufacturing and services activity for September will be coming out via Markit’s PMI figures.
No big changes are expected. Both manufacturing and services PMI reports are expected to show just a moderate change. However, the eurozone’s manufacturing PMI is expected to tick higher from the decline in August.
Manufacturing activity in the eurozone will still remain in contraction but there are hopes of a modest pickup. Services PMI could, however, rise at a slower pace.
Will Draghi’s Speech Move the Markets?
At this point, it is unsure what topics Draghi will touch upon in his testimony to the European parliament. It is likely, however, that he will be defending his monetary policy action.
There is a good chance that Draghi will stick to the narrative of sluggish growth in the eurozone. It is also possible that the central bank chief, whose term ends in October, will be urging lawmakers to push for fiscal policy changes.
Given that the testimony will be one of the last from the current ECB chief, investors will be closely watching the headlines.
A Somewhat Busy Week for the US
The economic calendar looks a bit busy as far as the USD is concerned. The week ahead will see a mix of economic reports, some stale and some new. Meanwhile, a scheduled speech from FOMC members will also be of interest for investors.
US Final Revised GDP to Remain Unchanged
The final revised GDP figures for the quarter ending June 2019 is due. No changes are expected. The US economy is confirmed to have increased by 2.0% in the second quarter.
Investors will be looking at the more important figures this week. These include the durable goods orders report for August, which are forecast to ease after rising in July.
Personal income and spending data will also shed light on the US consumer. Given that August retail sales were somewhat slower, personal spending is unsurprisingly forecast to slow.
Fed Member Speeches
Following the FOMC meeting last week, various Fed members will be speaking over the course of the week. The line-up includes Williams, Bullard, George, and Clarida.
Following two consecutive weeks of central bank meetings, the RBNZ will be taking the center stage this week.
The central bank will be leaving the official cash rate unchanged at 1.00%. This comes as officials will likely want to buy more time. But the RBNZ could maintain its dovish outlook.
Following the rate cuts this year, the RBNZ looks to be done for the remainder of the year. But a lot will depend on the incoming data over the next few months.
The EUR/USD currency pair continues to trade in a protracted flat. The technical picture is still mixed. The trading instrument is currently consolidating. The local support and resistance levels are 1.09950 and 1.10300, respectively. Today, financial markets participants will evaluate a number of indicators of business activity in the eurozone. These statistics can have a significant impact on the dynamics of the single currency in the short term. We also recommend that you keep track of up-to-date information regarding trade negotiations between the US and China. Positions must be opened from key levels.
The Economic News Feed for 23.09.2019:
– statistics on business activity in Germany and the eurozone – 10:30 (GMT+3:00) and 11:00 (GMT+3:00), respectively;
– data on business activity in the USA – 16:45 (GMT+3:00).
Indicators of accurate signals do not give: 50 MA crossed 100 MA.
The MACD histogram is in the negative zone, but above the signal line, which gives a weak signal to sell EUR / USD.
The Stochastic Oscillator is in the neutral zone, the %K line crossed the %D line. There are no signals at the moment.
Trading recommendations
Support levels: 1.09950, 1.09650, 1.09450
Resistance levels: 1.10300, 1.10650, 1.10850
If the price consolidates above 1.10300, consider buying EUR/USD. The profits should be fixed at 1.10600-1.10800.
Alternatively, the quotes could decrease toward 1.09700-1.09500.
The GBP/USD currency pair
Technical indicators of the currency pair:
Prev Open: 1.25217
Open: 1.24642
% chg. over the last day: -0.38
Day’s range: 1.24430 – 1.24907
52 wk range: 1.1995 – 1.3385
Last week, the pound reached three-month highs against the US dollar thanks to hopes that a hard Brexit could be avoided. European Commission President Jean-Claude Juncker said that the signing of the agreement between London and Brussels is still valid. At the moment, the GBP/USD currency pair has retreated from local highs. The trading instrument is consolidating in the range 1.24450-1.25000. In the near future, technical correction is not ruled out. We recommend opening positions from key levels.
The Economic News Feed for 23.09.2019 is calm.
Indicators do not provide accurate signals, the price crossed 50 MA and 100 MA.
The MACD histogram is in the negative zone and continues to decline, which indicates the correction of the GBP/USD currency pair.
The Stochastic Oscillator is in the neutral zone, the %K line is below the %D line, which also gives a signal to sell GBP/USD.
Trading recommendations
Support levels: 1.24450, 1.24000, 1.23650
Resistance levels: 1.25000, 1.25550, 1.25800
If the price consolidates below 1.24450, expect a correction toward 1.24000.
Alternatively, the quotes could grow toward 1.25400-1.25600.
The USD/CAD currency pair
Technical indicators of the currency pair:
Prev Open: 1.32627
Open: 1.32593
% chg. over the last day: -0.02
Day’s range: 1.32597 – 1.32776
52 wk range: 1.2727 – 1.3664
The technical picture on the USD/CAD currency pair is still ambiguous. CAD is trading in a long flat. At the moment, the following local support and resistance levels can be distinguished: 1.32550 and 1.32900, respectively. Participants in financial markets expect additional drivers. We recommend to pay attention to the dynamics of prices of oil. Positions must be opened from key levels.
At 15:30 (GMT+3:00), Canada will publish a report on wholesale sales.
– Economic Event (CAD) – 00:00 (GMT+3:00);
– Economic Event (CAD) – 00:00 (GMT+3:00);
– Economic Event (CAD) – 00:00 (GMT+3:00);
Indicators do not give accurate signals,the price crossed 50 MA and 100 MA.
The MACD histogram is near 0.
The Stochastic Oscillator is in the neutral zone, the %K line is below the %D line, which gives a signal to sell USD/CAD.
Trading recommendations
Support levels: 1.32550, 1.32350, 1.32100
Resistance levels: 1.32900, 1.33150
If the price consolidates below 1.32550, expect the quotes to fall toward 1.32300-1.32100.
Alternatively, the quotes could grow toward 1.33200-1.33400.
The USD/JPY currency pair
Technical indicators of the currency pair:
Prev Open: 108.013
Open: 107.713
% chg. over the last day: -0.43
Day’s range: 107.607 – 107.753
52 wk range: 104.97 – 114.56
The USD/JPY currency pair went down. The trading tool has updated local lows. At the moment, the safe haven currency is consolidating. Quotes found support at 107.550. 107.850 is a mirror resistance. The USD/JPY currency pair has the potential for further correction after a protracted rally. We recommend that you pay attention to the dynamics of yield on US government bonds. Positions must be opened from key levels.
Today, Japanese financial markets are closed due to the holiday.
– Economic Event (JPY) – 00:00 (GMT+3:00);
– Economic Event (JPY) – 00:00 (GMT+3:00);
– Economic Event (JPY) – 00:00 (GMT+3:00);
Indicators point to the strength of sellers: the price has fixed below 50 MA and 100 MA.
The MACD histogram is in the negative zone, but above the signal line, which gives a weak signal to sell USD/JPY.
The Stochastic Oscillator is in the neutral zone, the %K line crossed the %D line. There are no signals at the moment.
Trading recommendations
Support levels: 107.550, 107.200
Resistance levels: 107.850, 108.100, 108.350
If the price consolidates below 107.550, expect further correction toward 107.300-107.100.
Alternatively, the quotes could grow toward 108.100-108.300.
The US dollar is strengthening against a basket of major currencies. On Friday, the dollar index (#DX) closed in the positive zone (+0.30%). Investors continue to monitor trade negotiations between Washington and Beijing. At the weekend, September 19-20, preliminary meetings between the US and China deputy ministers took place. Beijing, in turn, called the meetings “constructive.” The parties discussed the trade and economic problems of the countries, as well as organizational issues regarding negotiations between the heads of countries in October.
On Thursday, the Bank of England left the key interest rate unchanged at 0.75% per annum, as experts expected. At the same time, officials paid attention to the risks associated with the complex Brexit process and the uncertainty concerning it. However, the British pound has been growing amid investors’ optimism regarding a chance to avoid the “hard” Brexit. On Thursday, Sky News quoted the words by European Commission President, Jean-Claude Juncker, that an agreement between the EU and the UK to avoid a “hard” Brexit could still be reached.
The “black gold” prices have been growing after fall the day before. Currently, futures for the WTI crude oil are testing the $58.40 mark per barrel.
Market Indicators
On Friday, the bearish sentiment was observed in the US stock markets: #SPY (-0.93%), #DIA (-0.80%), #QQQ (-1.06%).
The 10-year US government bonds yield has been declining. At the moment, the indicator is at the level of 1.69-1.70%.
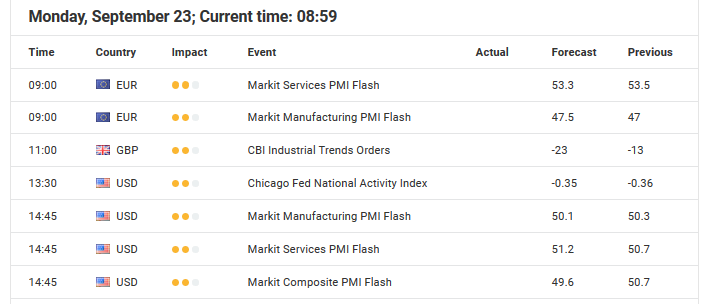
The Economic News Feed for 23.09.2019:
– German manufacturing PMI at 10:30 (GMT+3:00);
– Markit composite PMI in the Eurozone at 11:00 (GMT+3:00);
– Manufacturing PMI in the US at 16:45 (GMT+3:00).
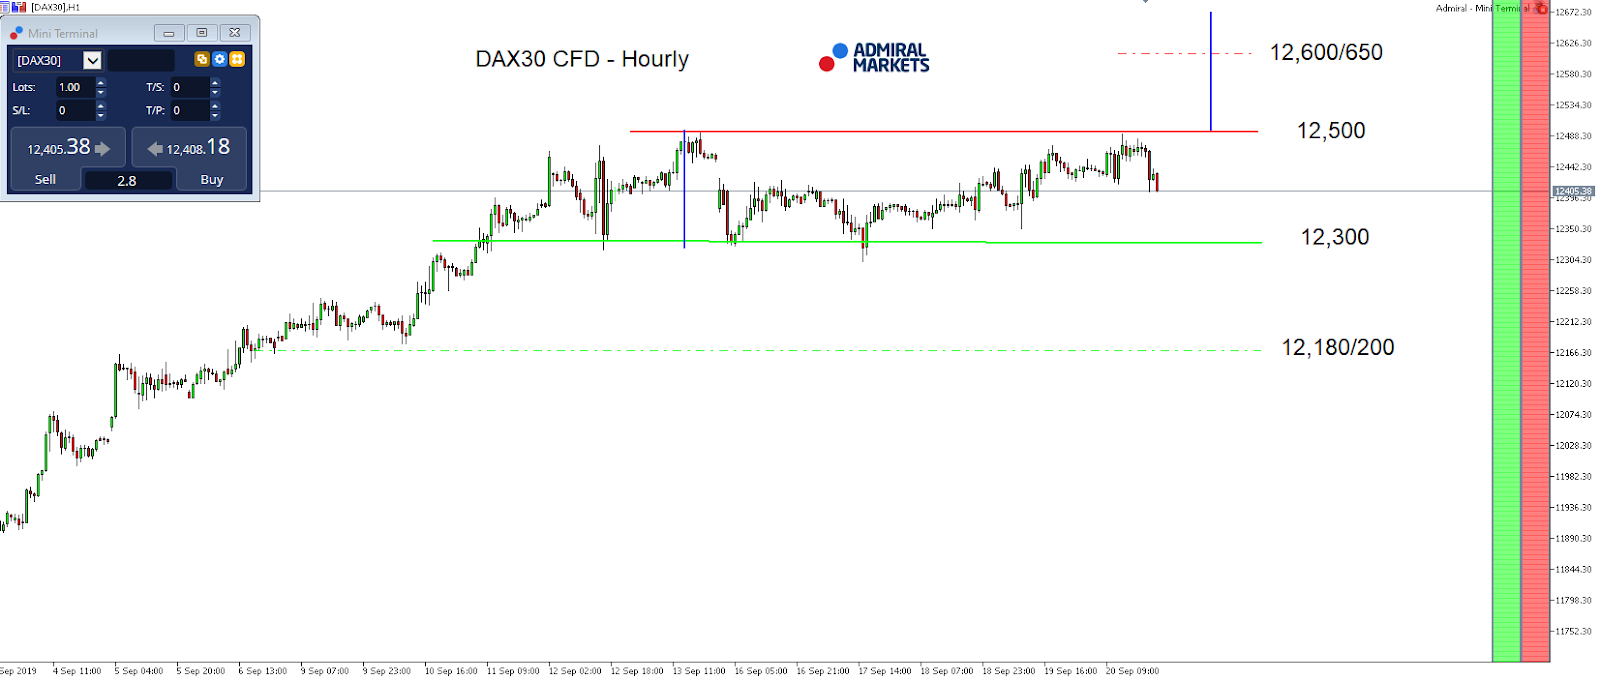
As the economic calendar, particularly in Europe, is quite thin this week, our focus will be on the technical side in the DAX30 CFD.
On an hourly chart, we consider the mode to be neutral and range-bound between 12,300 and 12,500 points. But, given the sequence of higher highs and lows, there’s a clear bullish touch.
Given the recent price action, we consider a significant and sustainable break above 12,500 points to be only a matter of time, levelling the path up to the current yearly highs around 12,650 points in the German index.
We project a technical target to be around 12,700 points, given the 200 point range between 12,300 and 12,500.
Only a break below 12,300 points would darken the bullish outlook, switch the mode to neutral, and activate the region around 12,180 points as a first potential target on the downside.
Source: Admiral Markets MT5 with MT5-SE Add-on DAX30 CFD Hourly chart (between September 3, 2019, to September 20, 2019). Accessed: September 20, 2019, at 10:00pm GMT
Source: Admiral Markets MT5 with MT5-SE Add-on DAX30 CFD Daily chart (between June 7, 2018, to September 20, 2019). Accessed: September 20, 2019, at 10:00pm GMT – Please note: Past performance is not a reliable indicator of future results, or future performance.
In 2014, the value of the DAX30 CFD increased by 2.65%, in 2015, it increased by 9.56%, in 2016, it increased by 6.87%, in 2017 it increased by 12.51%, in 2018, it fell by 18.26%, meaning that after five years, it was up by 10.5%.
Discover the world’s #1 multi-asset platform
Admiral Markets offers professional traders the ability to trade with a custom, upgraded version of MetaTrader 5, allowing you to experience trading at a significantly higher, more rewarding level. Experience benefits such as the addition of the Market Heat Map, so you can compare various currency pairs to see which ones might be lucrative investments, access real-time trading data, and so much more. Click the banner below to start your FREE download of MT5 Supreme Edition!
Disclaimer: The given data provides additional information regarding all analysis, estimates, prognosis, forecasts or other similar assessments or information (hereinafter “Analysis”) published on the website of Admiral Markets. Before making any investment decisions please pay close attention to the following:
This is a marketing communication. The analysis is published for informative purposes only and are in no way to be construed as investment advice or recommendation. It has not been prepared in accordance with legal requirements designed to promote the independence of investment research, and that it is not subject to any prohibition on dealing ahead of the dissemination of investment research.
Any investment decision is made by each client alone whereas Admiral Markets shall not be responsible for any loss or damage arising from any such decision, whether or not based on the Analysis.
Each of the Analysis is prepared by an independent analyst (Jens Klatt, Professional Trader and Analyst, hereinafter “Author”) based on the Author’s personal estimations.
To ensure that the interests of the clients would be protected and objectivity of the Analysis would not be damaged Admiral Markets has established relevant internal procedures for prevention and management of conflicts of interest.
Whilst every reasonable effort is taken to ensure that all sources of the Analysis are reliable and that all information is presented, as much as possible, in an understandable, timely, precise and complete manner, Admiral Markets does not guarantee the accuracy or completeness of any information contained within the Analysis. The presented figures refer that refer to any past performance is not a reliable indicator of future results.
The contents of the Analysis should not be construed as an express or implied promise, guarantee or implication by Admiral Markets that the client shall profit from the strategies therein or that losses in connection therewith may or shall be limited.
Any kind of previous or modeled performance of financial instruments indicated within the Publication should not be construed as an express or implied promise, guarantee or implication by Admiral Markets for any future performance. The value of the financial instrument may both increase and decrease and the preservation of the asset value is not guaranteed.
The projections included in the Analysis may be subject to additional fees, taxes or other charges, depending on the subject of the Publication. The price list applicable to the services provided by Admiral Markets is publicly available from the website of Admiral Markets.
Leveraged products (including contracts for difference) are speculative in nature and may result in losses or profit. Before you start trading, you should make sure that you understand all the risks.
This week – September 23 through September 28 – central banks from 14 countries or jurisdictions are scheduled to decide on monetary policy: Kenya, Paraguay, Hungary, Lesotho, Morocco, New Zealand, Thailand, Czech Republic, Fiji, Philippines, Egypt, Mexico, Colombia and Trinidad & Tobago.
Following table includes the name of the country, the date of the next policy decision, the current policy rate, the result of the last policy decision, the change in the policy rate year to date, and the rate one year ago.
The table is updated when the latest decisions are announced and can always accessed by clicking on This Week.
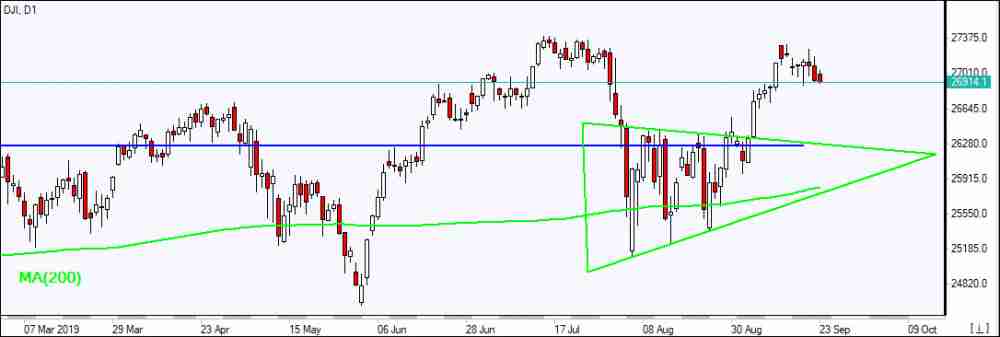
US stocks pulled back on Friday as President Trump said he wanted a complete trade deal with the China, not just an agreement for China to buy more US agricultural goods. The S&P 500 slid 0.5% to 2991.90, falling 0.5% for the week. Dow Jones industrial lost 0.6% to 26934.19. The Nasdaq fell 0.8% to 8117.67. The dollar resumed strengthening: the live dollar index data show the ICE US Dollar index, a measure of the dollar’s strength against a basket of six rival currencies, rose 0.1% to 98.46 and is higher currently. Stock index futures point to lower openings today.
CAC 40 leads European indexes movement
European stocks extended gains fifth straight week on Friday led by energy and bank shares. Both EUR/USD and GBP/USD turned lower Friday with both pairs falling currently. The Stoxx Europe 600 Index gained 0.3%. The DAX 30 added 0.1% Friday to 12468.01. France’s CAC 40 advanced 0.6% while UK’s FTSE 100 slid 0.2% to 7344.92.
Shanghai Composite leads Asian indexes losses
Asian stock indices are mostly lower today. Japan’s Nikkei is closed for a holiday with yen lower against the dollar. China’s markets are lower as traders watch anxiously for developments on US-China trade negotiations front: the Shanghai Composite Index is down 1.0% and Hong Kong’s Hang Seng Index is 0.9% lower. Australia’s All Ordinaries Index extended gains 0.2% with the Australian dollar’s climb against the greenback resuming.
Brent futures prices are extending losses today as US continues investigation on alleged Iran involvement in last week drone attacks on crude facilities in Saudi Arabia. Prices slipped on Friday: Brent for November settlement ended 0.2% lower at $64.28 a barrel Friday, posting 6.7% gain for the week.
Note: This overview has an informative and tutorial character and is published for free. All the data, included in the overview, are received from public sources, recognized as more or less reliable. Moreover, there is no guarantee that the indicated information is full and precise. Overviews are not updated. The whole information in each overview, including opinion, indicators, charts and anything else, is provided only for familiarization purposes and is not financial advice or а recommendation. The whole text and its any part, as well as the charts cannot be considered as an offer to make a deal with any asset. IFC Markets and its employees under any circumstances are not liable for any action taken by someone else during or after reading the overview.
By Hussein Sayed, Chief Market Strategist (Gulf & MENA), ForexTime
China’s Ministry of Commerce describe trade talks as positive
PMIs from Germany and France expected to show improvement in manufacturing
Pound traders await Supreme Court decision
Oil trades more than 1% higher on supply doubts and rising tensions
Investors are having a difficult time assessing the current economic and financial environment, hence making it hard to manage their portfolios. While risk appetite was supported by central bank easing, particularly from the European Central Bank and the Federal Reserve, two major factors that remained unresolved are trade disputes and rising tensions in the Middle East.
Despite the statement from the Chinese Ministry of Commerce describing talks held last week with its US counterparty as “constructive,” the withdrawal from a planned visit to US farm states reignited traders’ concerns. As a result, all three US major indices ended Friday’s session in the red with the tech-heavy weighted Nasdaq Composite leading the declines with a 0.8% drop.
Investors remain unconvinced that a trade deal is about to see the light of day soon, and that’s likely to put a cap on any further gains in risk assets. The longer it takes to strike a deal, the more economic damage will be felt. This would likely lead to more rotation into value stocks rather than momentum or growth ones.
There’re plenty of economic data releases this week that will help investors evaluate the current fundamentals. In Europe, flash PMIs from Germany and France are expected to point to a slight recovery in manufacturing activity during September. This year has shown a significant divergence between the manufacturing and services sectors, with manufacturing activity falling to multi-year lows while services are managing to hold up. Whether the ECB’s latest monetary easing has helped improve this data will be seen later today.
In the US, the final Q2 GDP will be released on Thursday but analysts expect it to be a non-event. Instead, investors should be interested in US Consumer Confidence data on Tuesday. Consumers have been shrugging off the latest escalation in the trade war and as of the latest release in August, they didn’t seem worried about rising prices. However, if consumer confidence shows signs of weakness, it will be an early signal that their spending, which accounts for roughly 70% of GDP, will slow down in Q4.
Sterling traders will mostly be interested in the ruling of the UK’s Supreme Court on whether Prime Minister Boris Johnson acted lawfully in suspending Parliament. A ruling against the government will force him to recall lawmakers, which will be considered good for Sterling as it increases further the chances of delaying Brexit.
Today’s biggest moves were seen in Oil prices with Brent and WTI both rising more than 1%. Two questions need to be answered this week to help forecast the next move. How fast will Aramco restore lost output and what are the chances of a US strike against Iran? While investors do not seem to be pricing in a military confrontation, this option shouldn’t be completely ruled out.
Disclaimer: The content in this article comprises personal opinions and should not be construed as containing personal and/or other investment advice and/or an offer of and/or solicitation for any transactions in financial instruments and/or a guarantee and/or prediction of future performance. ForexTime (FXTM), its affiliates, agents, directors, officers or employees do not guarantee the accuracy, validity, timeliness or completeness, of any information or data made available and assume no liability as to any loss arising from any investment based on the same.
In this interview with Craig Taylor, CEO of Defense Metals Corp., Peter Epstein of Epstein Research delves into the complexities and potential of rare earth metals markets, and discusses the company’s REE projects.
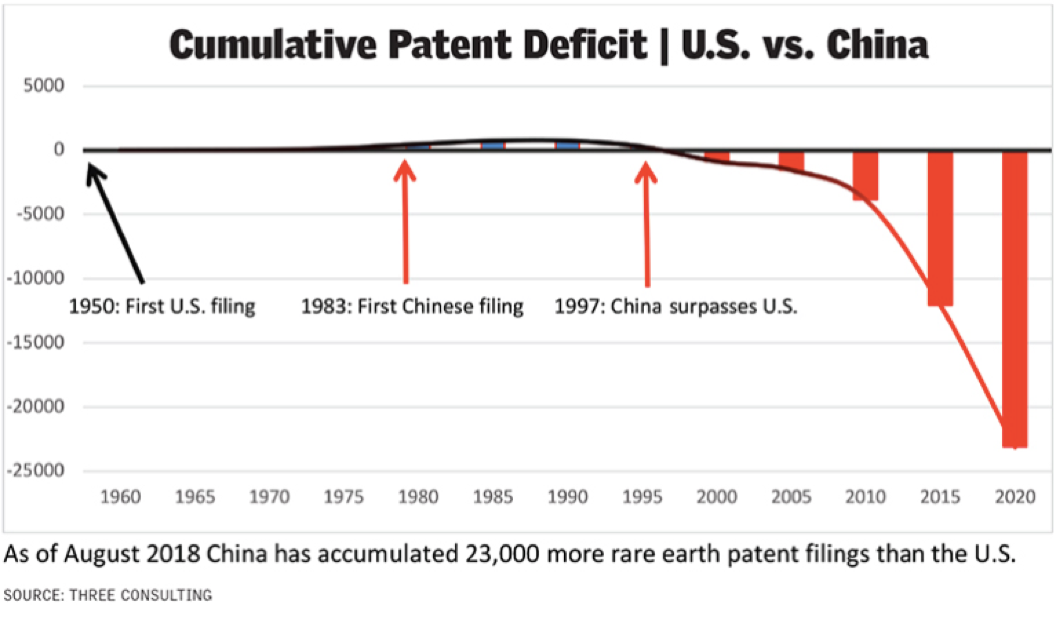
Rare earth elements (REEs) have been in the geopolitical spotlight for much of the year. Many, myself included, are surprised that the combination of severe trade tensions between the U.S. and China, strong growth in wind farm installations (wind farms use lots of REE magnets) and emerging growth in electric vehicles over the next decade has not driven REE prices higher.
However, if one scans the green energy/tech/battery metals landscape, one might notice something strange. Not only have REE prices not moved higher, vanadium, cobalt and lithium prices have all fallen precipitously over the past 1518 months. My point is that commodity prices can and sometimes do remain weaker for much longer than people imagine possible.
However, when the prices of these critical metals rebound, they can move really fast. Three times over the past 15 years the uranium price has increased by hundreds of percentage points within a 12-month period. Cobalt, lithium and vanadium had spectacular runs from 2015 to 2017, only to fall out of bed in 2018 and 2019.
In many ways, rare earth metals are even more crucial to modern society than the green energy/tech/battery metals. Most important, they’re used heavily in every First World country’s military programs. I won’t list all of the offensive and defensive military capabilities that rely on REEs; those can be found with a quick Google search. The U.S. cannot allow China to continue dominating all aspects of the REE industry.
Nothing I’ve said so far is new, but this is new: In August, the U.S. Department of Defense (DoD) commenced a wide-ranging assessment of North American REE supply chains, including barriers to the market experienced by aspiring producers. The DoD will use information from industry participants to propose recommendations to promote the North American commercial, industrial, high-tech manufacturing, green energy and defense industries.
The DoD indicated that help could include government investment into select REE companies or projects in the U.S., Canada and Australia.
Canadian-based Defense Metals Corp. could serve North American LREE markets Tiny Defense Metals Corp. (DEFN:TSX.V; DFMTF:OTC; 35D:FSEQB) responded to the DoD’s request for information. I have no idea if that will lead to funding or something like a loan guaranty, but it’s highly encouraging that China’s dominance in REE processing and supply is finally being addressed.
With that in mind, I was able to track down the CEO of Defense Metals, Craig Taylor, to ask him about his company, his flagship project and, of course, the need for critical rare earth metals to be sourced from multiple places around the globe, not just China.
Peter Epstein: How did the U.S. get itself into a dangerous over-reliance on China for REEs (and other things)?
Craig Taylor: In the 1980s and ’90s, the U.S. moved substantially all of the mining, production and refining of REEs to China to lower costs. A primary reason costs were lower in China was because of weak environmental oversight. Things may have improved on the environmental front in the past 2030 years, but the damage has been done to the north American REE industry.
There have been large moves in the prices of gold, silver, palladium and platinum over the past year. Some of the activity is presumably due to Chinese/U.S. trade tensions. Why haven’t rare earth metals prices participated in the rally?
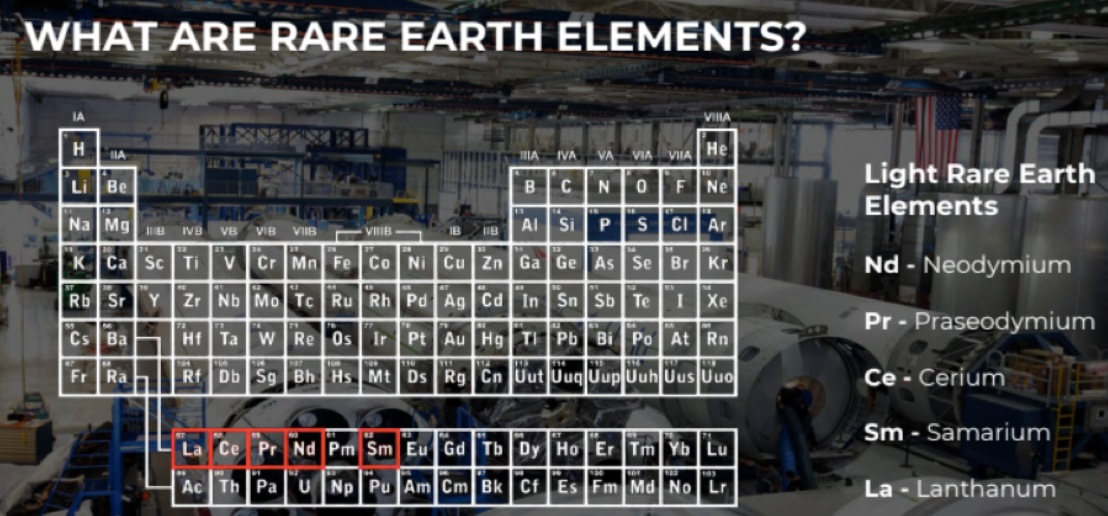
That’s a good question. A lot of people are wondering why prices for rare earth metals like neodymium (Nd), praseodymium (Pr), dysprosium (Dy), and others have remained relatively steady after a meaningful move higher in May/June. By now, most readers know that China dominates the global supply of REEs. They control more than 80% of the market. China can heavily influence prices. If China wanted prices to be higher, prices would probably be higher.
So far, China has not restricted the flow of REEs to the west. But, we think Chinese officials are keeping that option on the table to use for maximum effect if/when they deem the time is right. Still, no matter what China does, we think pricing for crucial REEs is headed higher purely on supply-and-demand fundamentals. It’s been reported that without presidential action, U.S. industry cannot reasonably be expected to provide the production capability for samarium cobalt rare earth permanent magnets adequately and in a timely manner.
Peter Epstein: Can you please give readers the latest snapshot of your flagship Wicheeda REE project?
Craig Taylor: Yes, of course. The Wicheeda property consists of 6 mineral claims covering about 1,700 hectares (~4,200 acres). It’s ~80 kilometers northeast of Prince George in central British Columbia. Favorable mineralogy and an attractive lanthanide distribution makes Wicheeda a very prospective light rare earth metal (LREE) deposit. We have a trained workforce in one of the most mining-friendly jurisdictions in the world. A hydroelectric power line, gas pipeline and the Canadian National Railway are all nearby.
The Wicheeda deposit’s mineral resource contains 11.37 million tonnes (Inferred) averaging 1.96% LREE, at a cutoff grade of 1.0% LREE (sum of cerium, lanthanum, neodymium and samarium percentages). The technical report describing the project and the Inferred resources can be found on SEDAR under the date July 9, 2019.
Peter Epstein: Very interesting. Can you continue by telling us about the ongoing drill program?
Craig Taylor: Yes. As many readers may know, we are in the middle of a diamond drill program designed to test the northern, southern and western extent of the Wicheeda deposit, further delineate the relatively higher-grade, near-surface, dolomite-carbonatite unit, and address select internal drilling gaps in the deposit.
Core drilling started at the location of our prior 30-tonne bulk samplewhich, by the way, returned composite head assays of 1.77% lanthanum-oxide, 2.34% cerium-oxide, 0.52% neodymium-oxide and 0.18% praseodymium-oxide. That’s a total of 4.81% light rare earth oxide (LREO).
We are off to a great start; eight of a planned 13 drill holes totaling 1,165 meters have been completed. All holes intersected significant widths of visible REE mineralization. A detailed review of historic and current drill cores indicates the presence of multiple phases of REE-mineralized dolomite-carbonatite, one of which visually appears to contain a higher percentage of REE-bearing minerals.
We have intersected REE mineralization in all eight drill holes to date. Resource definition drilling will allow for an updated and enhanced geological model that management believes should substantially increase the confidence level in the contained mineral resources of the Wicheeda deposit.
Peter Epstein: What are the next steps after delivering an updated mineral resource estimate? A preliminary economic assessment (PEA)?
Craig Taylor: We engaged an experienced consulting group to give us a roadmap of the extensive environmental requirements for our project. We will start with baseline studies that have to be conducted for at least a year. So, no PEA in the next 12 months, but we expect to complete a third-party PEA in the first half of 2021.
Peter Epstein: What are your latest thoughts on the need for a pilot plant? Approximately how much might it cost?
Craig Taylor: We are looking very closely at building a pilot plant. SGS is finishing up work that will help us in our thinking about that. I can say that we’re leaning toward doing one. We think it would cost about $550,000. The pilot plant would be up and running before a PEA is delivered.
Peter Epstein: So, to reiterate, Defense Metals is well positioned to benefit from demand for non-Chinese REEs and has near-term catalysts to watch for?
Craig Taylor: Yes, exactly. Let me add, it’s not just the U.S. that wants increased security of supply and a more diversified supply baseeveryone does! We have a number of near-term catalysts, most notably drill results, an important update on ongoing metallurgy work being done by SGS, and a new mineral resource estimateall within the next few months.
And, we hope to have a pilot plant and a PEA several months after that. We have a pristine capital structure, with just 30 million shares outstanding and no debt, and we are funded to the end of the year.
Peter Epstein: Thank you, Craig, for the informative update. Continued good luck on the Wicheeda project.
Peter Epstein is the founder of Epstein Research. His background is in company and financial analysis. He holds an MBA degree in financial analysis from New York University’s Stern School of Business.
Disclosures/disclaimers: The content of this article is for information only. Readers fully understand and agree that nothing contained herein, written by Peter Epstein of Epstein Research [ER], (together, [ER]) about Defense Metals Corp., including but not limited to, commentary, opinions, views, assumptions, reported facts, calculations, etc. is to be considered implicit or explicit investment advice. Nothing contained herein is a recommendation or solicitation to buy or sell any security. [ER] is not responsible for investment actions taken by the reader. [ER] has never been, and is not currently, a registered or licensed financial advisor or broker/dealer, investment advisor, stockbroker, trader, money manager, compliance or legal officer, and does not perform market making activities. [ER] is not directly employed by any company, group, organization, party or person. The shares of Defense Metals Corp. are highly speculative, not suitable for all investors. Readers understand and agree that investments in small cap stocks can result in a 100% loss of invested funds. It is assumed and agreed upon by readers that they will consult with their own licensed or registered financial advisors before making any investment decisions.
At the time this interview was posted, Peter Epstein owned stock in Defense Metals Corp. and the Company was an advertiser on [ER].
While the author believes he’s diligent in screening out companies that, for any reasons whatsoever, are unattractive investment opportunities, he cannot guarantee that his efforts will (or have been) successful. [ER] is not responsible for any perceived, or actual, errors including, but not limited to, commentary, opinions, views, assumptions, reported facts & financial calculations, or for the completeness of this article or future content. [ER] is not expected or required to subsequently follow or cover any specific events or news, or write about any particular company or topic. [ER] is not an expert in any company, industry sector or investment topic.
Streetwise Reports Disclosure: 1) Peter Epstein’s disclosures are listed above. 2) The following companies mentioned in the article have a digital marketing program through Streetwise Reports: Defense Metals. Click here for important disclosures about sponsor fees. The information provided above is for informational purposes only and is not a recommendation to buy or sell any security. 3) Statements and opinions expressed are the opinions of the author and not of Streetwise Reports or its officers. The author is wholly responsible for the validity of the statements. The author was not paid by Streetwise Reports for this article. Streetwise Reports was not paid by the author to publish or syndicate this article. Streetwise Reports requires contributing authors to disclose any shareholdings in, or economic relationships with, companies that they write about. Streetwise Reports relies upon the authors to accurately provide this information and Streetwise Reports has no means of verifying its accuracy.
4) The article does not constitute investment advice. Each reader is encouraged to consult with his or her individual financial professional and any action a reader takes as a result of information presented here is his or her own responsibility. By opening this page, each reader accepts and agrees to Streetwise Reports’ terms of use and full legal disclaimer. This article is not a solicitation for investment. Streetwise Reports does not render general or specific investment advice and the information on Streetwise Reports should not be considered a recommendation to buy or sell any security. Streetwise Reports does not endorse or recommend the business, products, services or securities of any company mentioned on Streetwise Reports. 5) From time to time, Streetwise Reports LLC and its directors, officers, employees or members of their families, as well as persons interviewed for articles and interviews on the site, may have a long or short position in securities mentioned. Directors, officers, employees or members of their immediate families are prohibited from making purchases and/or sales of those securities in the open market or otherwise from the time of the interview or the decision to write an article until three business days after the publication of the interview or article. The foregoing prohibition does not apply to articles that in substance only restate previously published company releases. As of the date of this interview, officers and/or employees of Streetwise Reports LLC (including members of their household) own securities of Defense Metals, a company mentioned in this article.
SunPower Corp. shares are trading 6% higher today as the firm announced that its Equinox Storage paired with its platform provides energy independence to residential users.
Global sustainable energy company SunPower Corp. (SPWR:NASDAQ) today announced the introduction of its Equinox Storage, which the firm claims is the next major advancement in the company’s Equinox energy platform, giving homeowners more freedom from utility outages, grid uncertainty and peak energy rates. The company indicated that homeowners with Equinox Storage can choose to store energy for full-home or partial-home backup during blackouts, reduce daily peak electricity consumption or any combination that best fits their needs.
SunPower reports that it offers energy independence with Equinox Storage and states that its leading solar technology paired with powerful battery, proprietary software and new mobile app gives homeowners control of their energy. The firm advises that it is combining high-efficiency solar with high-impact storage, and that Equinox Storage is made specifically for the company’s Equinox Solar solution, which it claims is the only fully-integrated residential solar system designed, engineered and warranted by one company.
Norm Taffe, EVP of SunPower’s North America residential solar, commented, “We’re entering a new solar decade as storage adoption increases with the advancement of battery technologies, and with accompanying services becoming standard…For homeowners, Equinox Storage provides energy certainty and the power to make electricity allocation decisions, easing concerns with scheduled power outages, prolonged wildfire seasons, and unpredictable energy rates that are becoming more common…With up to 12 kilowatt hours of storage capacity, Equinox Storage gives homeowners the ability to keep lights on, essential appliances operating, internet connected, and more, which can be critical during an outage…Equinox Storage also automatically manages energy supply based on solar production, home electricity consumption, and utility rates to make the most efficient use of stored power every day.”
The company states that with a low-profile design, Equinox Storage occupies less space than competing solutions, while leaving room for future storage capacity expansion. The firm says that it has matched hardware aesthetics with next-generation software capabilities to give homeowners direct control of how and when they use stored solar energy.
The firm indicates that Equinox Storage builds on SunPower’s experience helping commercial customers like Whole Foods and Cabot Corporation lower peak energy demand from the grid with Helix Storage. The company has more than 15 megawatts of Helix Storage operating or under contract, and a pipeline of 136 megawatts.
Taffe elaborated further, “Helix Storage has helped our commercial customers reduce demand charges and save on electricity costs, while supporting the grid by reducing strain on distribution and transmission networks for operational efficiencies…We’ve used the same industrial-strength software and data platform to create our residential storage solution for homeowners”.
SunPower plans to showcase its Equinox Storage at next week’s Solar Power International (SPI), part of North America Smart Energy Week in Salt Lake City, Utah, and the company expects to expand availability nationwide throughout 2020. The firm advised that eligible SunPower Equinox Solar customers in California can pre-order Equinox Storage beginning in November with installation expected in the first half of next year. Qualified customers will also be able to finance Equinox Storage through its lending partners.
SunPower is based in San Jose, Calif., and identifies itself as one of the world’s most innovative and sustainable global energy companies. The company delivers complete solar solutions to residential, commercial, and power plant customers. The company offers solar module technology and solar power systems designed to generate electricity; integrated smart energy software solutions that enable customers to manage and optimize the cooperation center of excellence measurement; installation, construction and ongoing maintenance and monitoring services; and financing solutions.
SunPower has a market capitalization of $2.1 billion. The firm has around 142.5 million shares outstanding and started the day with a short interest of about 13.5%. The stock price is up 208.85% year-to-date and 102.12% over the past one year. SPWR shares opened today at $14.39 (-$0.02, -0.14%) from yesterday’s closing price of $14.41. Since the open today, the stock has traded up between $14.37 and $15.57/share and is currently trading at $15.25 (+0.84, +5.83%).
Disclosure: 1) Stephen Hytha compiled this article for Streetwise Reports LLC and provides services to Streetwise Reports as an independent contractor. He or members of his household own securities of the following companies mentioned in the article: None. He or members of his household are paid by the following companies mentioned in this article: None. 2) The following companies mentioned in this article are billboard sponsors of Streetwise Reports: None. Click here for important disclosures about sponsor fees. 3) Comments and opinions expressed are those of the specific experts and not of Streetwise Reports or its officers. The information provided above is for informational purposes only and is not a recommendation to buy or sell any security. 4) The article does not constitute investment advice. Each reader is encouraged to consult with his or her individual financial professional and any action a reader takes as a result of information presented here is his or her own responsibility. By opening this page, each reader accepts and agrees to Streetwise Reports’ terms of use and full legal disclaimer. This article is not a solicitation for investment. Streetwise Reports does not render general or specific investment advice and the information on Streetwise Reports should not be considered a recommendation to buy or sell any security. Streetwise Reports does not endorse or recommend the business, products, services or securities of any company mentioned on Streetwise Reports. 5) From time to time, Streetwise Reports LLC and its directors, officers, employees or members of their families, as well as persons interviewed for articles and interviews on the site, may have a long or short position in securities mentioned. Directors, officers, employees or members of their immediate families are prohibited from making purchases and/or sales of those securities in the open market or otherwise from the time of the interview or the decision to write an article until three business days after the publication of the interview or article. The foregoing prohibition does not apply to articles that in substance only restate previously published company releases.
The support of the Puerto Rico Financial Oversight and Management Board advances the solar project.
Greenbriar Capital Corp.’s (GRB:TSX.V; GEBRF:OTC) Montalva 100- to 165-megawatt solar project took several steps forward when in August the company reported that the Puerto Rico Electric Power Authority (PREPA) notified it that the Financial Oversight and Management Board (FOMB) reviewed the project and is “supportive of the company’s economic proposal.”
FOMB has authorized PREPA to work with Greenbriar to “finalize the formal terms of the revised power purchase operating agreement (PPOA).” When that is completed, “PREPA will provide the FOMB with the final agreement and seek FOMB approval to move ahead for final judicial approval.”
“I expect Montalva could be generating income for Greenbriar in 2020 and full capacity in 2021.” – Ron Struthers, Struthers Resource Stock Report
This news was followed by the announcement that Greenbriar has executed a $195-million project financing mandate with Voya Investment Management LLC for the Montalva project. The company noted that the financing “takes place at the project level and does not involve the sale of the company’s shares.”
The mandate is to “structure, arrange and provide key capital requirements for the Montalva solar project,” and the company notes that completion by Voya is discretionary. Greenbriar will issue under certain conditions, as an incentive to Voya, 3.5 million common share purchase warrants at $1 per share and exercisable for five years.
The agreement for Montalva project is for a 25-year term, with two five-year renewal options, and the project is expected to take around 14 months to construct.
Jeff Ciachurski, CEO of Greenbriar, told Streetwise Reports, “With infrastructure projects, a company’s valuation is established on the day of financial close with the project lenders, not when the project construction is completed. This is because the lending institutions will have made sure that any risk is removed before they lend out the funds, requiring the contractor and suppliers to submit letters of credit.”
“If anyone were to take over Greenbriar, it would happen when financial close occurs,” Ciachurski added.
A valuation report, ordered by a judge and released publicly, valued the Montalva project at an NPV of $191 million. At approximately 22 million shares of Greenbriar outstanding fully diluted, that would result in a value of around $8.60 per share.
Industry observer Ron Struthers rated Greenbriar a “Buy” and wrote in the Struthers Resource Stock Report on August 13, “The cost of electricity in Puerto Rico, around 23 cents/Kwh is about double the average of the rest of the USA. This is because oil has to be imported there and the previous poor management and corruption of PREPA. Puerto Rico is aiming to supply 20% of their electricity with renewable s by 2035 or about 2,000 MW average daily load.
“Solar power generation has come way down in price with technology advancement. The EIA estimates the levelized cost of electricity for solar and onshore wind is cheaper than any other electrical generation. In Texas, a purchase power agreement was signed for just 2.5 cents/Kwh. Prices will depend on location with the biggest factor the amount of sun light and the local electricity costs. The main point is that there is plenty of room for Greenbriar to negotiate a lucrative power agreement.
“While getting Montalva up and running is taking longer, because of the slow progress of politics and rebuilding of the energy grid, things are progressing and change is taking root. Last month the people of Puerto Rico took to the streets and forced the governor to resign. Things are moving forward. I expect Montalva could be generating income for Greenbriar in 2020 and full capacity in 2021,” Struthers concluded.
In addition to Montalva, Greenbriar holds the 138-acre Sage Ranch real estate project in Tehachapi, Calif., located 90 miles east of Los Angeles. The project is approved for more than 1,000 housing units. The company is in talks with the U.S. Air Force for providing housing to Air Force members, civilian staff and private contractors and their families.
Greenbriar also recently sold its interest in RealBlock, an entity that has developed blockchain software that provides security for the U.S. title insurance industry. The company retains a net royalty of $3 for every opening transaction; if the software app achieves its goal of 60,000 transactions per month, the net royalty will be $180,000 per month.
Disclosure: 1) Patrice Fusillo compiled this article for Streetwise Reports LLC and provides services to Streetwise Reports as an employee. She or members of her household own securities of the following companies mentioned in the article: None. She or members of her household are paid by the following companies mentioned in this article: None. 2) The following companies mentioned in this article are billboard sponsors of Streetwise Reports: None. Click here for important disclosures about sponsor fees. Within the last six months, an affiliate of Streetwise Reports has disseminated information about the private placement of the following companies mentioned in this article: Greenbriar Capital. 3) Comments and opinions expressed are those of the specific experts and not of Streetwise Reports or its officers. The information provided above is for informational purposes only and is not a recommendation to buy or sell any security. 4) The article does not constitute investment advice. Each reader is encouraged to consult with his or her individual financial professional and any action a reader takes as a result of information presented here is his or her own responsibility. By opening this page, each reader accepts and agrees to Streetwise Reports’ terms of use and full legal disclaimer. This article is not a solicitation for investment. Streetwise Reports does not render general or specific investment advice and the information on Streetwise Reports should not be considered a recommendation to buy or sell any security. Streetwise Reports does not endorse or recommend the business, products, services or securities of any company mentioned on Streetwise Reports. 5) From time to time, Streetwise Reports LLC and its directors, officers, employees or members of their families, as well as persons interviewed for articles and interviews on the site, may have a long or short position in securities mentioned. Directors, officers, employees or members of their immediate families are prohibited from making purchases and/or sales of those securities in the open market or otherwise from the time of the interview or the decision to write an article until three business days after the publication of the interview or article. The foregoing prohibition does not apply to articles that in substance only restate previously published company releases. As of the date of this article, officers and/or employees of Streetwise Reports LLC (including members of their household) own securities of Greenbriar Capital, a company mentioned in this article.
Disclosures for Struthers Resource Stock Report: Ron Struthers: I, or members of my immediate household or family, own shares of the following companies mentioned in this article: Greenbriar Capital. I personally am, or members of my immediate household or family are, paid by the following companies mentioned in this article: None. My company currently has a financial relationship with the following companies mentioned in this article: Greenbriar Capital is an advertiser at playstocks.net.


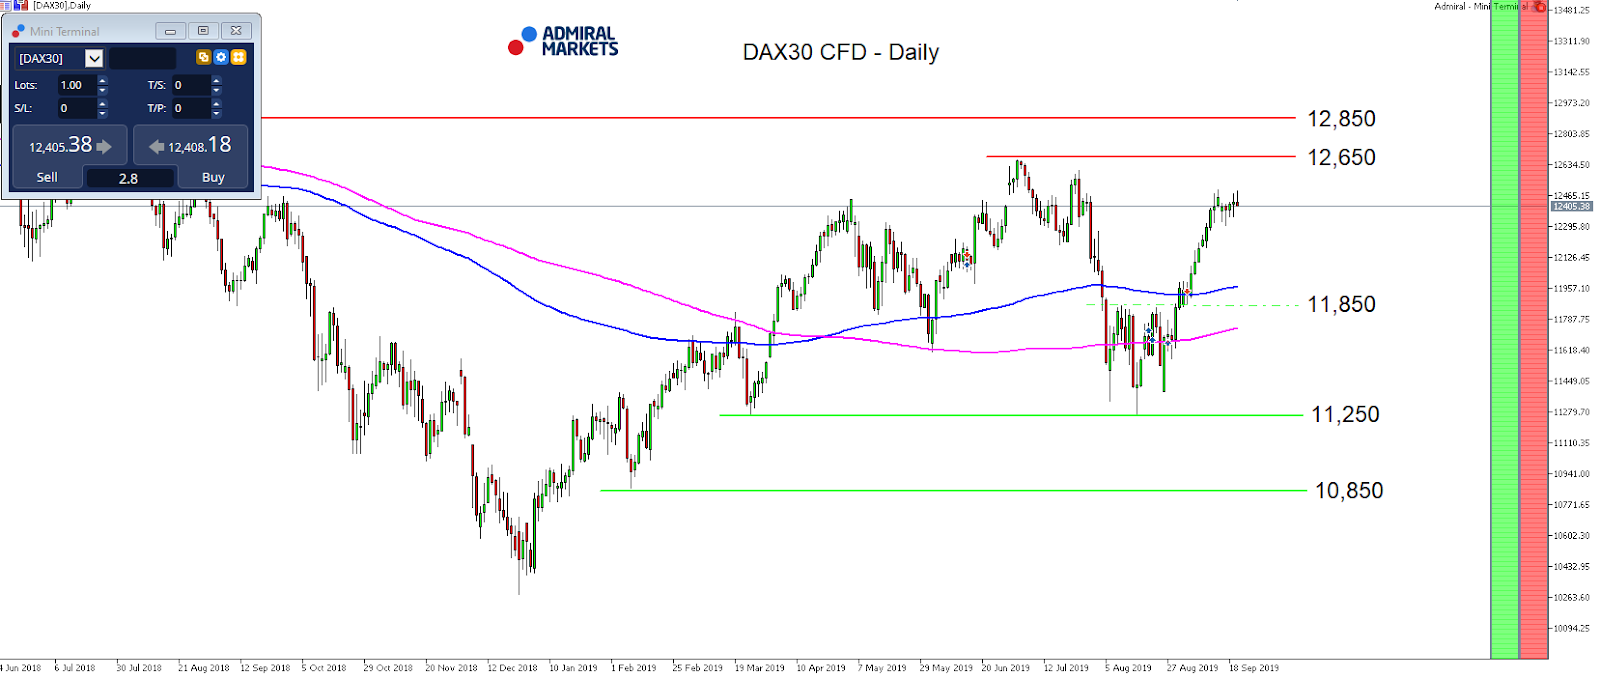 Source: Admiral Markets MT5 with MT5-SE Add-on DAX30 CFD Daily chart (between June 7, 2018, to September 20, 2019). Accessed: September 20, 2019, at 10:00pm GMT – Please note: Past performance is not a reliable indicator of future results, or future performance.