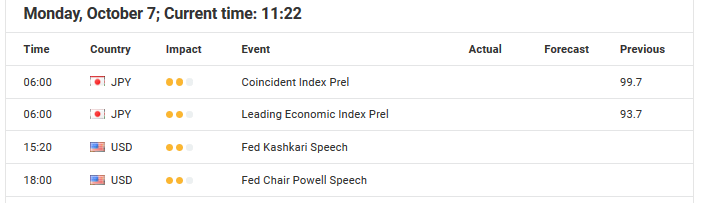
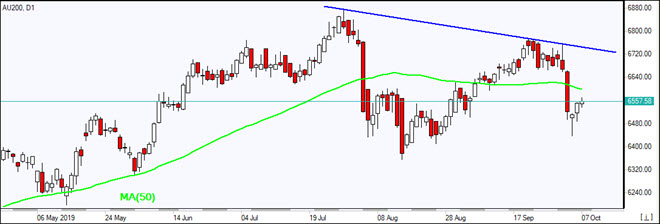
As we begin the trading week with a thin economic calendar, we want to mainly focus on the technical side in the DAX30 CFD.
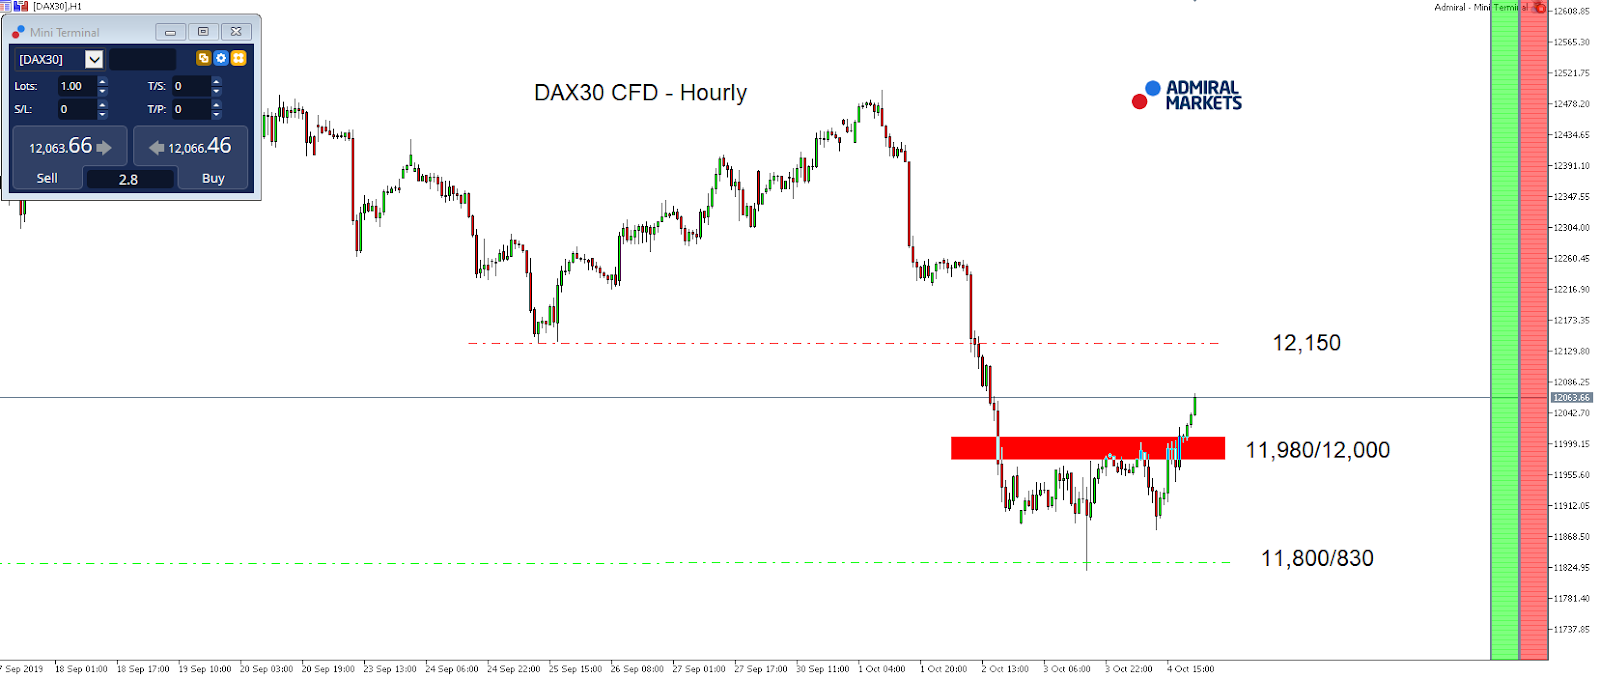
After the latest US economic indications with the ISM Manufacturing and ISM Non-Manufacturing data disappointing the market participants, and last Friday’s Non-Farm Payroll coming in mixed, bearish fuel drove price action in equities and in the DAX30 over the last few days. As such, the mode just looks quite stretched on the downside and chances are increased to see a short-term bounce.
We already saw such a bounce into the weekly close and the 12,000 point mark being re-captured, but the question is whether this move can be considered sustainable. If so, a deeper correction up to 12,150 points becomes a serious option.
If, on the other hand, bears take over control again into the start of the week, a re-test of the pre-weekly lows around 11,800/830 points seems likely. A sustainable break below would level the path down to 11,500 points in the days to come:
Source: Admiral Markets MT5 with MT5-SE Add-on DAX30 CFD Hourly chart (between September 16, 2019 to October 4, 2019). Accessed: October 4, 2019 at 10:00pm GMT
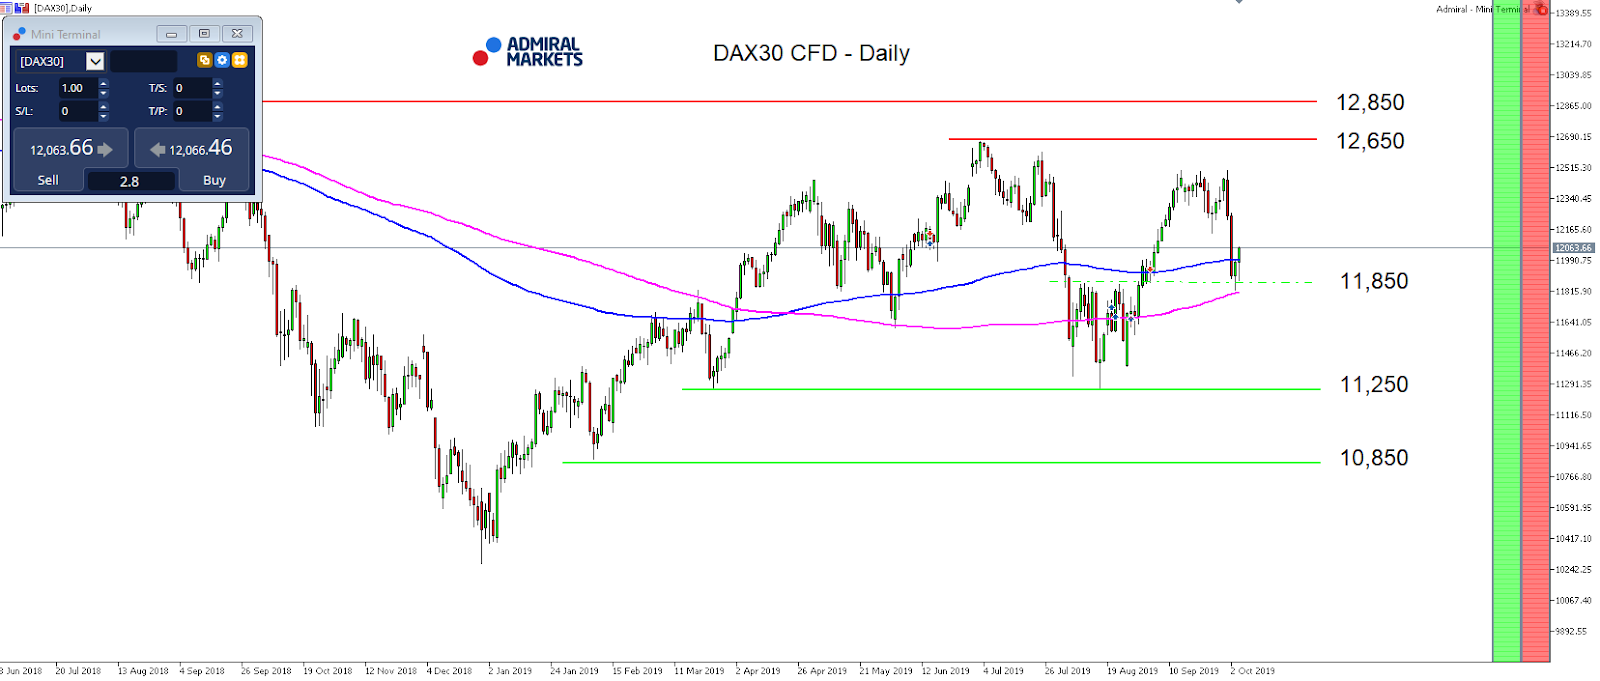
Source: Admiral Markets MT5 with MT5-SE Add-on DAX30 CFD Daily chart (between June 28, 2018, to October 4, 2019). Accessed: October 4, 2019, at 10:00pm GMT – Please note: Past performance is not a reliable indicator of future results, or future performance.
In 2014, the value of the DAX30 CFD increased by 2.65%, in 2015, it increased by 9.56%, in 2016, it increased by 6.87%, in 2017, it increased by 12.51%, in 2018, it fell by 18.26%, meaning that after five years, it was up by 10.5%.
Discover the world’s #1 multi-asset platform
Admiral Markets offers professional traders the ability to trade with a custom, upgraded version of MetaTrader 5, allowing you to experience trading at a significantly higher, more rewarding level. Experience benefits such as the addition of the Market Heat Map, so you can compare various currency pairs to see which ones might be lucrative investments, access real-time trading data, and so much more. Click the banner below to start your FREE download of MT5 Supreme Edition!
Disclaimer: The given data provides additional information regarding all analysis, estimates, prognosis, forecasts or other similar assessments or information (hereinafter “Analysis”) published on the website of Admiral Markets. Before making any investment decisions please pay close attention to the following:
This is a marketing communication. The analysis is published for informative purposes only and are in no way to be construed as investment advice or recommendation. It has not been prepared in accordance with legal requirements designed to promote the independence of investment research, and that it is not subject to any prohibition on dealing ahead of the dissemination of investment research.
Any investment decision is made by each client alone whereas Admiral Markets shall not be responsible for any loss or damage arising from any such decision, whether or not based on the Analysis.
Each of the Analysis is prepared by an independent analyst (Jens Klatt, Professional Trader and Analyst, hereinafter “Author”) based on the Author’s personal estimations.
To ensure that the interests of the clients would be protected and objectivity of the Analysis would not be damaged Admiral Markets has established relevant internal procedures for prevention and management of conflicts of interest.
Whilst every reasonable effort is taken to ensure that all sources of the Analysis are reliable and that all information is presented, as much as possible, in an understandable, timely, precise and complete manner, Admiral Markets does not guarantee the accuracy or completeness of any information contained within the Analysis. The presented figures refer that refer to any past performance is not a reliable indicator of future results.
The contents of the Analysis should not be construed as an express or implied promise, guarantee or implication by Admiral Markets that the client shall profit from the strategies therein or that losses in connection therewith may or shall be limited.
Any kind of previous or modeled performance of financial instruments indicated within the Publication should not be construed as an express or implied promise, guarantee or implication by Admiral Markets for any future performance. The value of the financial instrument may both increase and decrease and the preservation of the asset value is not guaranteed.
The projections included in the Analysis may be subject to additional fees, taxes or other charges, depending on the subject of the Publication. The price list applicable to the services provided by Admiral Markets is publicly available from the website of Admiral Markets.
Leveraged products (including contracts for difference) are speculative in nature and may result in losses or profit. Before you start trading, you should make sure that you understand all the risks.
Jobs report eases fears of sharp economic slowdown
Markets expect the Fed to cut interest rates later this month
All eyes on Washington this week as US-China trade talks resume
After a turbulent week in financial markets, last Friday’s nonfarm payrolls report helped to stave off a further sell-off in equities. The S&P 500 fell nearly 3% in the middle of last week following disappointing manufacturing and private payroll figures, both of which severely threatened the US economic expansion. Risk-on mood returned on Friday after non-farm payrolls data showed 136,000 jobs were added last month and the August figure was revised higher.
Meanwhile unemployment surprisingly fell to a 50-year low of 3.5%. The bad news for US consumers is that wages rose only 2.9% from a year earlier, the weakest pace in more than a year. However, this was welcome news to equity investors, as slower wage growth reduces inflation risks and suggests the Federal Reserve may keep cutting interest rates.
The conclusion drawn from last week’s economic data releases is that the US economy is showing signs of a slowdown, but not enough to fall into an imminent recession. This should mean there is further room for cutting interest rates in 2019, thereby providing support for risk assets. According to CME Fedwatch Tool, markets see 84% chance of a 25-basis point rate cut in October, and a 43% probability of another rate cut by December.
On Wednesday, the Fed will release the minutes of its September meeting where policymakers indicated no plans for further rate cuts this year and next. The minutes are likely to show deep division within the Committee given the split on the Fed’s decision to cut rates last month. However, it’s the upcoming data and trade negotiations that will have the final word on monetary policy actions.
Another round of US-China trade talks
This week’s biggest risk event is the return of US-China trade negotiations on Thursday and Friday. There’s no doubt that concerns over the outlook of global economic growth have severely intensified over the past couple of months due to the US-China trade dispute. President Trump may be willing to accept an amended deal to avoid a further selloff on Wall Street, especially with the ongoing impeachment inquiry. However, it remains unclear whether the Chinese will provide concessions on industrial policies or government subsidies, which have been a critical demand for the US administration.
If negotiations fall apart, there may be a new selloff in equity markets and a rally in Treasuries and gold.
Disclaimer: The content in this article comprises personal opinions and should not be construed as containing personal and/or other investment advice and/or an offer of and/or solicitation for any transactions in financial instruments and/or a guarantee and/or prediction of future performance. ForexTime (FXTM), its affiliates, agents, directors, officers or employees do not guarantee the accuracy, validity, timeliness or completeness, of any information or data made available and assume no liability as to any loss arising from any investment based on the same.
The biggest mover against the US dollar last week was the yen (+0.96%). Smaller gains were seen on the pound (+0.38%), the euro (+0.33%), the Kiwi dollar (+0.31%), and the Aussie dollar (+0.10%). The only currencies to lose ground were the Canadian dollar (-0.52%) and Swiss franc (-0.46%).
The EURUSD pair closed 0.11% up on Friday. Volatility was high during the US session following the release of employment data. The statistics were pretty good, abating fears of an impending recession in the US. Unemployment dropped, while the figures for July and August were revised upwards. One negative part of the data release were the figures on earnings.
The effects of the employment report were short-lived due to the fact that investors had their attention turned more towards political tensions in the US as well as the upcoming trade talks with China.
The euro rose to 1.0997 before slipping to 1.0957. Comments from Fed Chair Jerome Powell had no effect on markets. The EURUSD pair found equilibrium at 1.0980.
At the time of writing, the euro is trading at 1.0977. The pair is trading above the trend line and balance line. The stochastic oscillator is in the buy zone. The conditions are ripe for a surge towards the upper boundary of the wedge formation (1.0995) as trading gets underway in Europe. Since today is Monday, the pair is unlikely to go any higher than 1.10.
There aren’t any hugely important events in the economic calendar. There’s a resistance zone of 1.1009 to 1.1013 for bulls, as well as at 1.1040 from the upwards channel. The trend line is at 1.0971. A breakout here (closing the hour below this line) would rule out any chances of growth. Given the stochastic, however, this could be a false breakout, so stay sharp.
Dollar weakening continues despite solid jobs report
US stocks rebound broadened on Friday after solid September jobs report. The S&P 500 rose 1.4% to 2952.01, falling 0.3% for the week. Dow Jones industrial advanced 1.4% to 26573.72. The Nasdaq gained 1.4% to 7982.47. The dollar weakening continued at steady pace as US economy added below expected 136,000 new jobs in September while unemployment rate dropped to 3.5%: the live dollar index data show the ICE US Dollar index, a measure of the dollar’s strength against a basket of six rival currencies, slipped 0.1% to 98.78 but is higher currently. Stock index futures point to lower openings today.
FTSE 100 leads European indexes movements
European stocks rebounded on Friday led by defensive shares. The EUR/USD continued its climb Friday while GBP/USD slid with both pairs lower currently. The Stoxx Europe 600 Index gained 0.7%. The DAX 30 rose 0.7% Friday to 12012.81. France’s CAC 40 advanced 0.9% and UK’s FTSE 100 rallied 1.1% to 7155.38.
Australia’s All Ordinaries Index extends gains
Asian stock indices are mostly higher today. Nikkei gave up earlier gains ending 0.2% lower at 21375.25 with yen resuming its slide against the dollar. Markets in Hong Kong and mainland China remained closed for a holiday. Australia’s All Ordinaries Index extended gains 0.7% as the Australian dollar renewed its slide against the greenback.
Brent futures prices are extending gains today. Prices rose on Friday buoyed by Baker Hughes report the number of active US oil rigs fell by 3 to 710 last week: Brent for December settlement ended 1.1% higher at $58.37 a barrel Friday, posting 4.4% loss for the week.
Note: This overview has an informative and tutorial character and is published for free. All the data, included in the overview, are received from public sources, recognized as more or less reliable. Moreover, there is no guarantee that the indicated information is full and precise. Overviews are not updated. The whole information in each overview, including opinion, indicators, charts and anything else, is provided only for familiarization purposes and is not financial advice or а recommendation. The whole text and its any part, as well as the charts cannot be considered as an offer to make a deal with any asset. IFC Markets and its employees under any circumstances are not liable for any action taken by someone else during or after reading the overview.
In a research report, Raymond James revisits and revises its Q3/19 projections on this company.
In an Oct. 1 note, Raymond James analyst Justin Jenkins reported that Valero Energy Corp.’s (VLO:NYSE) adherence to a disciplined strategy continues to drive strong performance in this challenging oil and gas environment.
Specifically, the manufacturer and marketer of transportation fuels and petrochemical products has been “improving returns in refining while growing in the higher value midstream and renewable segments that also support refining ops,” Jenkins pointed out. It also continues to maintain a strong balance sheet and return cash to shareholders.
However, Valero is facing various market headwinds, and as such, Raymond James slightly lowered its Q3/19 expectations for the company, Jenkins indicated.
For one, it reduced its Q3/19 earnings per share estimate to $1.30 from $1.50.
Two, for Valero’s Refining segment, Raymond James lowered its Q3/19 gross margin forecast to $9.69 per barrel from $9.79 in light of modest capture difficulty in the Midcontinental and North Atlantic regions.
Three, due to the expectation that higher feedstock costs will negatively impact margins, Raymond James now predicts a Q3/19 operating loss in the Ethanol segment of $28 million, the biggest change to its Valero model. This new figure compares to an $8 million revenue win in Q2/19.
On a positive note, Jenkins concluded that “H2/19 has thus far shaped up better than many had feared, and we continue to expect IMO 2020 to prove to be a solid tailwind for the group, with Valero a particular winner.”
Accordingly, Raymond James has left its Q4/19 and 2020 projections on Valero the same. Further, the financial services firm maintained its Outperform rating and $95 per share target price on the energy firm, whose stock is trading now at around $82.66 per share.
Disclosure: 1) Doresa Banning compiled this article for Streetwise Reports LLC and provides services to Streetwise Reports as an independent contractor. She or members of her household own securities of the following companies mentioned in the article: None. She or members of her household are paid by the following companies mentioned in this article: None. 2) The following companies mentioned in this article are billboard sponsors of Streetwise Reports: None. Click here for important disclosures about sponsor fees. 3) Comments and opinions expressed are those of the specific experts and not of Streetwise Reports or its officers. The information provided above is for informational purposes only and is not a recommendation to buy or sell any security. 4) The article does not constitute investment advice. Each reader is encouraged to consult with his or her individual financial professional and any action a reader takes as a result of information presented here is his or her own responsibility. By opening this page, each reader accepts and agrees to Streetwise Reports’ terms of use and full legal disclaimer. This article is not a solicitation for investment. Streetwise Reports does not render general or specific investment advice and the information on Streetwise Reports should not be considered a recommendation to buy or sell any security. Streetwise Reports does not endorse or recommend the business, products, services or securities of any company mentioned on Streetwise Reports. 5) From time to time, Streetwise Reports LLC and its directors, officers, employees or members of their families, as well as persons interviewed for articles and interviews on the site, may have a long or short position in securities mentioned. Directors, officers, employees or members of their immediate families are prohibited from making purchases and/or sales of those securities in the open market or otherwise from the time of the interview or the decision to write an article until three business days after the publication of the interview or article. The foregoing prohibition does not apply to articles that in substance only restate previously published company releases.
Disclosures from Raymond James, Valero Energy Corp., October 1, 2019
ANALYST INFORMATION
Analyst Holdings and Compensation: Equity analysts and their staffs at Raymond James are compensated based on a salary and bonus system. Several factors enter into the bonus determination including quality and performance of research product, the analyst’s success in rating stocks versus an industry index, and support effectiveness to trading and the retail and institutional sales forces. Other factors may include but are not limited to: overall ratings from internal (other than investment banking) or external parties and the general productivity and revenue generated in covered stocks.
The analyst Justin Jenkins, primarily responsible for the preparation of this research report, attest to the following: (1) that the views and opinions rendered in this research report reflect his or her personal views about the subject companies or issuers and that no part of the research analyst’s compensation was, is, or will be directly or indirectly related to the specific recommendations or views in this research report. In addition, said analyst(s) has not received compensation from any subject company in the last 12 months.
RAYMOND JAMES RELATIONSHIP DISCLOSURES Certain affiliates of the RJ Group expect to receive or intend to seek compensation for investment banking services from all companies under research coverage within the next three months.
Raymond James & Associates, Inc. makes a market in the shares of Valero Energy Corporation.
Raymond James & Associates received non-investment banking securities-related compensation from Valero Energy Corporation within the past 12 months.
Additional Risk and Disclosure information, as well as more information on the Raymond James rating system and suitability categories, is available here.
This morning PDS Biotechnology Corp. shares are trading 38% higher after reporting that it will enter into a clinical collaboration with Merck pairing the firm’s PDS0101 with KEYTRUDA for patients with recurrent or metastatic head and neck cancer and high-risk HPV16 infection.
Clinical-stage immuno-oncology company PDS Biotechnology Corp. (PDSB:NASDAQ), which states that it is pioneering the development of multi-functional immunotherapeutic products, today announced a modification of the clinical trial collaboration agreement with a subsidiary of Merck & Co. Inc. (MRK:NYSE) to evaluate the combination of the firm’s lead Versamune-based immunotherapy, PDS0101, with Merck’s anti-PD-1 therapy, KEYTRUDA (pembrolizumab), in a Phase 2 clinical trial. The company noted that the “planned clinical trial will now evaluate the efficacy and safety of the combination as a first-line treatment in patients with recurrent or metastatic head and neck cancer and high-risk human papillomavirus-16 (HPV16) infection and is expected to be initiated in Q1/20.” The exact details of the collaboration were not disclosed.
The company explains that the “modification to the clinical trial design now allowing evaluation of PDS0101 in combination with KEYTRUDA as first-line treatment comes as a result of Merck’s recent approval by the FDA on June 10, 2019, for KEYTRUDA as monotherapy in patients whose tumors express PD-L1 (CPS ≥1) or in combination with platinum and fluorouracil (FU) for the first-line treatment of patients with metastatic or with unresectable, recurrent head and neck squamous cell carcinoma.”
Dr. Lauren V. Wood, PDS’s chief medical officer, commented, “We are honored to collaborate with Merck, a proven leader in the field of immuno-oncology to evaluate novel investigational combination therapies that have the potential to further improve the lives of cancer patients…The recently updated clinical outcome findings of the PDS0101 phase 1 human clinical trial demonstrate unique in-vivo systemic induction of high levels of granzyme-b inducing HPV-specific killer T-cells associated with observed clinical responses (regression/elimination of pre-cancerous lesions) in the majority of evaluable patients treated with PDS0101 monotherapy, and a lack of dose limiting toxicities at all tested doses as reported in PDS’s September 19, 2019, press release.“
PDS Biotechnology’s lead product candidate, PDS0101 (Versamune-HPV) is a “proprietary clinical stage immunotherapeutic administered by subcutaneous injection being developed to treat HPV-associated cancers. These include cancers such as head and neck cancers and anal cancers, both of which are widely reported to be increasing in frequency over the last decade, and cervical cancer.”
PDS Biotech’s Versamune platform is a proprietary, synthetic lipid-based T-cell activating platform. PDS Biotechnology’s pipeline of Versamune-based products, which are administered by subcutaneous injection, provides strong activation of type I interferon genes. The Versamune mechanism of action also involves effective presentation of tumor antigens via the MHC Class I and Class II pathways. These mechanisms together promote strong in-vivo induction of polyfunctional tumor-targeting CD8+ T-cells. Versamune-based immunotherapies have been demonstrated to alter the tumor micro-environment in preclinical mechanism of action studies, thus further enhancing the ability of Versamune-induced T-cells to effectively kill tumor cells.
Just a few days ago PDS Biotechnology announced that it will “prioritize clinical development of PDS0101 in advanced cancers following its recent reporting of promising Phase 1 clinical trial outcome data” from a Phase 1 study of PDS0101 in patients with cervical intraepithelial neoplasia (CIN) infected with multiple high-risk, cancer-causing types of human papillomavirus (HPV). The firm advised that the study demonstrated “robust treatment-induced HPV16-specific killer T-cell (CD8+) responses as well as clearance of the disease and regression of lesions in 60% of patients. These in-vivo PDS0101-induced T-cells were demonstrated to induce granzyme-b thus confirming their cytolytic/killing potency.” The company states that this clinical data supports the superior CD8+ T-cell induction and anti-tumor efficacy of its Versamune platform, as published based on the results of preceding preclinical studies in the June 2019 issue of the Journal of Immunology.
Dr. Frank Bedu-Addo, CEO of PDS stated, “Our intent is to continue to advance our previously announced combination studies with PDS0101 in various advanced HPV-associated cancers. These phase 2 clinical studies are partnered with top leaders in the field. We also intend to rapidly progress PDS0102 (targeting prostate and breast cancers), PDS0103 (targeting colon, lung, ovarian cancers) and PDS0104 (targeting melanoma) into human clinical trials in combination with checkpoint inhibitors. This approach has been recently supported by promising Phase 1 clinical outcome data…The unique ability of PDS0101 to promote in-vivo induction of high levels of CD8+ T-cells overcomes a significant limitation of many current immunotherapy approaches such as checkpoint inhibitors.”
The report indicated that as a result of the recent data showing strong CD8+ T-cell induction and the subsequent decision to prioritize the platform’s application in combination therapies addressing advanced cancer, the company no longer anticipates starting a Phase 2 study to evaluate PDS0101 monotherapy in CIN2/3 as previously reported.
PDS Biotechnology describes itself as a clinical stage immuno-oncology company with a growing pipeline of clinical-stage immunotherapies to treat various HPV-associated cancers, including head and neck cancer, cervical and anal cancers. All of PDS’s products are based on the proprietary Versamune platform technology, which activates and directs the human immune system to unleash a powerful and targeted attack against cancer cells. The firm’s PDS0101 includes the Versamune immune-activating platform and a mixture of HPV16 E6 and E7 peptide antigens designed to induce cytolytic T-cell responses against HPV expressed in patients with HPV-associated cancers.
PDS Biotechnology started the day with a market capitalization of about $15.8M. The company has 5.279 million shares outstanding. The stock has a 52-week price range of $3.0023.60/share. This morning, PDSB shares opened at $3.50 (+$0.50, +16.67%) over yesterday’s $3.00 closing price. The stock has traded today between $3.41 and $5.11/share and is currently trading at $4.14 (+$1.14, +38.00%).
Disclosure: 1) Stephen Hytha compiled this article for Streetwise Reports LLC and provides services to Streetwise Reports as an independent contractor. He or members of his household own securities of the following companies mentioned in the article: None. He or members of his household are paid by the following companies mentioned in this article: None. 2) The following companies mentioned in this article are billboard sponsors of Streetwise Reports: None. Click here for important disclosures about sponsor fees. 3) Comments and opinions expressed are those of the specific experts and not of Streetwise Reports or its officers. The information provided above is for informational purposes only and is not a recommendation to buy or sell any security. 4) The article does not constitute investment advice. Each reader is encouraged to consult with his or her individual financial professional and any action a reader takes as a result of information presented here is his or her own responsibility. By opening this page, each reader accepts and agrees to Streetwise Reports’ terms of use and full legal disclaimer. This article is not a solicitation for investment. Streetwise Reports does not render general or specific investment advice and the information on Streetwise Reports should not be considered a recommendation to buy or sell any security. Streetwise Reports does not endorse or recommend the business, products, services or securities of any company mentioned on Streetwise Reports. 5) From time to time, Streetwise Reports LLC and its directors, officers, employees or members of their families, as well as persons interviewed for articles and interviews on the site, may have a long or short position in securities mentioned. Directors, officers, employees or members of their immediate families are prohibited from making purchases and/or sales of those securities in the open market or otherwise from the time of the interview or the decision to write an article until three business days after the publication of the interview or article. The foregoing prohibition does not apply to articles that in substance only restate previously published company releases. 6) This article does not constitute medical advice. Officers, employees and contributors to Streetwise Reports are not licensed medical professionals. Readers should always contact their healthcare professionals for medical advice.
The deal and the assets are described in a ROTH Capital Partners report.
ROTH Capital Partners analyst John White reported that Contango Oil & Gas Co. (MCF:NYSE.MKT) agreed to acquire the assets of White Star Petroleum for $132.5 million.
The assets include production of 15,000 barrels of oil equivalent per day (15,000 boe/d) and 20 million barrels of oil equivalent of Proven Developed Producing reserves and 315,000 net acres in the STACK play, the general Anadarko Basin and the Cherokee Basin, in Oklahoma. The amount of total reserves was not disclosed.
White highlighted that this is a “very large acquisition” by Contango. Adding production from the White Star assets to Contango’s existing production (5,482 boe/d) would result in estimated total production of about 21,800 boe/d.
It’s unknown whether the oil and gas properties Contango is acquiring are nonconventional or conventional or a combination thereof, White noted but added that ROTH suspects all are conventional and mature. “Compared to predominately shale play metrics, the properties are being acquired on a very inexpensive valuation,” he added. “Our coverage of predominately shale play companies recently traded at a median flowing boe/d of $36,084.”
ROTH has a $1.45 per share target price on Contango, whose current share price is around $2.61. “Although the shares are at a level which fits ROTH’s Sell rating definition, we rate the shares Neutral while we await more details on the recently announced acquisition,” White explained.
Disclosure: 1) Doresa Banning compiled this article for Streetwise Reports LLC and provides services to Streetwise Reports as an independent contractor. She or members of her household own securities of the following companies mentioned in the article: None. She or members of her household are paid by the following companies mentioned in this article: None. 2) The following companies mentioned in this article are billboard sponsors of Streetwise Reports: None. Click here for important disclosures about sponsor fees. 3) Comments and opinions expressed are those of the specific experts and not of Streetwise Reports or its officers. The information provided above is for informational purposes only and is not a recommendation to buy or sell any security. 4) The article does not constitute investment advice. Each reader is encouraged to consult with his or her individual financial professional and any action a reader takes as a result of information presented here is his or her own responsibility. By opening this page, each reader accepts and agrees to Streetwise Reports’ terms of use and full legal disclaimer. This article is not a solicitation for investment. Streetwise Reports does not render general or specific investment advice and the information on Streetwise Reports should not be considered a recommendation to buy or sell any security. Streetwise Reports does not endorse or recommend the business, products, services or securities of any company mentioned on Streetwise Reports. 5) From time to time, Streetwise Reports LLC and its directors, officers, employees or members of their families, as well as persons interviewed for articles and interviews on the site, may have a long or short position in securities mentioned. Directors, officers, employees or members of their immediate families are prohibited from making purchases and/or sales of those securities in the open market or otherwise from the time of the interview or the decision to write an article until three business days after the publication of the interview or article. The foregoing prohibition does not apply to articles that in substance only restate previously published company releases.
Disclosures from ROTH Capital Partners, Contango Oil & Gas Company, Flash Note, September 27, 2019
Regulation Analyst Certification (“Reg AC”): The research analyst primarily responsible for the content of this report certifies the following under Reg AC: I hereby certify that all views expressed in this report accurately reflect my personal views about the subject company or companies and its or their securities. I also certify that no part of my compensation was, is or will be, directly or indirectly, related to the specific recommendations or views expressed in this report.
ROTH makes a market in shares of Contango Oil & Gas Company and as such, buys and sells from customers on a principal basis.
Shares of Contango Oil & Gas Company may be subject to the Securities and Exchange Commission’s Penny Stock Rules, which may set forth sales practice requirements for certain low-priced securities.
ROTH Capital Partners, LLC expects to receive or intends to seek compensation for investment banking or other business relationships with the covered companies mentioned in this report in the next three months.
The drill results are relayed and interpreted in a Haywood report.
In a Sept. 27 research note, Haywood analyst Geordie Mark reported that Luminex Resources Corp. (LR:TSX.V; LUMIF:OTCMKTS) continues to show continuity of high-grade epithermal gold mineralization at its Condor gold-copper project in Ecuador.
Mark reviewed results from the latest two holes, CC19-07 and CC19-08, drilled in the Camp zone of this gold-copper asset. CC19-07 tested the system’s north to northwest margin, and both tested the continuity of mineralization between holes CC19-06 and CC19-01.
Hole CC19-08, south of CC19-07, returned the most significant result. It showed an intercept of 22 meters (22m) of 3.61 grams per ton (3.61 g/t) gold and 28.5 g/t silver, at a 340m depth. Another notable intercept was in an upper gold zone, 62m of 0.55 g/t gold and 3.9 g/t silver, at a 76m depth.
As for CC19-07, it showed that the interpreted offsetting structure is located west to northwest and more proximal to CC19-05. The “most impressive” intercept from CC19-07, Mark highlighted, was 12.3m of 2.53 g/t gold and 5.5 g/t silver.
Results are pending from holes CC19-12 and CC19-13, which “we are particularly interested in,” noted Mark.
The system remains open laterally and at depth. Luminex will continue drilling throughout the rest of 2019.
Mark concluded, “Given these results and the proximity of the Camp zone to neighboring targets such as Los Cuyes, Soledad and Emma, Luminex appears well positioned to expand the scale of its global resource base in the northern portion of the Condor project, which we believe places the company in a position to test further the geological potential of the collective zones of epithermal gold-silver mineralization prior to advancing engineering.”
Haywood does not have a rating or target price on Luminex. The company’s stock is currently trading at around CA$0.85 per share.
Disclosure: 1) Doresa Banning compiled this article for Streetwise Reports LLC and provides services to Streetwise Reports as an independent contractor. She or members of her household own securities of the following companies mentioned in the article: None. She or members of her household are paid by the following companies mentioned in this article: None. 2) The following companies mentioned in this article are billboard sponsors of Streetwise Reports: None. Click here for important disclosures about sponsor fees. 3) Comments and opinions expressed are those of the specific experts and not of Streetwise Reports or its officers. The information provided above is for informational purposes only and is not a recommendation to buy or sell any security. 4) The article does not constitute investment advice. Each reader is encouraged to consult with his or her individual financial professional and any action a reader takes as a result of information presented here is his or her own responsibility. By opening this page, each reader accepts and agrees to Streetwise Reports’ terms of use and full legal disclaimer. This article is not a solicitation for investment. Streetwise Reports does not render general or specific investment advice and the information on Streetwise Reports should not be considered a recommendation to buy or sell any security. Streetwise Reports does not endorse or recommend the business, products, services or securities of any company mentioned on Streetwise Reports. 5) From time to time, Streetwise Reports LLC and its directors, officers, employees or members of their families, as well as persons interviewed for articles and interviews on the site, may have a long or short position in securities mentioned. Directors, officers, employees or members of their immediate families are prohibited from making purchases and/or sales of those securities in the open market or otherwise from the time of the interview or the decision to write an article until three business days after the publication of the interview or article. The foregoing prohibition does not apply to articles that in substance only restate previously published company releases.
Disclosures from Haywood Securities, Luminex Resources Corp., Exploration Update, September 27, 2019
Analyst Certification: I, Geordie Mark, hereby certify that the views expressed in this report (which includes the rating assigned to the issuers shares as well as the analytical substance and tone of the report) accurately reflect my/our personal views about the subject securities and the issuer. No part of my/our compensation was, is, or will be directly or indirectly related to the specific recommendations.
Important Disclosures
Important Disclosures:
▪ As of the end of the month immediately preceding this publication either Haywood Securities, Inc., one of its subsidiaries, its officers or directors beneficially owned 1% or more of Luminex Resources Corp. (LR-V).
▪ Haywood Securities, Inc. has reviewed lead projects of Lundin Gold Inc. (LUG-T) and a portion of the expenses for this travel may have been reimbursed by the issuer.
▪ Haywood Securities Inc. or an Affiliate has received compensation for investment banking services from Lundin Gold Inc. (LUG-T) in the past 12 months.v
Other material conflict of interest of the research analyst of which the research analyst or Haywood Securities Inc. knows or has reason to know at the time of publication or at the time of public appearance: n/a.
This week – October 6 through October 12 – central banks from 5 countries or jurisdictions are scheduled to decide on monetary policy: Israel, Uganda, Serbia, Peru and Sri Lanka.
Following table includes the name of the country, the date of the next policy decision, the current policy rate, the result of the last policy decision, the change in the policy rate year to date, and the rate one year ago.
The table is updated when the latest decisions are announced and can always accessed by clicking on This Week.
Welcome to this week’s Market Wrap Podcast, I’m Mike Gleason.
Coming up Craig Hemke of the TF Metals Report joins me for an explosive conversation on a range of topics. Find out whether Craig believes we’re going to have a repeat of 2010 – when metals took off – or if it’ll be more like 2016 – when metals had a false breakout before pulling back. He also calls out Elliot Wave chartists and why he thinks you are doing yourself a great disservice if you are following these “buffoons,” as he calls them. So, don’t miss an eye-opening interview with Craig Hemke, coming up after this week’s market update.
Gold and silver markets are off to a strong start in the early goings of the fourth quarter. After getting through some end-of-Q3 selling on Monday, the precious metals proceeded to post gains in the first three trading days of October.
As of this Friday recording, gold prices come in at $1,509 per ounce, up 0.7% for the week. Silver is unchanged week over week to come in at $17.61 an ounce. Platinum is off 5.6% to trade at $882. And finally, palladium prices are off slightly at $1,688, a 0.2% decline now since last Friday’s close.
While the platinum group metals struggle for the time being, gold and silver are proving to be effective safe havens from stock market volatility. The Dow Jones Industrials Average swung more than 1,000 points this week from high to low. Disappointing manufacturing data stoked investor concerns about an economic slowdown.
In turn, the U.S. Dollar Index dropped as futures markets reflected a big jump in the odds of another Federal Reserve rate cut later this month. It’s hard to believe that just a year ago, the financial media were talking about how many times the Fed would hike. Rate cuts weren’t even on the table for 2019.
Now, not only are central bankers cutting, they are also massively expanding their balance sheet in order to prop up the repo market on a daily basis. Clearly not all is well in the world of banking and finance.
Perhaps Jerome Powell and company will succeed in getting out in front of the liquidity problems plaguing big banks. But the prospect of ongoing emergency interventions, and the apparent inevitability of further interest rate reductions, may help stimulate investor demand for hard money in the final three months of the year.
Although investment demand for physical precious metals is showing some signs of picking up, it remains soft compared to what it was a few years ago. The public remains complacent to risks in financial markets and skeptical of holding bullion as an alternative.
Surprising as it may seem to those of us who view owning some gold and silver outside of the financial system as common sense, lots of investors don’t understand the first thing about precious metals. They don’t know where to buy them, or what to do with them, or what the point of owning them even is.
They understand stocks, bonds, and bank accounts – perhaps even cryptocurrencies. But for some reason they can’t grasp the least complicated and most enduring way to hold wealth.
It could be our lousy educational system, our biased financial media, our corrupt monetary system, or all three that are leaving much of the public dangerously ignorant about sound money.
Perhaps, too, the bullion industry needs to do a better job of communicating the benefits and features of gold and silver ownership and combatting the myth of the “barbarous relic.”
Physical precious metals offer far more versatility than conventional paper assets in terms of what you can do with them. About all you can do with a stock or bond is sell it for cash, donate it, or in some cases borrow against it.
You can do all those things with bullion – and much more. Since precious metals exist outside of the financial system, they can serve many non-financial purposes.
Bullion coins and rounds can certainly be appreciated for their aesthetic qualities, which confer a pride in ownership and add a special sentimental value when given as gifts. Since gold and silver have near-universally recognized value, they can be used as money around the world in transactions with any willing party.
Gold and silver can also be used to achieve conventional financial goals such as estate planning and tax savings. Precious metals IRAs are a great way to shield gains from taxation.
Precious metals can be used as collateral to obtain loans with favorable terms. Money Metals Exchange is proud to play a leading role in helping people tap the hidden utility of gold and silver. And Money Metals Capital Group can now extend to you cash loans on gold, silver, platinum, or palladium bullion.
If you own at least $70,000 of precious metals and store them in the Class 3 vaulting facility operated by Money Metals Depository, you may be eligible for a loan of $50,000 or more.
Borrowing against your precious metals can be a more efficient way of accessing their buying power as compared to selling and facing transaction costs along with potential tax consequences.
To be sure, this strategy is not suitable for everyone. It’s only available for those with large holdings in our secure depository – and you must have an acceptable credit rating, agree to use loan proceeds for business or investment purposes only (rather than for personal or household needs), and don’t use loan proceeds to purchase additional precious metals for at least 30 days.
All that said, for some folks wanting to access liquidity, our metals-backed loan program is just another service that Money Metals provides… which other dealers do not.
Well now, without further delay, let’s get right to this week’s exclusive interview.
Mike Gleason: It is my privilege now to welcome back Craig Hemke of the TF Metals Report. Craig is a well-known name in the metals industry and runs one of the most highly respected websites in our space and provides some of the very best analysis on banking schemes, the flaws of Keynesian economics, and evidence of manipulation in the gold and silver markets that you will find anywhere.
Craig, welcome back, and thanks for joining us again. How are you today?
Craig Hemke: Mike, my friend, it’s always a pleasure. Thanks for the invite.
Mike Gleason: Absolutely. Love to get you back on and thanks for the time. Well, the recent smash in the metals prices was reminiscent to what we saw in the markets in 2016, at least in silver. Prices ran higher up to about $20 an ounce and then got hammered back down where they continued trading in a range between about $14 and $17 until this year’s breakout. Do you think we’ll see the metals once again be put back into their box here or do you think it will be different this time around? I guess that’s the million-dollar question for silver bugs, what do you think?
Craig Hemke: That’s the question everybody has to answer, right? Everybody has to answer that for themselves. Now, I have been, and then you and I have been discussing this all through the year, I’ve been forecasting this year to be like 2010. You recall those conversations, I’m sure Mike. Going back to late last year, all the talk was about rate hikes, right? And all the seven-figure sell side economists and analysts on Wall Street were talking about three to four rate hikes this year and I got in front of that and said, no, no, no. That’s not going to be the case. All the political uncertainty, economic uncertainty, trade wars, all this kind of stuff, it’s going to lead to a loss of confidence that ripples through the economy, not just at the individual level, but at the business level, and you get this slowdown. The central banks cannot afford a slowdown, which is why they’ve worked so hard to keep the plates spinning for 10 years.
So, therefore they were going to reverse policy. You’re going to get rate cuts instead of rate hikes. You’re going to get more QE as well and in the end it looks a lot like 2010 where we entered the year, everybody was talking about great the economy was and there was green shoots and it was a one off that financial crisis, and bliss and joy and rainbow and Skittles for everybody.
As it turned out there was some economic growth in 2010 until about the third quarter and then we began to slow. By the fourth quarter it was negative growth and we entered into a recession beginning in 2011. Of course, the Fed reverse policy, then began QE2. Anyway, anybody that’s been the metals for the last decade knows what happens next point. Well, anyway, we’re on the same path. Like you said, we’ve been trapped in a price range for about six years until we finally broke out back in May. And again, this is following along the path.
Now, here’s the thing. Is this 2010, or as you said, is it 2016 because ’16 saw many of the same underlying fundamentals, if you will. You had the Brexit thing, which is amazingly still talked about three years later, but 2016 was all about a slowing economy, interest rates just collapsing around the globe. We got over $10 trillion in negative yields for the first time and the 10-year note got down to about 1.9, 1.7% even got close to 1.5.
Everybody thought, “Okay, here we go. This is bad.” And gold was rallying, but then the economy recovered and then there was this theme put out there when Trump was elected that, “Oh, now things are going to be great and the dollar is going to soar and all this infrastructure spending and blah, blah, blah. The bond market’s going to burst all.” All that stuff which didn’t come to pass but it reversed everything in 2016. So, ultimately to answer your question, is this like 2016 or is it like 2010?
The bond market selloff last month got everybody worried that this was just like 2016. Interest rates started back up. Gold rolled over. But now here we are reality setting back in in October. We’ve had the PMIs this week which have shown both in the manufacturing and the service sectors, sharp, sharp slowdowns. We’re going to get an employment report on Friday which is likely to come in poor but you never know the way they fabricate the numbers. At any rate, the Fed is going to cut again later on this month. Probably going to have to cut again in December, so we’re not, in my opinion, headed back like we were in 2016. Instead we are headed forward like we were in 2010.
Mike Gleason: We wanted to talk about manipulation in the futures markets. You have been a leading voice on the topic for many years. For a long time people seemed to ignore the evidence or dismissed the whole thing as a few “boys just being boys.” Isolated traders trying here and there to rig a price in their favor. They mocked anyone sounding the alarm as conspiracy theorists. What’s amazing is that still hasn’t changed.
There have been several traders arrested or indicted. Banks have pleaded guilty. Evidence has come out of a scheme that involved multiple people on the trading desks of pretty much all of the major bullion banks. It went on for the better part of a decade and it involved thousands of traders. We know rookie traders underwent training from their superiors on how to cheat. The fact is this fraud was long running, wide ranging and pervasive. Now the Department of Justice may use RICO laws to prosecute these bankers because it was organized crime. What do you make of the people who are still claiming the futures markets are basically fair and honest?
Craig Hemke: Well, there’s a lot in your question that we probably need to talk about. I’ll get to the Baghdad Bob newsletter writers in a second. The RICO statutes are important because RICO statutes were written so that you could get the Don of the mafia family, not just the assassin. The Don might order Jimmy No Knees to go take out Frankie the Tongue and then he does. And then maybe Jimmy No Knees is the guy that gets prosecuted. Well, the RICO laws allow you to go after the Don and that’s what we’re seeing now. We had under guys, just simple vice presidents get convicted. And you’ve got this guy, Edmonds who’s now been convicted, but he hasn’t been sentenced yet. He’s obviously singing like a songbird and implicating his superiors. So, now the guys that have been indicted include this guy, Nowak, who was the head of precious metals trading for JPMorgan.
Eventually, this is probably going to lead up to Blythe Masters who was Nowak’s boss during the period in question that the Department of Justice has been looking at… and then even beyond there perhaps, but look at it, whatever, that’s fine… but where these Baghdad Bob types get lost, these traders, these Elliot wave counters, whatever, what they don’t understand is they just think gold is this thing, this dot that moves on the screen. And everybody cheats and everybody tries to spoof and help their trading desk and all that kind of stuff.
But man, gold and silver are different because these banks, the term you use is correct, they are bullion banks. What does that mean? They are the banks that are on the hook for maintaining the physical market in London. Everybody knows there’s no physical delivery in New York. This physical market, to what extent it’s actually physical, it’s not just unallocated gold getting shifted back and forth across the line in the vault, but they’re the ones that are responsible. They’re the one that are on the hook. They’re the ones that have the leases that they have to match up almost on a daily basis. And so where the conspiracy lies that just that none of these losers who just simply are generalists, that you know, they don’t understand these markets but they think they’re know-it-all because they have to convince their dupe subscribers that they’re know-it-alls.
What these guys miss out on is that the trading desks that JPMorgan in this example, trading desk worked hand in glove with the physical desk in London. That’s where the conspiracy is. So, say the physical desk in London has an order that they took a few weeks back and they’ve got to fill, they’ve got to get a ton, 50,000 ounces, whatever. And they’ve got to fill that order and they don’t have it, right? So they’ve got to go buy it. Well, first they got to get that metal shook free, so, they’ve got to convince somebody to sell, but at the same time they might want to save a few bucks when buying that metal and so they get the desk in New York to rig the price lower.
The guy in London calls up Michael Nowak and says, “Mike, hey, I really could use price down $10 from here. Could you take care of that for me?” Mike gets Edmonds on the phone. They start spoofing away, boom. And you get these waterfall declines where we all sit back and scratch your head going, wait a second. Who in their right mind sells 10,000 contracts in 30 seconds.
So anyway, to your newsletter writers, like you said, and you got, you know who these buffoons are. Look, they’ve got so much invested, they got their flag planted in the ground going back years saying, “Well, there’s no manipulation,” because if they admit there’s manipulation in any market, their subscribers are going to go, “Well what’s the point of your little wave counting service if there’s manipulation? Geez, what good is that?” So then they become like Baghdad Bob. I may be revealing my age here, but folks that were around 15 years ago and they remember the second Iraq war remember Baghdad Bob was that Iraqi defense ministry guy, right?
Mike Gleason: Sure. There’s nothing to see here, right? “Nothing to see.”
Craig Hemke: Right, exactly. There were all these, the American tanks are coming at him from every direction. Every morning he’d get up and say, “Oh no, everything’s fine. Don’t worry about it. We’re good. No, the great leader’s got everything under control.” Well, he was so vested in saying that it didn’t even matter how patently false that was. He was going to keep saying it because he couldn’t turn around at that point and that’s what these cats are doing.
Who cares? I mean, seriously, I can’t believe I’ve just wasted time talking about it. Who gives a darn what some of these guys have to say? It doesn’t matter. It doesn’t matter what some newsletter writer, Elliot wave counter says. It doesn’t. What matters going forward is that one, this news is getting out. The Department of Justice is on the case. The authorities in London are on the case.
Eventually, this is going to get to the point where it’s just no longer worth the trouble for the bullion banks to stay in this business. So we’re headed in that direction. Outside of that, what really matters is that the global economy’s in the tank. The U.S. economy continues to slow. The central bankers are reversing course, and this demand for gold in all its forms is only going to continue to grow in the months ahead.
Mike Gleason: Some of the recent news here over the last month has been the Fed’s work in the repo markets injecting billions and billions of dollars into that overnight lending market and it doesn’t seem like it’s had that much of an effect on the price in the various assets whether it’s the stock market, although it has taken it on the chin here this week, maybe it’s a lag effect there, but certainly metals have not rallied like you would have expected. What do you have to say about all that?
Craig Hemke: Well, there’s a little bit of that I guess on the safe haven, if you want to call it that bit in the bond market. And again, I can’t stress enough how important lower rates are and rising bond prices are to sustaining this rally in gold. Again, it was when the bond market kind of rolled over with a very sharp correction in early and mid-September, that gold rolled over too. And so getting the bond market chugging back in a bullish direction is important to getting gold chugging back as well. And there are some key technical levels that gold’s going to cross sometime before the end of the year that’s going to really generate its own bit of excitement. But at the end of the day it’s all about the bond market and so you’ve got these liquidity concerns and people worried about what this might mean until you get to kind of a safe-haven bid.
And we’re seeing the two-year note as an example, rally harder than the 10-year note. Now the 10 year’s all the way back down to 1.55. It was 1.90 at the last Fed meeting not even three weeks ago. The two-year note has fallen even further. It was 1.80 and now today is like 1.37. So, think about that… the Fed cuts, the Fed funds rate tries to say that they’re now neutral because at the time they cut the Fed funds to 1.90 and that’s what the 10-year was. The two year was 1.80. Basically you had a flat yield curve from overnight after 10 years. Well, in the two or three weeks since, you’ve got 1.90 Fed funds and now you’ve got 1.40 two-year and 1.50 for a 10 year.
That assures you, provided things don’t completely turn in the next couple of weeks, that assures you the Fed’s going to cut again at the next FOMC which is around about Halloween four weeks from now. In fact, the odds of that are now 92% but it also means you’re probably going to get another Fed cut in December. Well, you go back two weeks ago we were told the Fed’s now neutral and that was reason why gold was going to keep going lower and all this kind of stuff. Well it’s not.
Getting back to your original question, Mike, this liquidity thing is a real concern. The Fed with their policies over the last couple of years, has sparked a really kind of a dollar shortage crisis, if you will, and it’s revealing itself in all these different ways. One of them is this need now for almost a permanent repo facility. They are going to act to create more dollars to try to fend in this off because what else can they do? And again, you put all those pieces together and you realize, “Oh, you know what? I think I need to buy the dips because prices are going higher, not lower for gold.”
Mike Gleason: Speaking of that, what are some of those key technical levels that you’re looking for to maybe be taken out later in this, later in the year? What are you expecting for metals over the last quarter?
Craig Hemke: Well, on the daily chart, let’s start there, because we’ve had now a series of two lower highs and lower lows. There’s a trend line there that anybody can see. In fact, there’s a pennant on the daily chart that we bounced off the lower band back on Monday. First, we got to get above on a closing basis, probably $1,530 to 35. How soon that happens, anybody’s guess, but it’s going to happen. More important is that kind of the long-term look of these charts, explain that why in just a second. And the long-term it’s extremely positive. When you get a weekly close in the front month contract, which is now December, you get a weekly close above $1,550. Now we tried twice at the end of August and in early September and we traded above there intra week but we can never close above there.
The significance of closing above there is that level held as a floor for 19 months at the end of that previous bull market. And so a move back above $1,550 on a weekly closing basis would really open a lot of eyes. So, now to the point, why does that even matter? “Manipulation, that doesn’t matter. Make TA worthless,” and all that stuff. Yeah, look, you may think that, whatever, but I can assure you again we get back to these people that don’t think there’s any manipulation at all.
You think this is a regular hedge fund manager, institutional money manager, pension fund manager, whatever. They look at this stuff. They look at charts. They look at price trends. They look at the data they get on their screen at the end of every quarter, at the end of the year that says, “Here’s the best performing sector,” and then all of a sudden you look at chart and you go, “Wow, look at this. This gold, not only are the miners, is the best performing sector in the precious metals and hard assets doing great. Now look at the breakout on this chart back above $1,550… oh my gosh, I better start putting some money there.”
And it’s when that money starts to flow into the sector, all these trillions of dollars that have been created by the central banks in the last 10 years, we get just a little piece of that and we’re going to see things that are going to blow your doors off. And what I mean by that is, again, I’m sorry for these long-winded answers, Mike, but had too much coffee today. Here’s the thing. I got this little nugget from Rick Rule when I did a little panel with him, I don’t know, a couple months ago.
Everybody knows, you know, everybody hates the sector. You’ve seen the Grant Williams thing about how nobody cares, and everybody hates the sector and that’s absolutely true. Over the last 40 years, the amount of global asset allocation to the precious metals in all their forms, whether it’s the metals, the futures contracts, there weren’t ETFs 40 years ago, that kind of thing… but there were mining shares. It ranged from high of 8% back in 1980 to as low as one half of 1% really each of the last couple of years. Now you got to figure that’s about as low as going to go. The median is 2 1/2%.
No, I don’t know if we’ll get back, who knows, but let’s just say we do, just for fun. We go back to 2 1/2% global asset allocation, the precious metals, which doesn’t seem to be very much. We’re at one half of 1%. That would mean five times the investible assets, dollars, euro, yen, whatever looking for a home. Looking for an investment in the sector so they can get some exposure, whether that’s futures contracts, ETFs, unallocated metal, some mint or the mining share… you get five times the amount of cash chasing really a finite number of investment opportunities, prices are going to go up.
It doesn’t matter what your little wave counts says or some cycle or whatever, knock yourself out. You just get a wad of cash chasing a finite number of assets, prices go up. I mean that’s just how it works. And so there’s some importance to breaking these technical milestones. There’s importance in keeping this trend going because it begins to feed on itself. And that’s really what I expect to happen. Maybe not right away later this year, there’s only three months left, but certainly next.
Mike Gleason: Yeah. Obviously the self-fulfilling prophecy of the technical side of things, it matters because people think it matters as you say.
Craig Hemke: Yeah, no, that’s true. And see that’s the funny thing. Look, I do, you can call it technical analysis, really it’s more of a manipulation analysis because we know the banks use the technicals against the traders to try to flush them out by breaking a moving average or paint the chart with a head and shoulder top or whatever. But what’s so odd, and here I am talking about these wave counters again, but look, when I broke into the business in 1990 there was some validity to a technical analysis, maybe on a small scale because everybody was looking at the same charts and like you said, it becomes kind of a self-fulfilling thing. If everybody’s looking at the price in a pennant, in a wedge, in a moving average and all that kind of stuff in a small, little market and it breaks out and everybody moves at once then it kind of becomes self-fulfilling.
But, these guys still treat this technical analysis as if it all operates in a vacuum. I see on Twitter everyday people try to say, “Well, wave three of sub wave Z microwave X means that we’re going to go down to $1,330 (in gold).” I’m like, “Not if the bond market keeps rallying.” I mean these things don’t happen in a vacuum. They don’t happen independently. You can’t look at gold on the chart and go, “Well I’ve got this wave count and that’s it.” No, no.
If the employment report shows a contraction in jobs on Friday and the bond market rallies 10 basis points, it doesn’t matter what your silly little wave count said was going to happen. In 2020, man, with everything connected by computer and everything done by pre-programmed algo and all of this cash sloshing around the planet, and the central bank intervention and all this kind of stuff, you simply cannot use your little tools from 30 years ago to try to make predictions about where things are headed. It just doesn’t … I’m sorry. Here I am just ranting. I apologize, Mike.
Mike Gleason: No problem. It’s well put. It’s a different market now than it was a decade or two ago and people do need to recognize that. Well, we’ll leave it there for today, Craig. Thanks very much for your time. Before we go though, let’s hear more about the TF Metals Report and have you tell people what it is that they’ll find if they visit your site.
Craig Hemke: Well, thank you Mike. It’s really a community like none other in that we’ve got people from all around the world, of all different political stripes, and net worth categories and all that kind of stuff. But we all interact. The first rule of the site is treat others how you want to be treated, so it’s not like your standard website where people blast away and the trolls show up and just try light threads on fire and that kind of stuff.
And so the real value is the interaction amongst the members there. I do my analysis, my podcast every day, post every morning, and then to be a part of that it’s 12 bucks a month, so it’s 40 cents a day. So, it’s not like some exorbitant thing like these newsletter writers charge. And I want to stress, what’s really important here is that people need to understand how these things all relate here in 2019 and now heading into an election year and all that stuff and the efforts that the central banks have made since 2009 to make it appear that they’ve got control. To make it appear, “Oh, no, everything’s fine, man. The banks are all re-liquefied. Everything’s great.”
No, it’s not. No, it’s not. And it was all due to eventually come to an end and you can’t keep the plate spinning forever and that’s where we’re headed now. The economies are slowing globally and the central banks are going to react with the only tools that they know. That’s why gold is rallying. That’s why silver is eventually going to move to catch up. And it’s just vital that people understand this so that you don’t go, you don’t see $20 silver and think, “Yippee, I can finally sell all the silver I bought six years ago,” and what, get dollars for it? And then what are you going to do with those dollars, man? Every smart holder of dollar reserves in the world is selling dollars and buying hard assets. I’m talking like the Russian Central Bank and the Chinese and the Indians and the like. These are the kinds of things we talk about at TF Metals Report. And I think, like I said, if we can keep you focused on the big picture, then I think it’s worth the 40 cents a day.
Mike Gleason: Yeah, absolutely. Highly recommend it. We look at it very closely in our office here. It’s fantastic information. You have a great way of connecting those dots and showing people how things are so inter-related and connected and parsing through all that and I think people just heard that here in this discussion and I hope they’ll check it out.
Well, thanks again, Craig. Appreciate all the time. Have a great weekend. Keep up the great work there at TF Metals Report, and we’ll talk to you again down the road. Take care.
Craig Hemke: Mike, it’s my pleasure. I look forward to seeing where prices are the next time we talk.
Mike Gleason: Well, that will do it for this week, thanks again to Craig Hemke. The site is TFMetalsReport.com, definitely a fantastic source for all things precious metals and a whole lot more. We urge you to check that out so you can get some of the very best commentary on the metals markets that you will find anywhere.
And be sure to check back here next Friday for our next Weekly Market Wrap Podcast. Until then, this has been Mike Gleason with Money Metals Exchange. Thanks for listening and have a great weekend, everybody.
The Money Metals News Service provides market news and crisp commentary for investors following the precious metals markets.