Equities fell and safe havens made gains on Tuesday. In the backdrop, the US and China are set to resume the trade talks today.
However, moves from Washington suggest that the US will go ahead with restricting investments in China. This could potentially become a talking point as the trade talks resume.
China said that it strongly opposes the decision to blacklist some of the tech firms in China.
German Industrial Output Rebounds
Germany’s industrial output data for August surprised, rising 0.3% on the month. The data soothed concerns about a possible recession in the eurozone’s largest economy.
The increase also beat the estimates of a 0.2% increase from economists. Industrial production grew by 0.7%, while energy production fell 1.7%. Construction output was down 1.5% during the month.
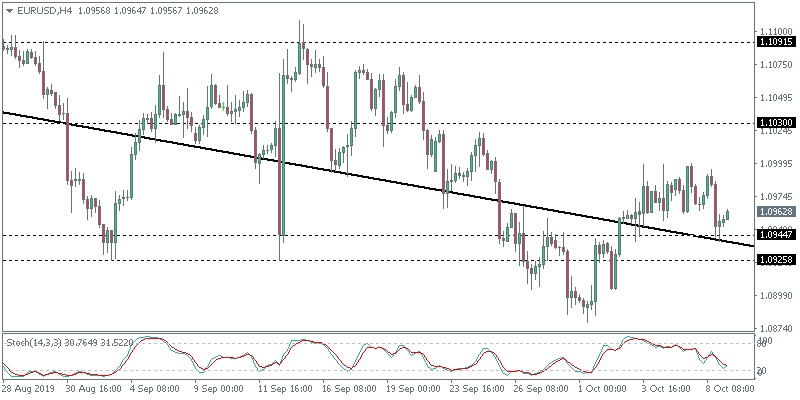
Can the EURUSD Rebound?
The common currency slipped largely due to the strength in the US dollar. Price action indicates that the pair is testing the support area of 1.0944.
A firm test of this support level could confirm the upside bias. The resistance area of 1.1091 remains the key target moving forward. However, if the support fails, the currency pair could see extending declines back to last week’s lows.
Sterling Slips as Brexit Talks Breakdown
The pound sterling fell on Tuesday after reports showed fading optimism on the newly proposed Brexit deal. The EU snubbed PM Johnson after he said that German Chancellor Angela Merkel made it difficult to strike a deal.
The move now potentially paves way for another possible extension to the October 31st deadline. Speculation is also rife that the UK could head for a snap election.
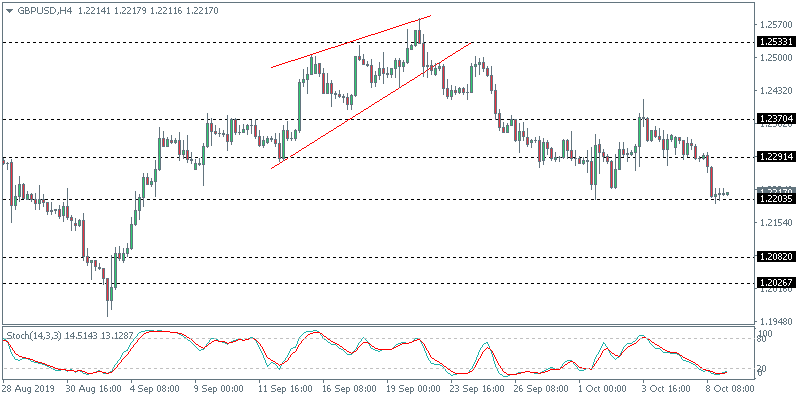
Can the GBPUSD Extend Declines Further?
The currency pair was largely trading flat into the start of this week. But Tuesday’s Brexit developments put further downside pressure. GBPUSD eventually broke to the downside from the range.
The currency pair is testing last week’s lows of 1.2203. Further declines are possible on a move lower. The next downside target is at 1.2082.
Oil Prices Slip as US-China Trade Talks Resume
Oil prices fell on Tuesday ahead of the US and China trade talks. The outlook remains grim for oil prices amid subdued demand.
Global growth is expected to slow which could put a lid on oil prices in the near term. Meanwhile, oil traders await the weekly crude oil inventory report. Oil inventories have been posting a build up over the past few weeks.
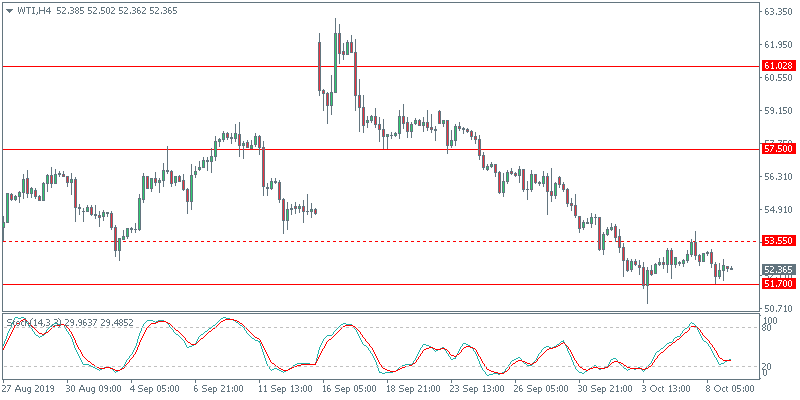
Will Oil Prices Continue to Fall?
WTI crude oil is testing the familiar support area of 51.70. The 4-hour Stochastics oscillator is pointing to a potential bullish divergence.
If there is a rebound, crude oil prices must rise above 53.55 to confirm the upside. The next main target will be the 57.50 level. Price action could rally to this level to reconfirm resistance.
As we can see in the H4 chart, after finishing the short-term correction and updating the local low, GBPUSD has reached 61.8% fibo. The next downside target is 76.0% fibo at 1.2108. If the pair is able to break this level, it may try to test the low at 1.1958 and once again enter the post-correctional extension area between 138.2% and 161.8% fibo at 1.2019 and 1.1788 respectively.
In the H1 chart, the pair is testing 61.8% fibo. Later, the price is expected to fall towards 76.0% fibo at 1.2108.
EURJPY, “Euro vs. Japanese Yen”
As we can see in the H4 chart, the convergence made EURJPY complete the descending wave at 61.8% fibo. The current situation may be considered as the start of another mid-term rising wave. However, one shouldn’t exclude a possibility of further decline towards 76.0% fibo at 116.86 in the short-term, but the main scenario implies that the price is expected to move upwards. The first rising impulse has already reached 23.6% fibo. After a slight pullback, the impulse may continue towards 38.2%, 50.0%, 61.8%, and 76.0% fibo at 118.19, 118.54, 118.89, and 119.30 respectively. The key target is the high at 120.01.
In the H1 chart, the price is falling to reach 23.6% fibo. After breaking the local low at 117.07, the mid-term descending tendency may continue towards 76.0% fibo at 116.86.
Attention! Forecasts presented in this section only reflect the author’s private opinion and should not be considered as guidance for trading. RoboForex LP bears no responsibility for trading results based on trading recommendations described in these analytical reviews.
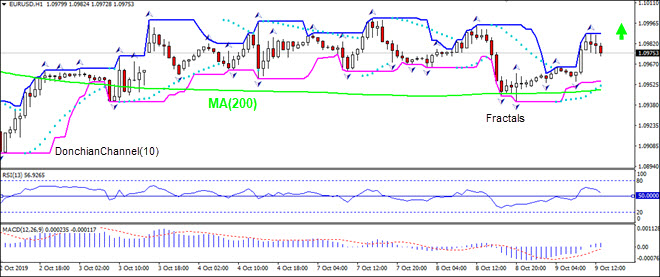
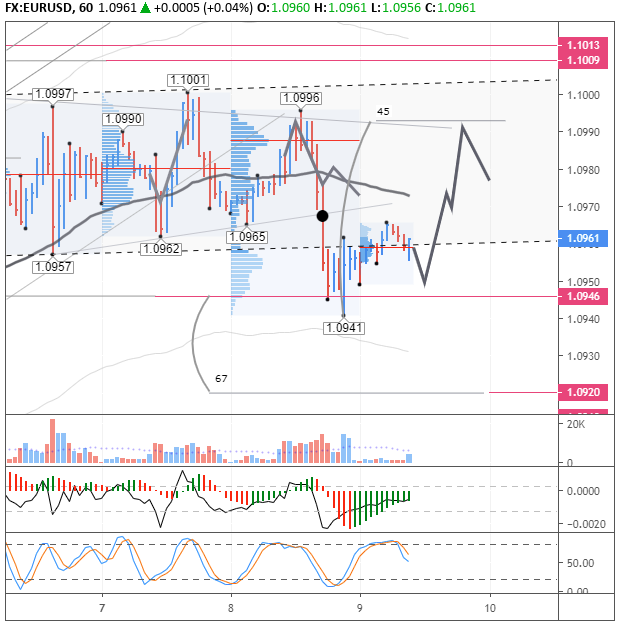
Better than expected German industrial output bullish for EURUSD
France’s trade balance deficit widened and Italy’s retail sales declined in August while Germany’s industrial output rose. Will the EURUSD rise?
The price chart on 1-hour timeframe shows EURUSD: H1 is in uptrend. The price is moving toward the 200-period moving average MA(200) which is rising. And the RSI is falling toward the 50 level.
The US dollar is stable against a basket of major currencies. The dollar index (#DX) closed yesterday’s trading session with a slight increase (+0.18%). Investors are focused on US-China trade relations. Earlier, the US backlisted some more Chinese technology firms, with which American business was not allowed to cooperate without special licenses. China, in turn, demanded from the United States to lift these restrictions. The United States added 28 companies to the list since these organizations were involved in discrimination against Uighurs, Kazakhs and other members of Muslim minority groups in China. The expansion of this list may adversely affect negotiations between the US and China.
At the same time, the US dollar is still under pressure after the speech by Fed Chairman Jerome Powell. According to him, the regulator is considering the possibility of purchases of treasury bills in order to increase the balance sheet to manage the reserves of the Fed. Powell also recognized the slowdown in employment growth and the risks to the US economy due to geopolitical events. Today, financial market participants will be focused on the publication of FOMC meeting minutes, which may indicate the further rate of the Fed’s monetary policy adjustment.
The British pound is declining against the US dollar due to the lack of progress on the Brexit issue. Yesterday, a meeting between the President of the European Parliament, David Sassoli, and British Prime Minister, Boris Johnson, was held. The EP President said that he had not heard any proposals that could promote Brexit.
The “black gold” prices have been growing. Futures for the WTI crude oil are currently testing the $52.85 mark per barrel. At 17:30, crude oil inventories will be published in the US.
Market Indicators
Yesterday, there was the bearish sentiment in the US stock markets: #SPY (-1.55%), #DIA (-1.19%), #QQQ (-1.50%).
The 10-year US government bonds yield is at the level of 1.54-1.55%.
The Economic News Feed for 09.10.2019:
– JOLTS job openings in the US at 15:30 (GMT+3:00);
– Publication of the FOMC meeting minutes at 21:00 (GMT+3:00).
Yesterday, the bearish sentiment prevailed on the EUR/USD currency pair. The trading tool has updated the local lows. EUR/USD quotes found support at 1.09450. Mark 1.09700 is already a “mirror” resistance. The focus on trade remains between the US and China. Hopes for a breakthrough in trade negotiations weakened even more after the introduction of new sanctions. Today, investors will evaluate the FOMC protocols, which can indicate the further rate of adjustment of the Fed’s monetary policy. More than 85% of participants in financial markets believe that the regulator will again reduce the range of key interest rates by 25 basis points to 1.50-1.75% at a meeting on October 30. We recommend opening positions from key levels.
The Economic News Feed for 09.10.2019:
– JOLTS report (US) – 17:00 (GMT+3:00);
– FOMC Minutes (US) – 21:00 (GMT+3:00);
Also, keep an eye on the speech by the head of Fed.
Indicators do not give accurate signals: 50 MA crossed 100 MA.
The MACD histogram is in the negative zone, but above the signal line, which gives a weak signal to sell EUR/USD.
Stochastic Oscillator is near the overbought zone, the %K line crossed the %D line. There are no signals at the moment.
Trading recommendations
Support levels: 1.09450, 1.09100, 1.08800
Resistance levels: 1.09700, 1.10000, 1.10250
If the price consolidates below 1.09450, expect a further descend of quotes toward 1.09000.
Alternatively, the quotes could grow toward 1.10000-1.10200.
The GBP/USD currency pair
Technical indicators of the currency pair:
Prev Open: 1.22886
Open: 1.22183
% chg. over the last day: -0.59
Day’s range: 1.22046 – 1.22264
52 wk range: 1.1995 – 1.3385
The GBP / USD currency pair went down again. Financial market participants are concerned about the growing risks of the “tough” Brexit. The country’s budget deficit may reach 4% of GDP if the UK leaves the union without concluding a deal. Currently, GBP is consolidating near the round level of 1.22000. 1.22400 is the nearest resistance. A trading instrument has the potential to further decline. Positions must be opened from key levels.
The Economic News Feed for 09.10.2019 is calm.
Indicators signal the strength of sellers: the price has fixed below 50 MA and 100 MA.
The MACD histogram is in the negative zone, but above the signal line, which gives a weak signal to sell GBP/USD.
The Stochastic Oscillator is in the neutral zone, the %K line crossed the %D line. There are no signals at the moment.
Trading recommendations
Support levels: 1.22000, 1.21500
Resistance levels: 1.22400, 1.22850, 1.23300
If the price consolidates below the round level of 1.22000, expect a further drop in GBP/USD quotes to 1.21600-1.21400.
Alternatively, the quotes could grow toward 1.22700-1.22900.
The USD/CAD currency pair
Technical indicators of the currency pair:
Prev Open: 1.33087
Open: 1.33216
% chg. over the last day: +0.09
Day’s range: 1.33110 – 1.33276
52 wk range: 1.2727 – 1.3664
The USD/CAD currency pair is being traded flat. There is no defined trend. Participants in financial markets expect additional drivers. At the moment, the local support and resistance levels are: 1.33100 and 1.33350, respectively. The focus is on the FOMC Minutes. We also recommend paying attention to the dynamics of oil quotes. Positions must be opened from key levels.
The news background on the Canadian economy is calm.
Indicators do not give accurate signals: the price crossed 50 MA and 100 MA.
The MACD histogram is near 0.
The Stochastic Oscillator is near the oversold zone, the %K line crossed the %D line. There are no signals at the moment.
Trading recommendations
Support levels: 1.33100, 1.32900, 1.32700
Resistance levels: 1.33350, 1.33500
If the price consolidates above 1.33350, expect further growth toward 1.33600-1.33800.
Alternatively, the quotes could decrease toward 1.32900-1.32700.
The USD/JPY currency pair
Technical indicators of the currency pair:
Prev Open: 107.243
Open: 107.070
% chg. over the last day: -0.33
Day’s range: 106.933 – 107.214
52 wk range: 104.97 – 114.56
An ambiguous technical picture has developed on the USD/JPY currency pair. The trading instrument is in lateral movement. At the moment, the local support and resistance levels are: 106.850 and 107.250, respectively. USD/JPY quotes can decline. Investors expect FOMC protocols. We also recommend monitoring the progress of trade negotiations between the United States and China. Positions must be opened from key levels.
The Economic News Feed for 09.10.2019 is calm.
Indicators do not give accurate signals, the price crossed 50 MA and 200 MA.
The MACD histogram is near 0.
Stochastic Oscillator has started to leave the overbought zone, the %K line is below the %D line, which indicates a bearish sentiment.
Trading recommendations
Support levels: 106.850, 106.600
Resistance levels: 107.250, 107.450, 107.700
If the price consolidates below 106.850, expect the quotes to fall toward 106.500-106.300.
Alternatively, the quotes will grow toward 107.600-107.800.
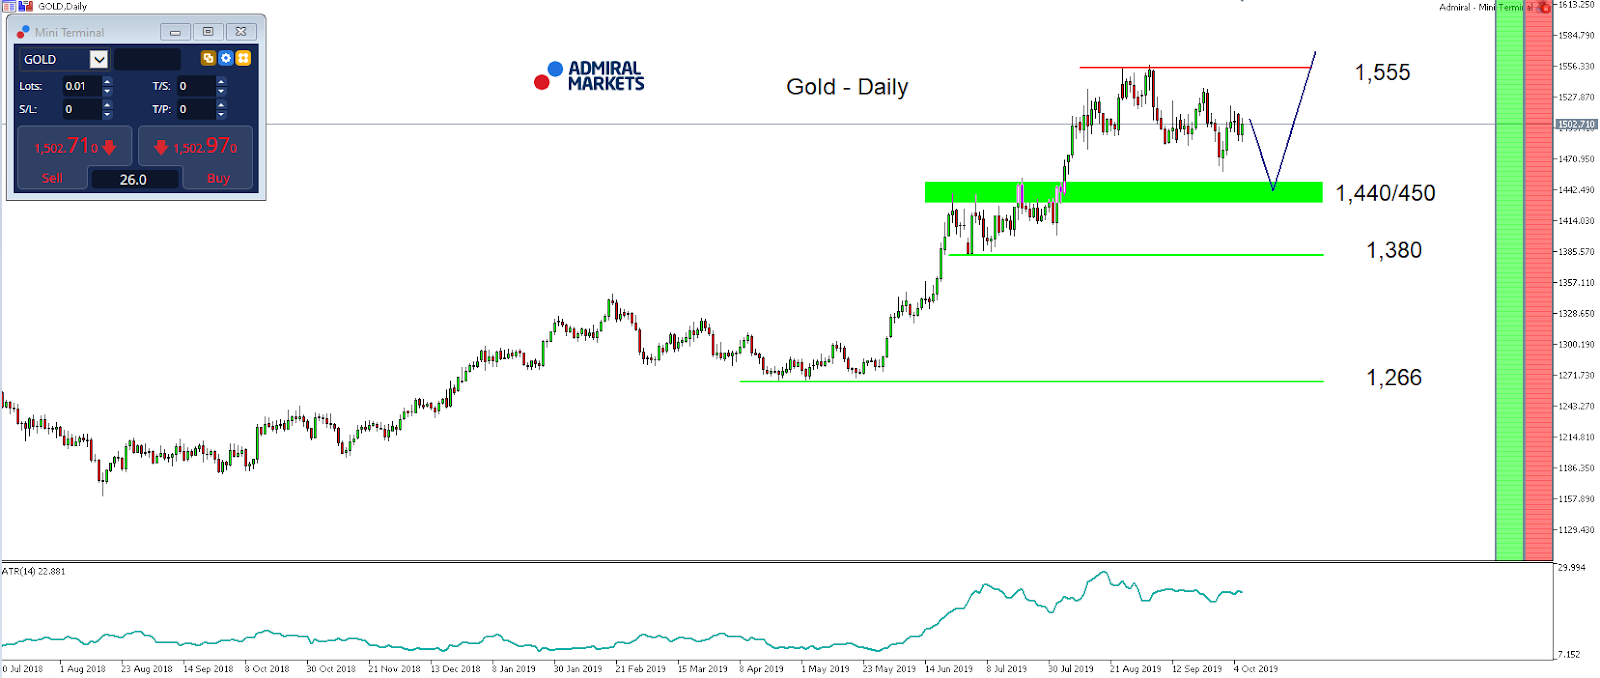
We want to have a look at Gold today, in the context of the release of the FOMC Minutes for the Fed’s September meeting.
After Gold broke below 1,480 USD on Monday last week, and it closed above 1,500 USD after a series of bad US economic data releases last week. Namely, the ISM Manufacturing and ISM Non-Manufacturing index disappointed market participants and resulted in rising recession fears, while Friday’s Non-Farm Payrolls came in mixed.
With these developments in mind, Gold traders will closely watch the Fed Minutes and search for any signs of further monetary stimulus not only at the upcoming meeting, but also in December.
All in all, our outlook for Gold stays positive – also in the days, weeks and months to come.
That said, we still see our mid-term target around 1,650/700 USD being active and even if we see a stint below last week lows around 1,460 USD (e.g. based on a neutral interpretation of the statement or the Fed members clearly emphasizing that they consider only one 25 basis point in 2019 as necessary), a potential mid-term long trigger is still found around 1,440/450 USD:
Source: Admiral Markets MT5 with MT5-SE Add-on Gold Daily chart (between July 10, 2018, to October 8, 2019). Accessed: October 8, 2019, at 10:00pm GMT – Please note: Past performance is not a reliable indicator of future results, or future performance.
In 2014, the value of Gold fell by 1.7%, in 2015, it fell by 10.4%, in 2016, it increased by 8.1%, in 2017, it increased by 13.1%, in 2018, it fell by 1.6%, meaning that after five years, it was up by 6.4%.
Discover the world’s #1 multi-asset platform
Admiral Markets offers professional traders the ability to trade with a custom, upgraded version of MetaTrader 5, allowing you to experience trading at a significantly higher, more rewarding level. Experience benefits such as the addition of the Market Heat Map, so you can compare various currency pairs to see which ones might be lucrative investments, access real-time trading data, and so much more. Click the banner below to start your FREE download of MT5 Supreme Edition!
Disclaimer: The given data provides additional information regarding all analysis, estimates, prognosis, forecasts or other similar assessments or information (hereinafter “Analysis”) published on the website of Admiral Markets. Before making any investment decisions please pay close attention to the following:
This is a marketing communication. The analysis is published for informative purposes only and are in no way to be construed as investment advice or recommendation. It has not been prepared in accordance with legal requirements designed to promote the independence of investment research, and that it is not subject to any prohibition on dealing ahead of the dissemination of investment research.
Any investment decision is made by each client alone whereas Admiral Markets shall not be responsible for any loss or damage arising from any such decision, whether or not based on the Analysis.
Each of the Analysis is prepared by an independent analyst (Jens Klatt, Professional Trader and Analyst, hereinafter “Author”) based on the Author’s personal estimations.
To ensure that the interests of the clients would be protected and objectivity of the Analysis would not be damaged Admiral Markets has established relevant internal procedures for prevention and management of conflicts of interest.
Whilst every reasonable effort is taken to ensure that all sources of the Analysis are reliable and that all information is presented, as much as possible, in an understandable, timely, precise and complete manner, Admiral Markets does not guarantee the accuracy or completeness of any information contained within the Analysis. The presented figures refer that refer to any past performance is not a reliable indicator of future results.
The contents of the Analysis should not be construed as an express or implied promise, guarantee or implication by Admiral Markets that the client shall profit from the strategies therein or that losses in connection therewith may or shall be limited.
Any kind of previous or modeled performance of financial instruments indicated within the Publication should not be construed as an express or implied promise, guarantee or implication by Admiral Markets for any future performance. The value of the financial instrument may both increase and decrease and the preservation of the asset value is not guaranteed.
The projections included in the Analysis may be subject to additional fees, taxes or other charges, depending on the subject of the Publication. The price list applicable to the services provided by Admiral Markets is publicly available from the website of Admiral Markets.
Leveraged products (including contracts for difference) are speculative in nature and may result in losses or profit. Before you start trading, you should make sure that you understand all the risks.
On Tuesday the 8th of October, trading on the euro closed down. The pair fell to 1.0941 from a high of 1.0996 (-55 pips). The bulls were propped up by the rise on the EURGBP cross in the first half of the day. Traders abandoned the pound in favour of the euro on the back of Brexit news. Once the effects of that news subsided, the euro tanked against the US dollar amid increased tensions between the US and China.
On Monday, the US Department of Commerce blacklisted 28 Chinese companies, which will prevent US companies from working with them without a special licence. The Trump Administration is considering the possibility of limiting the flow of capital into China. Investors reacted badly to this ahead of an important meeting between leaders of the two countries embroiled in the trade conflict.
Expectations of a drop on the euro were met in full. The rate dropped below the lower line of the channel. The bears first broke through 1.0968 before gaining a foothold below 1.0959. The euro is currently trading at 1.0959. In the Asian session, the pair returned to the channel. The boundaries have widened, so there’s a chance that the bulls could try to return to 1.0992 (45th degree).
Trade negotiations between the US and China continue to take centre stage. Markets are already braced for their collapse and for Trump to give the order to raise tariffs on Chinese goods to 25% next week.
If there are no developments on this today, keep an eye on Powell’s speech and the FOMC minutes, taking place at 18:00 and 21:00 (GMT+3) respectively.
Asian stocks followed their US counterparts lower, as investors grow increasingly concerned over an apparent rise in US-China tensions ahead of the high-level trade talks in Washington. So far this week, the US administration has issued travel-visa bans on Chinese officials, while placing eight major Chinese tech companies on a blacklist. Such developments are solidifying the already-tense sentiment in the markets, as investors eagerly await the outcome from the US-China trade negotiations in the coming days.
Recent events surrounding US-China ties threaten to raise new points of conflict beyond just trade differences. A wider scope in this protracted conflict would only heighten the barriers to a meaningful reconciliation between the world’s two economic powerhouses, while prolonging its drag on the global growth outlook. Risk aversion shall continue being the de facto mode for global investors, which should bode well for safe haven assets, keeping gold above $1500.
FOMC minutes and September US CPI release could sway Dollar, Fed rate outlook
The Dollar index is set to face two potential catalysts for near-term moves: the US CPI print and the FOMC minutes. With Fed chair Jerome Powell having recently indicated his preference for inflation to run a little higher, such comments appear to pave the way for another reduction in US interest rates. An October Fed rate cut has already been priced in, as investors remain on the lookout for more telling signs whether to expect another 25-basis point cut in December.
Overall, the Dollar is expected to remain resilient for the rest of the year, with investors flocking to safe haven assets amid a deteriorating global economic outlook. Barring a rapid weakening of global economic headwinds, the Greenback is likely to maintain its appeal as the US economy fares better compared to its peers.
Pound’s near-term gains to be transient as long as no-deal Brexit remains a possibility
The Pound bounced off the 1.22 line against the US Dollar, following reports that Brexit talks are breaking down. With just three weeks remaining before the October 31 deadline, markets cannot yet fully rule out a no-deal Brexit. The likelihood of such a cataclysmic event is deterring traders from sending Sterling significantly higher.
Using the glass-half-full perspective, the fact that the latest decline in GBPUSD appears halted at the 1.22 level indicates that some segments of the markets are still holding out hope that a no-deal Brexit could yet be averted. Prime Minister Boris Johnson’s willingness to let the UK crash out of the EU without a deal at the end of this month appears mitigated by Westminster’s efforts to prevent it from happening. The ever-fluid Brexit saga is expected to leave the Pound exposed to politically-driven bouts of volatility over the coming weeks.
Disclaimer: The content in this article comprises personal opinions and should not be construed as containing personal and/or other investment advice and/or an offer of and/or solicitation for any transactions in financial instruments and/or a guarantee and/or prediction of future performance. ForexTime (FXTM), its affiliates, agents, directors, officers or employees do not guarantee the accuracy, validity, timeliness or completeness, of any information or data made available and assume no liability as to any loss arising from any investment based on the same.
Dollar strengthens despite Fed plan to expand balance sheet
US stocks logged back to back losses on lowered trade talk expectations after reports China Vice Premier Liu He arriving on Thursday will not represent his government as a “special envoy” and the delegation will leave the United States on October 11 rather than October 12. The S&P 500 fell 1.6% to 2893.06. Dow Jones industrial lost 1.2% to 26164.04. The Nasdaq dropped 1.7% to 7865. The dollar strengthening was intact despite Federal Reserve Chairman Powell’s comment Fed intends to expand its balance sheet by purchasing short-term US government debt. The live dollar index data show the ICE US Dollar index, a measure of the dollar’s strength against a basket of six rival currencies, rose 0.2% to 99.12 and is higher currentlyy. Stock index futures point to higher openings today.
CAC 40 loss biggest among other European indexes
European stocks pulled back on Tuesday. Both The EUR/USD and GBP/USD accelerated their slide yesterday with both pairs lower currently. The Stoxx Europe 600 ended 1.0% lower led by retail and travel stocks. The German DAX 30 lost 1.1% to 11970.20 despite data showing unexpected rise in industrial production in August when a decline was expected. France’s CAC 40 fell 1.2%. UK’s FTSE 100 slid 0.8% to 7143.15.
Shanghai Composite gains while other Asian indexes slip
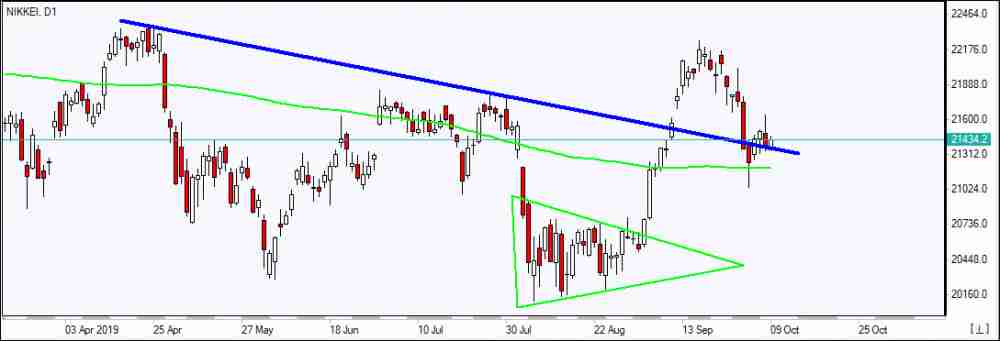
Asian stock indices are mostly lower today after China’s Commerce Ministry issued a statement demanding US “stop interfering” in its internal affairs following US announcement of visa restrictions against Chinese officials believed involved in abuses of Uighurs. Nikkei lost 0.6% to 21456.38 despite renewed yen slide against the dollar. The Shanghai Composite Index is up 0.2% while Hong Kong’s Hang Seng index is 0.7% lower. Australia’s All Ordinaries Index turned lower closing down 0.7% as Australian dollar moved higher against the greenback.
Brent futures prices are edging higher today. Prices fell yesterday on global demand decline concerns after the US Energy Information Administration cut its expectations for global oil demand growth and lowered 2020 price forecasts. The American Petroleum Institute late Tuesday report indicated US crude inventories rose by 4.1 million barrels last week. Prices fell yesterday: December Brent lost 0.2% to $58.24 a barrel on Tuesday. Today at 16:30 CET the Energy Information Administration will release US Crude Oil Inventories.
Note: This overview has an informative and tutorial character and is published for free. All the data, included in the overview, are received from public sources, recognized as more or less reliable. Moreover, there is no guarantee that the indicated information is full and precise. Overviews are not updated. The whole information in each overview, including opinion, indicators, charts and anything else, is provided only for familiarization purposes and is not financial advice or а recommendation. The whole text and its any part, as well as the charts cannot be considered as an offer to make a deal with any asset. IFC Markets and its employees under any circumstances are not liable for any action taken by someone else during or after reading the overview.
The Critical Investor digs into what the proposed joint venture means for this junior project generator.
Despite being a hybrid prospect generator, meaning self-funding projects and also being funded by joint venture (JV) partners, Avrupa Minerals Ltd. (AVU:TSX.V; AVPMF:OTC; 8AM:FSE) has finally succeeded in signing a nonbinding letter of intent (LOI), on Oct. 1, for a nice JV deal on its Alvalade project in Portugal. The deal is with a Spanish private mining company called Minas de Aguas Teñidas, S.A.U. (MATSA), owned in joint venture by juggernauts Mubadala and Trafigura.
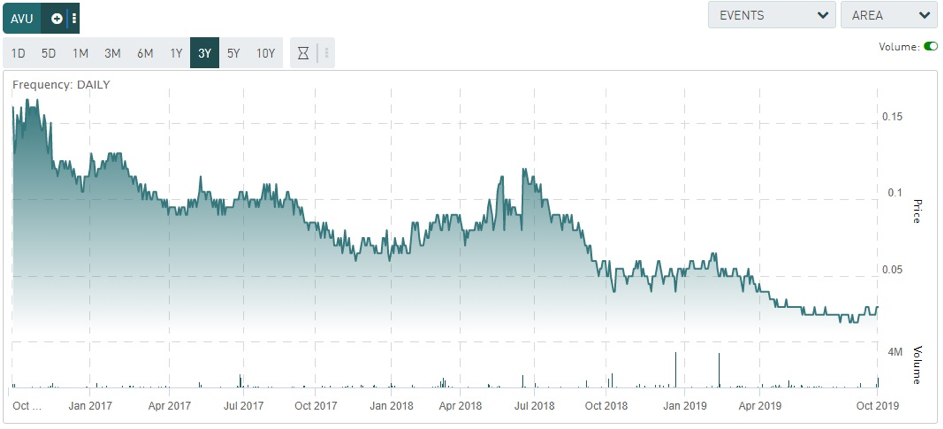
This is an important development, as Avrupa wasn’t exactly in the position to raise enough cash to drill out Alvalade themselves, as management estimated the costs of a decent program on all targets at about CA$10 million (CA$10M). The new JV doesn’t provide this amount of financial budget either, but the initial CA$2.4M is enough for a solid start, and prevents a lot of dilution for Avrupa, whose market cap has gone down to a very tiny CA$3.3M. A financing of that size would have added 73% dilution.
After a decent start to 2019, with encouraging drill results, the company has had to wait for a new exploration permit, which is taking longer than expected. Also, the general base metal sentiment went down as the US-China trade war intensified and the global economy started lagging, making things difficult for Avrupa on the financing front. However, with this latest deal, if finalized, and with the permit hopefully being granted soon, the company can continue at full speed, at least for 2020. Let’s look into this JV in some more detail.
Avrupa Minerals has signed a LOI with MATSA to form an earn-in exploration and exploitation joint venture on its Alvalade copper-zinc massive sulfide project in the Iberian pyrite belt of southern Portugal. MATSA isn’t just your average Spanish company, as it is a 50:50 joint venture company of powerhouses Mubadala Investment Company, a very large Abu Dhabi-based global investment company with US$400 billion in assets, and Trafigura, one of the world’s leading independent and privately owned commodity trading and logistics houses, with an annual turnover of US$180 billion. MATSA owns and operates three mines in the province of Huelva (Andalusia, Spain), and holds 1,000 square kilometers of exploration licenses in the Iberian pyrite belt.
Management told me they have known MATSA for at least five years, having them coming over as early as in 2014 to check out projects for a potential JV at the time, to no avail. After the Sesmarias drill results came out earlier this year, they contacted CEO Paul Kuhn in April and showed new interest. Completion of technical and financial due diligence resulted in the latest announcement.
At the moment, according to management, the companies are working together to complete a definitive agreement in the next few weeks, along with the formation of a new JV entity Newco, and the accompanying shareholders’ agreement for Newco.
The most important highlights of the JV are:
Minas de Aguas Teñidas, S.A.U. (MATSA) operates three copper-zinc mines in the Iberian pyrite belt.
MATSA can earn-in to 51% of the Alvalade Project by spending 2.4 million euros and by paying Avrupa 400,000 euros.
MATSA can earn-in to 85% by providing a bankable feasibility study (BFS) on any one prospect and by making all required success payments to the original joint venture partner.
As recent drilling at the Sesmarias copper-zinc project, being part of Alvalade, demonstrated potential robustness of massive sulfide mineralization, the JV is focusing on this area before considering other potential targets around the license.
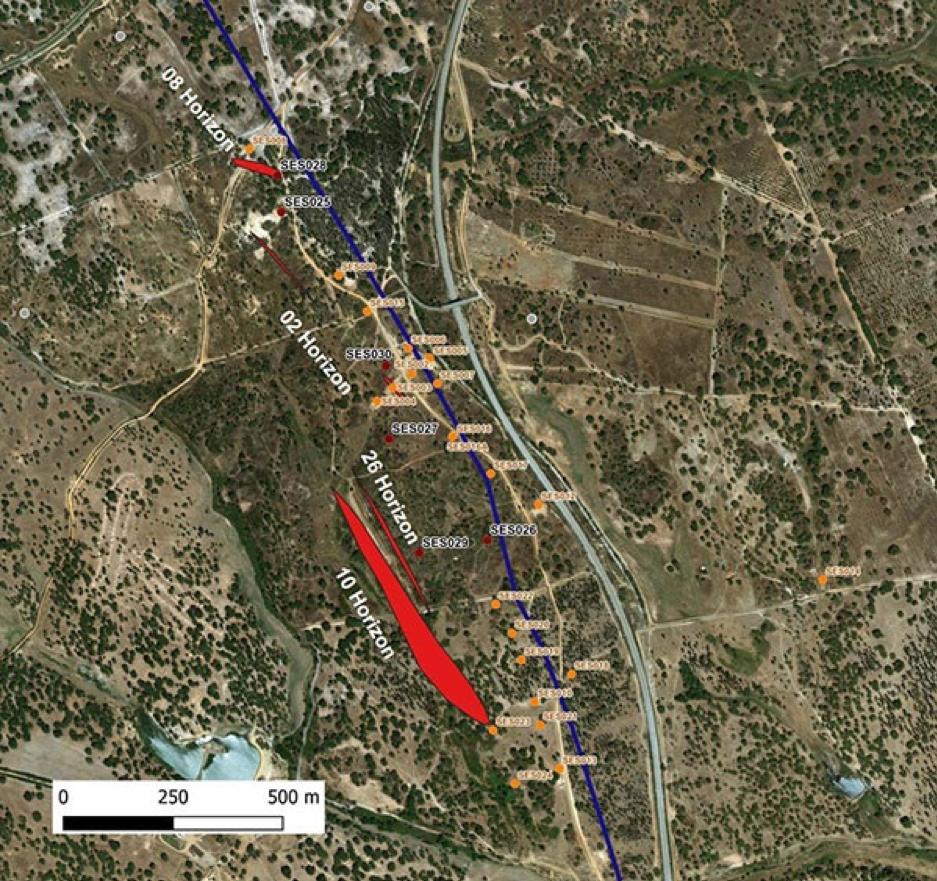
As a reminder, a very interesting hole, SES026, indicated ongoing mineralization along strike for the important 10 Lens (called 10 Horizon in the picture).
SES026 intercepted 28.95 meters of 0.48% copper, 0.77 g/t gold, 15.7 ppm silver, 0.52% lead and 1.31% zinc (resulting in a CuEq grade of 1.86%), and extended the 10 Lens by 300 meters to the north from previous drilling.
The 10 Lens is now at 600 meters x 300 meters x 25 meters. These dimensions generate 4.5 million cubic meters, which in turn result into 18 million tonnes (18Mt) when using a conservative gravity of 4 tonnes (t)/cubic meter (m3). Average gravity is estimated by management to be ranging from 4 to 4.4t/m3. Using a midpoint would render 18.9Mt, which is closing in on the minimum target of 25Mt.
For MATSA, the aim of the first stage of the joint venture is to delineate a deposit at Sesmarias and/or at any one of a number of other mineralized targets located within the boundaries of the Alvalade License, including at the past-producing Lousal Mine, at Monte da Bela Vista, and at the past-producing Caveira Mine. In addition to these mineral zones, Avrupa has defined a number of other drill-ready targets within the license boundaries. As all-in drilling costs are estimated by management at 300 euro/m (CA$430/m), 2M euros would be sufficient to fund 6,700 meters. This should be enough to get enough data to prepare a maiden NI 43-101 resource on Sesmarias. It will be clear that all other targets will require additional funding from MATSA.
According to the news release, the LOI includes the following terms:
“In order to acquire a 51% interest in Newco’The Experimental Exploitation Phase’:
MATSA must provide to Avrupa 400,000 euros (approximately CA$580,000) payment upon signing of the Definitive Agreement.
MATSA must provide the required work commitment guarantee of 240,000 euros (approximately CA$348,000) upon issuance of the new Alvalade Experimental Exploitation License (EEL) to the new JV company (Newco), to be set up to hold the license. This amount is refundable to MATSA pending completion of the license work commitment and approval by the Portuguese Mining Bureau (DGEG).
MATSA must provide 1.2 million euros (approximately CA$1,740,000) for work on the project during the first year after signing of the Definitive Agreement.
MATSA must provide, at its sole discretion, an additional 1.2 million euros for work over the second and third years of the joint venture.
Avrupa will be the operator in this phase of work and will be paid 100,000 euros (approximately CA$145,000) annually as an operator’s fee.”
The initial CA$580,000 cash payment should be enough for Avrupa to keep the lights on for at least 18 months, as they have low general and administrative (G&A) costs and also receive a CA$145,000 operator’s fee. The CA$1.74M should be sufficient to do 4,000m of drilling during the first year. Management feels that thehe upcoming definitive agreement with MATSA will probably be very helpful with the granting of the EEL, or exploration license. Avrupa will form a technical committee with MATSA in order to design and monitor the upcoming drill program, and Avrupa will be the operator. The terms continue:
“In order to acquire a further 34% interest in Newco, for a total of 85%’The Feasibility Study Phase’MATSA must, at its option:
Provide a ‘bankable feasibility study’ on one prospect within the Alvalade license. MATSA is responsible for 100% of the costs to produce the feasibility study, including preparation of a NI-43-101-compliant resource estimate;
Fund all necessary success-based payments to Avrupa’s previous joint venture partner, Antofagasta Minerals, S.A., as required by the Debt Cancellation Agreement between Avrupa and Antofagasta (see news release of June 19, 2017).”
This is a very interesting paragraph, as a decent BFS for such a project, including the resource estimate, could easily cost CA$25-30M, but it wouldn’t cost Avrupa a single dollar. Additional but much cheaper studies like a PEA (preliminary economic assessment/approximately CA$0.3-0.5M), a PFS (preliminary feasibility study/approximately CA$1-2M), and a maiden resource estimate (approximately CA$0.2-0.4M), are planned, and will be funded by MATSA as well. Regarding the last item, the terms with Antofagasta are as follows, according to the June 19, 2017. news release:
“Avrupa has agreed to forgive approximately 160,000 euros in debts, assume a deposit on the project of 75,000 euros, and make the following payments to the initial partner on the project in return for increasing its interest in the project from 40% back to 100%:
Cash payment of US$250,000 on the filing of an initial NI-43-101-compliant resource estimate meeting certain minimum criteria;
Staged cash payments totaling US$1,000,000 on the completion of a NI-43-101-compliant feasibility study meeting certain minimum criteria; and
Staged cash payments totaling US$3,000,000 on the commencement of commercial production from the project.”
These terms account for another US$4.25M (CA$5.67M) being paid by JV partner MATSA, so this is another burden removed from Avrupa’s back when taking Sesmarias all the way into production.
For construction and production, the JV envisions the following terms:
“Project Commitment and Construction Phase:
In conjunction with the completion of the feasibility study, MATSA would be responsible to ensure that the application for a Mining License at Alvalade is completed, as required by Portuguese Mining Law.
During the Construction Phase, Avrupa will have the choice to participate as a 15% shareholder by providing its pro rata share of the necessary funding, or elect to transfer its 15% interest in Newco to MATSA in exchange for staged payments of 10 million euros (approximately CA$14.5 million), as follows:
3,000,000 euros upon a construction decision being made, and the permits received from the DGEG;
3,000,000 euros upon commencement of commercial production; and
4,000,000 euros upon the first anniversary of commercial production.
The remainder of necessary success-based payments to Antofagasta would be borne by the Project, in accordance with the respective holdings in Newco.”
The only thing that seemed to be missing is a royalty on the project, as minority partners usually end up with this. Management countered a question I had about this with the following, and in my view, convincing answer: “There is already a steep 4-5% NSR to the government in Portugal. Putting another NSR on top of that makes a project look less palatable, so we decided on cash as a more desirable alternative at the 85-15 decision point. We should know at that time whether we can fund our own way or just step back with a significant cash deposit.” Fair enough.
On a final note, according to the news release, completion of the earn-in and joint venture arrangement remains subject to a number of conditions, including finalization of the definitive agreement, issuance of the exploitation permit (advanced stage), and receipt of any required board and/or regulatory approvals. The company was pretty happy with proceedings. Paul Kuhn, president and CEO of Avrupa Minerals, stated, “We are extremely pleased about the forthcoming joint venture at Alvalade. MATSA already mines copper and zinc at three locations in the Iberian Pyrite Belt of Spain, and we look forward to working with them on our Pyrite Belt Project in Portugal. Advancing the Alvalade Project with the strong experience of MATSA will not only allow us to work towards a potential mining solution at Sesmarias, but will also allow us to return to our real strength of project generation in Europe.”
Conclusion
Of course, prospect generation is the core strength of Avrupa Minerals, but the trajectory set out in this JV could result in quite a bit of share price appreciation in the long run, as a minimum 25Mt scenario already could generate back-of-the-envelope hypothetical NPVs (net present values) to the tune of hundreds of millions of US dollars at current metal prices. Management, and most likely MATSA, with super giants Mubadala and Trafigura on board, is aiming at even bigger prizes, as a combination of Sesmarias, Lousal and other targets could easily result in 50Mt+ operationsand potentially even much larger, as much of the area hasn’t been explored with up to date methods.
For example, old, outdated methods caused Sesmarias to go unnoticed until Kuhn and his team figured out the difficult geological puzzle. Fifteen percent of such a prize would still be a very significant amount for a tiny junior like Avrupa Minerals, as, for example, a modest NPV8 of US$200M would result in a CA$40M share for the company, being a twelvefold from current levels. Of course, this will not be generated overnight, but it gives an indication of potential here. Let’s see what the company can accomplish here, after the JV is finalized and drills are turning again. I’m certainly intrigued.
I hope you will find this article interesting and useful, and will have further interest in my upcoming articles on mining. To never miss a thing, please subscribe to my free newsletter on my website http://www.criticalinvestor.eu, in order to get an email notice of my new articles soon after they are published.
The Critical Investor is a newsletter and comprehensive junior mining platform, providing analysis, blog and newsfeed and all sorts of information about junior mining. The editor is an avid and critical junior mining stock investor from The Netherlands, with an MSc background in construction/project management. Number cruncher at project economics, looking for high quality companies, mostly growth/turnaround/catalyst-driven to avoid too much dependence/influence of long-term commodity pricing/market sentiments, and often looking for long-term deep value. Getting burned in the past himself at junior mining investments by following overly positive sources that more often than not avoided to mention (hidden) risks or critical flaws, The Critical Investor learned his lesson well, and goes a few steps further ever since, providing a fresh, more in-depth, and critical vision on things, hence the name.
The author is not a registered investment advisor, and currently has a long position in this stock. Avrupa Minerals is a sponsoring company. All facts are to be checked by the reader. For more information go to www.avrupaminerals.com and read the company’s profile and official documents on www.sedar.com, also for important risk disclosures. This article is provided for information purposes only, and is not intended to be investment advice of any kind, and all readers are encouraged to do their own due diligence, and talk to their own licensed investment advisors prior to making any investment decisions.
Streetwise Reports Disclosure: 1) The Critical Investor’s disclosures are listed above. 2) The following companies mentioned in the article are sponsors of Streetwise Reports: None. Click here for important disclosures about sponsor fees. The information provided above is for informational purposes only and is not a recommendation to buy or sell any security. 3) Statements and opinions expressed are the opinions of the author and not of Streetwise Reports or its officers. The author is wholly responsible for the validity of the statements. The author was not paid by Streetwise Reports for this article. Streetwise Reports was not paid by the author to publish or syndicate this article. Streetwise Reports requires contributing authors to disclose any shareholdings in, or economic relationships with, companies that they write about. Streetwise Reports relies upon the authors to accurately provide this information and Streetwise Reports has no means of verifying its accuracy.
4) The article does not constitute investment advice. Each reader is encouraged to consult with his or her individual financial professional and any action a reader takes as a result of information presented here is his or her own responsibility. By opening this page, each reader accepts and agrees to Streetwise Reports’ terms of use and full legal disclaimer. This article is not a solicitation for investment. Streetwise Reports does not render general or specific investment advice and the information on Streetwise Reports should not be considered a recommendation to buy or sell any security. Streetwise Reports does not endorse or recommend the business, products, services or securities of any company mentioned on Streetwise Reports. 5) From time to time, Streetwise Reports LLC and its directors, officers, employees or members of their families, as well as persons interviewed for articles and interviews on the site, may have a long or short position in securities mentioned. Directors, officers, employees or members of their immediate families are prohibited from making purchases and/or sales of those securities in the open market or otherwise from the time of the interview or the decision to write an article until three business days after the publication of the interview or article. The foregoing prohibition does not apply to articles that in substance only restate previously published company releases. As of the date of this article, officers and/or employees of Streetwise Reports LLC (including members of their household) own securities of Avrupa Minerals, a company mentioned in this article.