Equity markets managed to rebound on news that President Trump will be meeting with Vice-Premier Liu He.
The news comes as the US and China trade talks resume. However, over the past few days, risk appetite was volatile. Equities flip-flopped on new reports of the trade talks.
US Inflation Stays Flat in September
The monthly inflation report from the United States showed that consumer prices rose less than forecast. On a month over month basis, headline CPI was unchanged.
This missed estimates of a 0.1% increase. Core inflation rate rose 0.1%, falling short of the 0.2% increase. The US dollar weakened on the news. Headline inflation slipped to 1.7% on the year following the latest release.
EURUSD Jumps on the Back of a Weaker USD
The euro maintained the bullish momentum. The currency pair rose to a three-week high, briefly testing 1.1091. The gains come as the EURUSD has been trading below this resistance level over the past few weeks. Further momentum to the upside could see the common currency breaking past the current resistance level. The next upside target is at 1.1140.
Sterling Gains on Brexit Optimism
The pound sterling posted gains on Thursday after a meeting between the UK and Irish leaders. In a meeting between British PM Johnson and Irish PM Varadkar, both leaders committed to a statement claiming that a resolution to the Brexit stalemate is possible.
The news comes as the UK approaches the October 31st Brexit deadline. The news is seen as a positive development with the Irish backstop arrangement being the main focus of the talks.
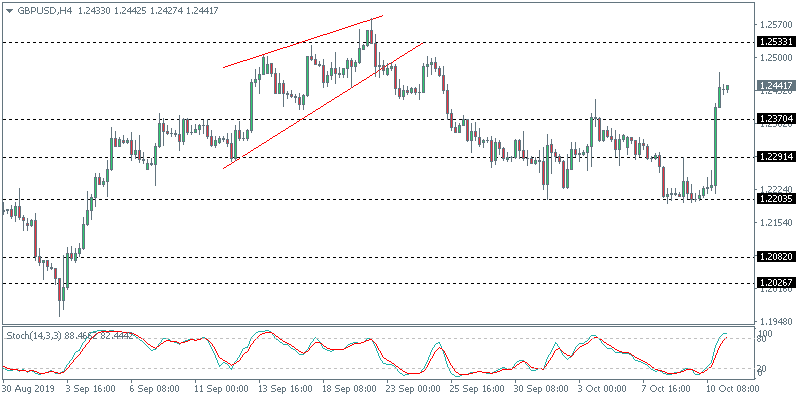
GBPUSD Pares Losses, Can the Gains Continue?
The currency pair reversed the losses from earlier this week. After price action threatened the lower support at 1.2203, the news sent the currency higher. GBPUSD was testing the previously established resistance level at 1.2370. A clear close above this level will confirm further upside. The next main target is at 1.2533.
Gold Slips as Investor Optimism Rises
The precious metal extended declines on Thursday following days of uncertainty. By Wednesday, equities recovered, pushing appetite for risk assets higher.
This led to safe haven assets losing ground. While gold prices closed flat on Wednesday, the declines accelerated into Thursday’s close. Investors now wait for the conclusion of today’s trade meeting.
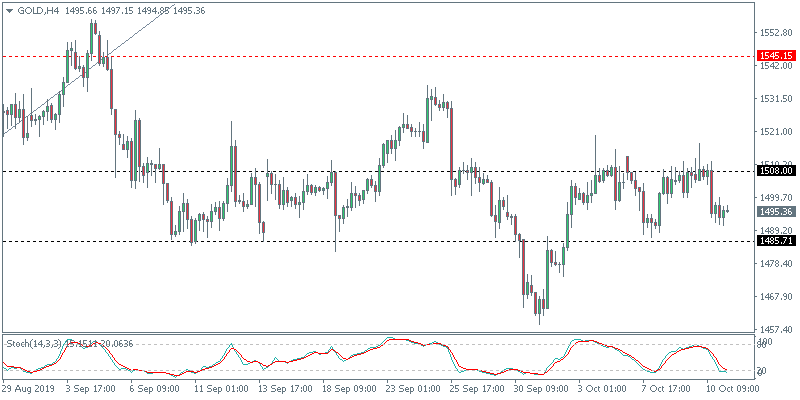
XAUUSD Fails to Breakout from the Range
The precious metal has been trading within the confines of 1508 and 1485. Repeated tests to the upside failed to result in a convincing breakout. This pushed gold prices lower on Thursday. Price action could drop towards the lower boundary of 1485. A close below the 1485 handle will confirm the downside bias in gold.
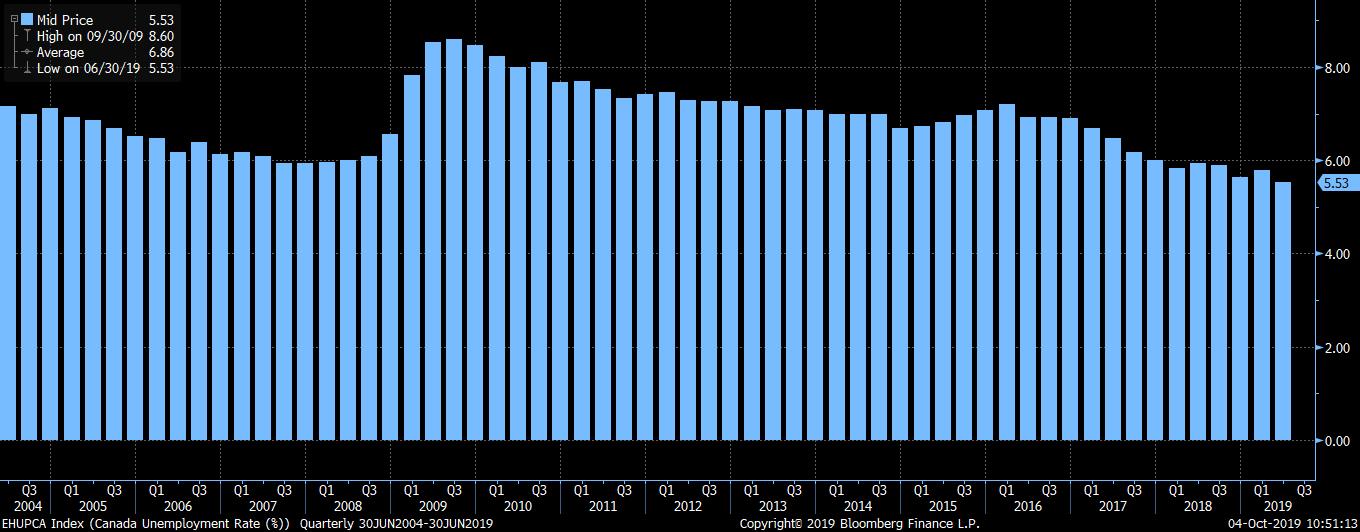
Statistics Canada will be releasing the high impact jobs report for September.
Economists are forecasting that Canada’s unemployment rate will hold steady at 5.7% in September. The unemployment rate rose to 5.7% in July from 5.5%. Since then, the unemployment rate has been steady at 5.7%.
On the employment change, economists are forecasting 40.2k jobs for September.
This is around half of the number of jobs created in August. The report for August saw a rather big print that beat estimates.
Therefore, it is not surprising to see that the number of jobs would moderate. It is unlikely though that the employment change will rise higher than the headline print from August.
Canada Employment Change, August 2019
For the full year of 2019, Canada has added 304,000 jobs on a seasonally adjusted basis. Current estimates point to a possibility of this number rising even further. Since mid-2016, Canada created about 1.06 million jobs.
But despite the increase, during the same period, the equipment investment was sluggish. The data underlines the fact that hiring confidence is not that high.
In October last year, the Canadian government introduced tax-changes. The move was seen as a way to bring back confidence into the markets.
A recent patch of economic reports from Canada points to conflicting views. But the biggest talking point has been the GDP. In July, Canada’s GDP growth was flat.
The data was a result of a decline in the oil and gas extraction industry. The sector shed 3% in July and was the biggest decline since 2016.
Canada’s Ivey PMI Falls in September
Canada’s Ivey PMI report for September revealed that the pace of economic activity slowed. This also included a weakening in the measure of employment. The Ivey PMI fell to 48.7 during the month. This was after the index rose to 60.6 in August.
Incidentally, the increase in August was the highest since October 2018.
The Ivey PMI’s gauge of employment measure fell from 52.7 in August to 49.6 in September. A reading below the 50-level of the index shows a contraction in the sector.
The data also hints at a possible lower than expected job figures today.
Inventories also fell sharply in September to 50.5, compared to 54.8 in August.
The weakening in Canada’s economic activity stands in contrast to the BoC’s view. The central bank was optimistic that the Canadian economy would pick up steam into the second half of the year.
While this was partly true, recent data indicates that the momentum is slowing. This could very well be seen from the jobs report for September. The labor market has been resilient so far. But it has also been volatile on a month to month basis.
A better than forecast jobs report could soothe investor nerves. The recent weaker GDP report is starting to raise the prospects of the BoC taking an easing stance.
Among many of the developed economies, the Bank of Canada remains the only central bank that has left monetary policy unchanged. But that could change soon if the data paints a disappointing picture.
Today’s jobs report comes amid an early close for the Canadian markets. The bond markets will be closing early into the Thanksgiving weekend and open only on Tuesday.
The jobs report comes as Canada also heads into an election. The federal election in Canada is due on October 21st.
Asian stocks and currencies are gaining as investors grow increasingly hopeful that the US and China can reach a trade deal on Friday. There’s a clear risk-on mood in the markets at the expense of safe haven assets, as Gold trades below $1500, yields on 10-year US Treasuries breach 1.65 percent, and USDJPY breaks above the psychological 108 level for the first time since October 1.
Investors are ready to celebrate any form of a US-China trade deal, even a limited one, after having endured trade-related turmoil since May. The amount of market fanfare will correspond with the contents of the actual deal, assuming one will be announced later today. Investors are in sore need of a solid pick-me-up beyond mere whispers of a trade pact, and a formal agreement is likely to sustain risk sentiment for the rest of 2019. Still, investors are cognizant that a trade pact that marks a pause in tariff hikes without rolling back any of the tariffs imposed since last year would not solve all of the global economy’s existing problems.
At the other end of market expectations, failure to come to any agreement this week may have dire consequences for the global economy. Keep in mind that the US administration had threatened to raise existing tariffs on $250 billion worth of Chinese goods by 5 percentage points to 30 percent on Tuesday, with potentially more tariffs to follow in December.
Whiffs of Brexit deal send Pound on steepest climb in seven months
Risk sentiment is also boosted by reports of another crucial deal becoming likelier across the Atlantic.
UK Prime Minister Boris Johnson and Irish premier Leo Varadker said they have identified a “pathway” towards a Brexit deal. Following the news, GBPUSD breached the 1.245 mark for the first time since September 25 after seeing its biggest jump in seven months, before moderating slightly to converge around its 100-day moving average.
With three weeks remaining before the existing October 31 deadline, markets can expect more twists and turns in this Brexit saga, as has been the case since 2016. The uncertainty surrounding Brexit also means that the Pound will be dragged along as the UK continues to find its way out of the European Union. The 1.20 level remains the floor beneath Sterling, unless a no-deal Brexit becomes an absolute certainty.
US-China trade deal to act as Brent boost
Brent futures could carve out a path back towards $64/bbl in the event that a US-China trade deal is announced going into the weekend. Oil markets have been weighed down by demand-side uncertainties, as heightened tariffs have choked global trade. The trade tariffs that remain in place however will limit Oil’s upside, barring any tightening in global supplies via a spike in geopolitical tensions involving major Oil producers or a tighter supply-cuts programme by OPEC+.
Disclaimer: The content in this article comprises personal opinions and should not be construed as containing personal and/or other investment advice and/or an offer of and/or solicitation for any transactions in financial instruments and/or a guarantee and/or prediction of future performance. ForexTime (FXTM), its affiliates, agents, directors, officers or employees do not guarantee the accuracy, validity, timeliness or completeness, of any information or data made available and assume no liability as to any loss arising from any investment based on the same.
Dollar weakens as Kaplan sounds supportive of rate cut
US stocks notched back to back gains on Thursday after President Donald Trump said he would meet China’s chief trade negotiator at the White House. The S&P 500 rose 0.64% to 2938.13. The Dow Jones industrial average added 0.57% to 26496.67. Nasdaq composite index gained 0.6% to 7950.78. The dollar weakening accelerated as Dallas Fed President Robert Kaplan said he was open-minded on the outlook for further rate cuts: the live dollar index data show the ICE US Dollar index, a measure of the dollar’s strength against a basket of six rival currencies, lost 0.4% to 98.685 and is lower currently. Stock index futures point to higher openings today.
CAC 40 leads European indexes gains
European stocks extended gains on Thursday. GBP/USD joined EUR/USD’s continued climb yesterday and both are higher currently. The Stoxx Europe 600 index ended 0.8% higher led by basic resources shares. Germany’s DAX 30 advanced 0.6% to 12164.2. France’s CAC 40 rose 1.3% and UK’s FTSE 100 added 0.3% to 7186.36.
Hang Seng leads Asian indexes rebound
Asian stock indices are all in green today on US-China trade progress hope. Nikkei rose 1.2% to 21798.87 as yen continued its slide against the dollar. Chinese stocks are rising as President Trump said negotiations were ‘going very well’ ahead of h is scheduled meeting today with Vice Premier Liu He, China’s lead trade negotiator, after the talks wrap up : the Shanghai Composite Index is up 0.9% and Hong Kong’s Hang Seng Index is 2.6% higher. Australia’s All Ordinaries Index accelerated gains to 0.9% despite continuing Australian dollar climb against the greenback.
Brent futures prices jumped today after Iran claimed two missiles struck one of its tankers off Saudi Arabia coast. Prices ended higher yesterday: December Brent crude rose 1.3% to $59.10 a barrel on Thursday.
Note: This overview has an informative and tutorial character and is published for free. All the data, included in the overview, are received from public sources, recognized as more or less reliable. Moreover, there is no guarantee that the indicated information is full and precise. Overviews are not updated. The whole information in each overview, including opinion, indicators, charts and anything else, is provided only for familiarization purposes and is not financial advice or а recommendation. The whole text and its any part, as well as the charts cannot be considered as an offer to make a deal with any asset. IFC Markets and its employees under any circumstances are not liable for any action taken by someone else during or after reading the overview.
Chris Taylor, CEO of Great Bear Resources, speaks to Maurice Jackson of Proven and Probable about what the drills are turning up at the Dixie Gold Project in Ontario’s Red Lake District.
Readers should note last month we conducted a very thorough, comprehensive interview with Mr. Taylor, highlighting the value proposition before us in Great Bear Resources.
Great Bear Resources has some important updates for current and prospective shareholders regarding the company’s continued progress from the ongoing 90,000-meter drill program on his 100%-owned Dixie Gold Project in the Red Lake district of Ontario. Before we address today’s exciting press release, Mr. Taylor, for someone new to the story, please introduce us to Great Bear Resources and what is the opportunity you present to the market?
Chris Taylor: Great Bear is a Canadian gold-focused exploration company and our project, the Dixie Property, is located in one of Canada’s best high-grade gold mining jurisdictions. That’s the Red Lake area of the province of Ontario. The Dixie Gold Project is 100% owned, and it’s located immediately adjacent to a highway beside power lines and about a 20-minute drive from other existing gold mines in this area. In addition to that, it’s an infrastructure-rich, high-grade gold project with gold results that go right to the surface beside a highway.
Maurice Jackson: Mr. Taylor, we have updates regarding drill fences and the consolidation of three zones. To have a better context on the successes of today’s press release, provide us with some highlights of the LP fault drill program to date.
Chris Taylor: The LP fault is a very large gold target on our project and this is about 20 kilometers long tip to tip. From the perspective of other projects in this area, this LP fault target is about the same strike length as all the other mines in the Red Lake District put together. If you stack them up all beside each other, those mines would be about the same size as the target that we’re working on now. What we’re seeing and what we’ve announced in our most recent news release is that we’ve been drilling along many kilometers of this fault, we continue to hit gold mineralization in every area. Initially in our exploration program we thought we had different gold zones developed along the fault and we called those the Bear Rimini, the Yuma and the Auro zones.
With the recent results, what we see is that drilling between and around these areas is successfully hitting the same styles of gold mineralization. That means instead having normal sized gold zones, what we have is a very large, an unusually large, and unusually continuous gold zone that goes right to surface. This truly is a very exciting change on our understanding of the project. To date we’ve only drilled about 18%, approximately 3 kilometers of about 20 kilometers of that target, which is really encouraging, as there’s a long way to go for Great Bear and it’s very exciting to see these results coming out as they are.
Maurice Jackson: Looking at Figure 1 below, walk us through and provide shareholders with a summary of the company’s most recent results regarding drill fences along the LP fault.
Figure 1
Chris Taylor: The first figure in the release shows the locations of the Bear Rimini, Yuma and Auro zones. What is interesting to note is that when we put out news over the last few months, it was just a drill hole or maybe two to three drill holes in each area widely separated by a kilometer and a half or a kilometer and these zones were given separate names. Obviously before we did the drilling, we didn’t know if these all connected together into sort of a large super zone, for want of a better term.
With the drilling that we recently conducted demonstrates as displayed on Figure 1, we’re seeing the same rocks and the same styles of gold mineralization section after section after section to the point where there are now 14 drill sections. Each section has 1 to 3 drill holes across and it’s all the same geology and all the same styles of gold mineralization over that entire 3.2 kilometer area. We have enough data present now which we’re showing visually on Figure 1, that you see the continuity of mineralization and ultimately continuity is what gives you resources for a gold system like this. Seeing this kind of continuity was excellent news for the company.
Maurice Jackson: Moving onto Figure 2, what can you share with us regarding gold bearing alteration and why is this important for shareholders to note?
Figure 2
Chris Taylor: Effectively what’s important on Figure 2 is the size that we see in the gold bearing alteration. There are two styles of gold mineralization that we see along the LP fault. Some of this mineralization is very wide zones of lower-grade gold, the type of gold that you would see mined in some of the largest deposits in Canada. There’s a very well-known project here in Canada, which is operated by Agnico Eagle Mines, it’s a great big mining company and it has an excellent exploration and production track record. That deposit is about 12 million ounces of gold at about 1 gram per ton gold and it’s a big open pit type deposit. We see that style of alteration and gold mineralization along 3 kilometers so far of our project, which was about the same strike length as that big Malartic deposit that’s operated by Agnico Eagle. We also see high-grade gold within that as well.
As a reminder, this is high-grade gold and the low-grade massive halo around it goes right to surface. With the results that we’ve just released, we could see that in the drill core links that we drilled and published recently, we’ve seen that gold zone go up to 500 meters long along the drill core. That’s amazing in terms of a 500 meter width of the mineralized system that we see so far. That’s the kind of mineralized system you don’t typically associate with a gold deposit. That’s the sort of thing that you see in these big porphyry copper deposits and other deposits of that scale. But, usually with gold in this area, most of the gold that’s mined is only 2 meters wide; 2 meters of high-grade gold is what has produced more than 30 million ounces of production in this district. So this is the first time in this area of Ontario that anybody’s seen a gold system with this sort of scale and magnitude, strike length, depth extent over 500 meters so far when we’ve drilled it and up to 500 meters of width that we see along the core. It’s just turning into something that nobody expected to see on this scale in this area.
Maurice Jackson: Great Bear Resources provided some intriguing assay results, but before we get into those numbers, can you walk us through the 3D image of the LP fault zone and what does this convey to the technical team?
Chris Taylor: Effectively, what we show through these 3D images is consistency. Readers will see the same styles of rocks and the same mineralization kilometer after kilometer. It’s really that consistency, which is going to make this an unusual standout in terms of the size and the presence of gold to surface beside the highway. That consistency of geology section to section to section across kilometers is what we want to emphasize with that image.
Maurice Jackson: Every speculator wants to see results. We have them displayed for readers. Walk us through the results, what has peaked the team’s interest on the latest rounds of success regarding continuity?
Chris Taylor: Effectively what we see is section after section along this new target, we see that a wide-intervals of the low-grade mineralization that tends to form these open-pit type mining deposits, then we see that high-grade zones within it. What we’re noticing is that mineralization ranges from up to a 100 grams per ton over widths of say 0.5 a meter. Or you might end up with a 0.5 an ounce per ton over 3 to 4 meters. That’ll be surrounded by these wide intervals of approximately 40 meters of 2 grams per ton, or 50 meters of a 1 gram per ton, these sort of intervals.
That’s what we see effectively in the Auro area of the LP fault. We had a drill result that came out about a month ago now, which was about 40 meters of 5 grams per ton gold, and exceptional results up near the surface. Again, higher grade intervals in the middle of that. Now we’re seeing with step-out drilling, which is hundreds of meters away to the southeast and to the northwest, we see the same indications of high-grade gold flanked by lower-grade mineralization. It’s consistent in that consistency is what’s driving this story. It’s that combination of factors, which is really setting these new discoveries apart from anything else that’s been found in this district before.
Maurice Jackson: The press release highlights holes BR 21 and BR 22; walk us through the cross section of BR 21 on figure four and why is this important?
Chris Taylor: BR 21 was drilled partially between what we called the Auro discovery and another discovery about a kilometer away. This is about 200 meters away from the Auro discovery towards the Yuma area. BR 21 showed some 0.5 ounce mineralization, again right up near surface and the same flanking intervals of the lower grade gold mineralization, again right near surface. BR 21 was a shallow test of the mineralization to see if it went right to surface in that area and towards the other zone.
The other section that we put out is BR 22, which is to the southeast of our original discovery hole. That had again some 100 gram gold material flanked by I believe it was about 40 meters of about 2 grams per ton gold around that as well, and that was a deeper test. In the deeper holes, what we saw in this system is that as we’ve gone deeper in that Auro area, the zone is really flaring out to this exceptional width of seeing multiple gold intervals over 500 meters. So that’s the significance of the BR 21 section and the BR 22 section. Both flanking, they both bracket that original Auro zone discovery hole as well. You have continuity across 300 meters in that area of the high-grade and the low to moderate grade gold. Going right to surface and also looking like it expands to depth, which is also another significant finding.
Maurice Jackson: Let’s discuss zone consolidation, which zones are being consolidated and what prompted this move?
Chris Taylor: Effectively, all of the zones that we’ve drilled along the LP fault, there were three of them prior to this news release. They’ve all been merged together because with 14 drill fences, each with 1 to 3 drill holes across that three kilometers strike length, we’re seeing the same mineralization at all locations. That means that we’re not looking at separate gold zones at all, we’re looking at a large continuously mineralized gold zone. That was the very significant finding that we came out with recently.
Maurice Jackson: Before we leave Great Bear Resources property bank, the business and geological acumen continues to exceed market expectations. What can you share with us regarding properties that are earning a 100% royalty free interest?
Chris Taylor: Projects are exceptionally unusual in that sense. When we purchased the Dixie Project, to give you a little bit of history, it was owned by two different parties. One of them was Newmont at the time, the large American mining firm; it owned about a 33% interest in the project. The other one was a local prospector who’d managed to accumulate a 67% interest in the property and also some of the outstanding royalties. Now when Great Bear became the owners under option of this property three years ago, we negotiated that we would buy out the royalties to the project so it wouldn’t be burdened by any of those factors. We also bought out, eventually, Newmont Mining as well; we did that before we did any drilling. We knew that if we were successful on the project and we had not bought these people out in their entirety, ultimately the purchase price would have been much, much higher.
So we managed to get a very good, fair deal for our shareholders. It doesn’t have any royalty overhangs on the project at all. That means that all the benefit of what we’re finding in the ground flows to our company’s shareholders. That’s why with our share structure currently sitting at about 42 million shares issued and outstanding, that’s a much tighter share structure than you see with most companies in our position. We do have a great deal of cash in the treasury as well, about CA$18 million at this point, about $24 million on a partially diluted basis. That’s enough money that we can basically do hundreds of drill holes on the project over 2019 and 2020 without the requirement to finance again. So that combination of 100% ownership that you mentioned, the lack of a royalty overhang and the tight share structure are the combined dominant reasons why the project and the company is performing so well in the context of its group of peers.
Maurice Jackson: Closing, multilayered question. What is the next unanswered question for Great Bear Resources? When can we expect a response and what determines success?
Chris Taylor: I think the way to answer that, Maurice, is to point at what makes a project unique and what makes it successful. In our case, what you’re looking at is a very active exploration program with results that come out very frequently. This is something that generally guides the market and progresses the market so people don’t have to wait months or years between progress on the project, it comes out weekly or every few weeks at the latest. What you’re seeing on top of that is those combinations of structure and the unusual discovery. So thinking about the geology and the nature of gold mineralization, how many comparable pure companies out there can tell you that all the gold that they’re drilling goes right within a few meters of the surface? That all that gold is being found only a mile or two from a paved highway? And the main gold zones actually run parallel to the highway? And are only about a 20-minute drive from other major producing gold mines in the region? Those are all factors that combine to make Great Bear stand out from its group of peers.
Maurice Jackson: Chris, what keeps you up at night that we don’t know about?
Chris Taylor: To be honest, one of the things that keeps me up at night is a sort of a level of buzzing excitement. I feel it, I’m on the project right now, I’m out, I’m talking to the geologists all the time. When you’re drilling as actively as we are, there are multiple drill holes going in across kilometers of these targets. When you see gold coming out of the ground on these things and you see the assays coming back from the lab, I wake up every day and wonder what has come in overnight and how much bigger the system has gotten, where we’ve expanded into, what field crews have found while they’re looking around the project. It’s that level of excitement that keeps me awake at night. It’s been such an exciting ride so far, but from the perspective of discovery, we’re really just getting started on this property. It’s like very much the size of a gold district in and of its own right. So it’s large, it’s multi-target and the excitement is really what gets me out of bed very quickly every morning.
Maurice Jackson: Mr. Taylor, what did I forget to ask?
Chris Taylor: Well, one of the things that people always ask me about is how big could the project be? I think there are some very reasonable comparisons; there are other large district discoveries in Canada and in other gold belts in the world. If people are curious, the company posts many of the interviews and webinars and other things that my partner Bob Singer, our VP of exploration, and I present to the public. In some of those there are comparisons to other large deposits that we see in Canada that have been exceptional large scale producers and exceptional recent discoveries. If people want to understand the scope of the system, some of those things make direct comparisons in terms of the types of high-grade discoveries, the types of big bulk tonnage of discoveries and I think if anybody’s interested in our story, maybe go to our website: www.greatbearresources.ca and watch some of that video material. It can be entertaining and it can also give you an idea for what we’re working on here and how big it could be.
Maurice Jackson: For direct inquiries, call (604) 646-8354 or you may email: [email protected]. Great Bear Resources trades on the TSX-V: GBR | OTCQX: GTBDF.
Before you make your next bullion purchase, make sure you call me. I’m a licensed representative for Miles Franklin Precious Metals Investments, where we provide a number of options to expand your precious metals portfolio. From physical delivery, offshore depositories, precious metal IRAs, and private blockchain distributed ledger technology. Call me directly at (855) 505- 1900 or you may email: [email protected]. Finally, please subscribe to Provenandprobable.com for mining insights and bullion sales.
Chris Taylor of Great Bear Resources, thank you for joining us today on Proven and Probable.
Disclosure: 1) Maurice Jackson: I, or members of my immediate household or family, own shares of the following companies mentioned in this article: None. I personally am, or members of my immediate household or family are, paid by the following companies mentioned in this article: None. My company has a financial relationship with the following companies mentioned in this article: Great Bear Resources is a sponsor of Proven and Probable. Proven and Probable disclosures are listed below. 2) The following companies mentioned in this article are billboard sponsors of Streetwise Reports: Great Bear Resources. Click here for important disclosures about sponsor fees. 3) Statements and opinions expressed are the opinions of the author and not of Streetwise Reports or its officers. The author is wholly responsible for the validity of the statements. The author was not paid by Streetwise Reports for this article. Streetwise Reports was not paid by the author to publish or syndicate this article. The information provided above is for informational purposes only and is not a recommendation to buy or sell any security. Streetwise Reports requires contributing authors to disclose any shareholdings in, or economic relationships with, companies that they write about. Streetwise Reports relies upon the authors to accurately provide this information and Streetwise Reports has no means of verifying its accuracy. 4) This article does not constitute investment advice. Each reader is encouraged to consult with his or her individual financial professional and any action a reader takes as a result of information presented here is his or her own responsibility. By opening this page, each reader accepts and agrees to Streetwise Reports’ terms of use and full legal disclaimer. This article is not a solicitation for investment. Streetwise Reports does not render general or specific investment advice and the information on Streetwise Reports should not be considered a recommendation to buy or sell any security. Streetwise Reports does not endorse or recommend the business, products, services or securities of any company mentioned on Streetwise Reports. 5) From time to time, Streetwise Reports LLC and its directors, officers, employees or members of their families, as well as persons interviewed for articles and interviews on the site, may have a long or short position in securities mentioned. Directors, officers, employees or members of their immediate families are prohibited from making purchases and/or sales of those securities in the open market or otherwise from the time of the interview or the decision to write an article until three business days after the publication of the interview or article. The foregoing prohibition does not apply to articles that in substance only restate previously published company releases. As of the date of this article, officers and/or employees of Streetwise Reports LLC (including members of their household) own shares of Newmont Goldcorp, a company mentioned in this article.
Proven and Probable LLC receives financial compensation from its sponsors. The compensation is used is to fund both sponsor-specific activities and general report activities, website, and general and administrative costs. Sponsor-specific activities may include aggregating content and publishing that content on the Proven and Probable website, creating and maintaining company landing pages, interviewing key management, posting a banner/billboard, and/or issuing press releases. The fees also cover the costs for Proven and Probable to publish sector-specific information on our site, and also to create content by interviewing experts in the sector. Monthly sponsorship fees range from $1,000 to $4,000 per month. Proven and Probable LLC does accept stock for payment of sponsorship fees. Sponsor pages may be considered advertising for the purposes of 18 U.S.C. 1734.
The Information presented in Proven and Probable is provided for educational and informational purposes only, without any express or implied warranty of any kind, including warranties of accuracy, completeness, or fitness for any particular purpose. The Information contained in or provided from or through this forum is not intended to be and does not constitute financial advice, investment advice, trading advice or any other advice. The Information on this forum and provided from or through this forum is general in nature and is not specific to you the User or anyone else. You should not make any decision, financial, investments, trading or otherwise, based on any of the information presented on this forum without undertaking independent due diligence and consultation with a professional broker or competent financial advisor. You understand that you are using any and all Information available on or through this forum at your own risk.
The pros and cons of the deal are discussed in an iA Securities report.
In an Oct. 8 research note, iA Securities analyst Elias Foscolos reported that Tidewater Midstream and Infrastructure Ltd. (TWM:TSX; TWMIF:OTCMKTS) entered an agreement to acquire Husky Energy’s Prince George Refinery (PGR) for about $277 million. The deal is expected to close in Q4/19.
IA Securities wants to wait and see how this “bold acquisition” plays out for Tidewater, Foscolos indicated. On one hand, he pointed out, Tidewater “should benefit from high crack spreads making the acquisition attractive.” Recent spreads averaged about $5055 per barrel ($5055/bbl) whereas Tidewater used a $44/bbl calculation in determining annual EBITDA contributions from PGR would be around $75 million.
This difference constitutes upside for Tidewater as crack spreads are expected to stay higher for the ensuing 12 months and the break even point for the company is an estimated $30/bbl barrel, according to iA estimates.
On the other hand, Foscolos highlighted, Tidewater’s purpose in doing the deal with Husky is to help delever its balance sheet to two and a half to three and a half times. Because refining is a different business segment for Tidewater and deleveraging relies on the acquired asset’s future performance, the strategy is risky.
Due to that heightened risk, iA Securities trimmed its target price on Tidewater to CA$1.75 per share from CA$1.80. In comparison, the energy company’s share price today is around CA$0.98.
Also, Tidewater is financing the PGR acquisition with debt, which requires an up to $600 million increase to its credit facility and a $100 million term loan.
Finally, Tidewater has a five-year offtake agreement with Husky covering 90% of volumes produced by PGR. While this “adds certainty for Tidewater, the sale of Husky’s retail business adds longer-term uncertainty,” Foscolos commented.
IA Securities has a Speculative Buy rating on Tidewater.
Disclosure: 1) Doresa Banning compiled this article for Streetwise Reports LLC and provides services to Streetwise Reports as an independent contractor. She or members of her household own securities of the following companies mentioned in the article: None. She or members of her household are paid by the following companies mentioned in this article: None. 2) The following companies mentioned in this article are billboard sponsors of Streetwise Reports: None. Click here for important disclosures about sponsor fees. 3) Comments and opinions expressed are those of the specific experts and not of Streetwise Reports or its officers. The information provided above is for informational purposes only and is not a recommendation to buy or sell any security. 4) The article does not constitute investment advice. Each reader is encouraged to consult with his or her individual financial professional and any action a reader takes as a result of information presented here is his or her own responsibility. By opening this page, each reader accepts and agrees to Streetwise Reports’ terms of use and full legal disclaimer. This article is not a solicitation for investment. Streetwise Reports does not render general or specific investment advice and the information on Streetwise Reports should not be considered a recommendation to buy or sell any security. Streetwise Reports does not endorse or recommend the business, products, services or securities of any company mentioned on Streetwise Reports. 5) From time to time, Streetwise Reports LLC and its directors, officers, employees or members of their families, as well as persons interviewed for articles and interviews on the site, may have a long or short position in securities mentioned. Directors, officers, employees or members of their immediate families are prohibited from making purchases and/or sales of those securities in the open market or otherwise from the time of the interview or the decision to write an article until three business days after the publication of the interview or article. The foregoing prohibition does not apply to articles that in substance only restate previously published company releases.
Disclosures from iA Securities, Tidewater Midstream and Infrastructure Ltd., Research Update, October 8, 2018
Conflicts of Interest: The research analyst and or associates who prepared this report are compensated based upon (among other factors) the overall profitability of iA Securities, which may include the profitability of investment banking and related services. In the normal course of its business, iA Securities may provide financial advisory services for the issuers mentioned in this report. iA Securities may buy from or sell to customers the securities of issuers mentioned in this report on a principal basis.
Analyst’s Certification: Each iA Securities research analyst whose name appears on the front page of this research report hereby certifies that (i) the recommendations and opinions expressed in the research report accurately reflect the research analyst’s personal views about the issuer and securities that are the subject of this report and all other companies and securities mentioned in this report that are covered by such research analyst and (ii) no part of the research analyst’s compensation was, is, or will be directly or indirectly, related to the specific recommendations or views expressed by such research analyst in this report.
Analyst Trading: iA Securities permits analysts to own and trade in the securities and or the derivatives of the issuer under their research coverage, subject to the following restrictions. No trades can be executed in anticipation of coverage for a period of 30 days prior to the issuance of the report and 5 days after the dissemination of the report to our clients. For a change in recommendation, no trading is allowed for a period of 24 hours after the dissemination of such information to our clients. A transaction against an analyst’s recommendation can only be executed for a reason unrelated to the outlook of the stock for the issuer and with the prior approval of the Director of Research and the Chief Compliance Officer.
In the past 12 months, Industrial Alliance Securities Inc. has managed or co-managed a public offering of securities for the issuer.
The analyst has visited the issuer’s operations. No payment or reimbursement was received from the issuer for the associated travel costs.
Soliton Inc. shares traded 10% higher today after advising that later this month it will present the data from clinical trials for its Rapid Acoustic Pulse device used in the treatment of keloid and hypertrophic scars at the American Society for Dermatologic Surgery Annual Meeting.
Aesthetic medical device company Soliton Inc. (SOLY:NASDAQ), which states that it utilizes a novel and proprietary platform technology licensed from the University of Texas on behalf of the MD Anderson Cancer Center, today announced that the company’s preliminary proof of concept study results using its Rapid Acoustic Pulse (RAP) device for the treatment of fibrotic (keloid and hypertrophic) scars has been selected for presentation via abstract at the American Society for Dermatologic Surgery Annual Meeting on October 24, 2019, in Chicago, Illinois.
Christopher Capelli, MD, founder, president and CEO of Soliton, commented, “We are pleased to be presenting the results from our initial follow-up visit to attendees at this important dermatology conference…We look forward to being able to share these results with our shareholders and all interested parties as quickly as possible after the conference. We view this proof-of-concept trial as the starting point for demonstrating that our technology could impact other fibrotic disorders. The same mechanism of action at work to reduce keloid and hypertrophic scars could likely extend to such indications as capsular contraction, Peyrone’s Disease, and even liver fibrosis.”
The company states in the announcement that “fibrotic scars, such as keloid and hypertrophic scars, represent wound healing gone awry.” The firm further explains that “existing published research suggests that factors relating to the wound-healing environment (including tension at the boundary of the scar) can cause fibroblasts to become stuck in a hyper-productive loop, unable to stop the production of collagen that leads to the thickened, raised and dense structures often associated with these fibrotic scars.”
Soliton reports that the American Osteopathic College of Dermatology estimates that keloids affect around 10% of people, whereas hypertrophic scars are more common and affect men and women from any racial group equally, although people between the ages of 10 and 30 years old are more likely to be affected.
A few days ago the Soliton announced that its article, “Increased Tattoo Fading in a Single Laser Tattoo Removal Session Enabled By a Rapid Acoustic Pulse Device: A Prospective Clinical Trial,” will be published in the next issue of Lasers in Surgery and Medicine journal. LSM will feature the article as its Editors Choice paper.
Dr. Capelli added, “We are truly pleased to have our article published in the Lasers in Surgery and Medicine journal…given the high value Soliton places on developing its products with a foundation of real science. Publication in this journal is true validation of our technology and trial results and selection by the editors for the ‘Editor’s Choice’ paper is even more gratifying.”
Just one week ago the firm announced it has completed all patient treatments in the keloid scar proof-of-concept trial. The company advised that the study, which was conducted by Dr. Brenda LaTowsky, Board Certified Dermatologist at Clear Dermatology & Aesthetic Center in Scottsdale, Ariz., was designed to evaluate the safety and efficacy for all patients through a 12-week time point.
Dr. Capelli noted, “We eagerly anticipate the follow-up visits with these patients. Demonstrating success in this trial would lay a foundation for Soliton to pursue treatment for many other fibrotic disorders.”
Soliton, which is based in Houston, Tex., advises that its first FDA cleared commercial product will use rapid pulses of acoustic shockwaves as an accessory to lasers for the removal of unwanted tattoos. The firm states that it is actively engaged in bringing the Rapid Acoustic Pulse device to the market, and believes its proprietary method has the potential to lower tattoo removal costs for patients, while increasing profitability to practitioners, compared to current laser removal methods.
Soliton has a market capitalization of about $184.1 million with 16.09 million shares outstanding. The stock has a 52-week price range of $4.1229.00. This morning, SOLY shares opened at $11.53 (+$0.09, +0.79%) over yesterday’s $11.44 closing price. The stock has traded today between $11.53 and $12.85/share and is currently trading at $12.58 (+$1.14, +9.97%).
Disclosure: 1) Stephen Hytha compiled this article for Streetwise Reports LLC and provides services to Streetwise Reports as an independent contractor. He or members of his household own securities of the following companies mentioned in the article: None. He or members of his household are paid by the following companies mentioned in this article: None. 2) The following companies mentioned in this article are billboard sponsors of Streetwise Reports: None. Click here for important disclosures about sponsor fees. 3) Comments and opinions expressed are those of the specific experts and not of Streetwise Reports or its officers. The information provided above is for informational purposes only and is not a recommendation to buy or sell any security. 4) The article does not constitute investment advice. Each reader is encouraged to consult with his or her individual financial professional and any action a reader takes as a result of information presented here is his or her own responsibility. By opening this page, each reader accepts and agrees to Streetwise Reports’ terms of use and full legal disclaimer. This article is not a solicitation for investment. Streetwise Reports does not render general or specific investment advice and the information on Streetwise Reports should not be considered a recommendation to buy or sell any security. Streetwise Reports does not endorse or recommend the business, products, services or securities of any company mentioned on Streetwise Reports. 5) From time to time, Streetwise Reports LLC and its directors, officers, employees or members of their families, as well as persons interviewed for articles and interviews on the site, may have a long or short position in securities mentioned. Directors, officers, employees or members of their immediate families are prohibited from making purchases and/or sales of those securities in the open market or otherwise from the time of the interview or the decision to write an article until three business days after the publication of the interview or article. The foregoing prohibition does not apply to articles that in substance only restate previously published company releases. 6) This article does not constitute medical advice. Officers, employees and contributors to Streetwise Reports are not licensed medical professionals. Readers should always contact their healthcare professionals for medical advice.
The changes made and the reasons for them are detailed in a Raymond James report.
In an Oct. 8 research note, analyst Justin Jenkins reported that Raymond James raised its target price on Phillips 66 (PSX:NYSE) to $120 per share from $117 “on higher conviction in earnings quality/outlook.” Currently, the energy company’s share price is around $102.71.
Raymond James expects Q3/19 to be another strong quarter for Phillips 66 and as such, increased its earnings per share (EPS) forecast on the company to $2.55 from $2.30. Similarly, due to recent strength in refining margins, the investment bank boosted its Q4/19 EPS estimate to $2.03 from $1.78, which is above consensus’ projected $1.97 EPS.
Jenkins described Phillips 66 as a “high-quality story.” He noted it has “strong cash-generating assets that support growth in the higher-value Midstream and Chemicals segments to drive earnings power higher over time.”
“Importantly, while the growth outlook remains solid, we also believe the strength of the refining assets that can be realized in the coming years remains under appreciated. With an excellent management team that has a keen focus on continued discipline in capital allocation and business optimization, we view PSX as a core holding,” Jenkins stated.
Raymond James has an Outperform rating on Phillips 66.
Disclosure: 1) Doresa Banning compiled this article for Streetwise Reports LLC and provides services to Streetwise Reports as an independent contractor. She or members of her household own securities of the following companies mentioned in the article: None. She or members of her household are paid by the following companies mentioned in this article: None. 2) The following companies mentioned in this article are billboard sponsors of Streetwise Reports: None. Click here for important disclosures about sponsor fees. 3) Comments and opinions expressed are those of the specific experts and not of Streetwise Reports or its officers. The information provided above is for informational purposes only and is not a recommendation to buy or sell any security. 4) The article does not constitute investment advice. Each reader is encouraged to consult with his or her individual financial professional and any action a reader takes as a result of information presented here is his or her own responsibility. By opening this page, each reader accepts and agrees to Streetwise Reports’ terms of use and full legal disclaimer. This article is not a solicitation for investment. Streetwise Reports does not render general or specific investment advice and the information on Streetwise Reports should not be considered a recommendation to buy or sell any security. Streetwise Reports does not endorse or recommend the business, products, services or securities of any company mentioned on Streetwise Reports. 5) From time to time, Streetwise Reports LLC and its directors, officers, employees or members of their families, as well as persons interviewed for articles and interviews on the site, may have a long or short position in securities mentioned. Directors, officers, employees or members of their immediate families are prohibited from making purchases and/or sales of those securities in the open market or otherwise from the time of the interview or the decision to write an article until three business days after the publication of the interview or article. The foregoing prohibition does not apply to articles that in substance only restate previously published company releases.
Disclosures from Raymond James, Phillips 66, October 8, 2019
ANALYST INFORMATION
Analyst Holdings and Compensation: Equity analysts and their staffs at Raymond James are compensated based on a salary and bonus system. Several factors enter into the bonus determination including quality and performance of research product, the analyst’s success in rating stocks versus an industry index, and support effectiveness to trading and the retail and institutional sales forces. Other factors may include but are not limited to: overall ratings from internal (other than investment banking) or external parties and the general productivity and revenue generated in covered stocks.
The analyst Justin Jenkins, primarily responsible for the preparation of this research report, attest to the following: (1) that the views and opinions rendered in this research report reflect his or her personal views about the subject companies or issuers and that no part of the research analyst’s compensation was, is, or will be directly or indirectly related to the specific recommendations or views in this research report. In addition, said analyst(s) has not received compensation from any subject company in the last 12 months.
RAYMOND JAMES RELATIONSHIP DISCLOSURES Certain affiliates of the RJ Group expect to receive or intend to seek compensation for investment banking services from all companies under research coverage within the next three months.
Raymond James & Associates, Inc. makes a market in the shares of Phillips 66.
Additional Risk and Disclosure information, as well as more information on the Raymond James rating system and suitability categories, is available here.
The details regarding those metals sales are provided in a BMO Capital Markets report.
In an Oct. 8 research note, BMO Capital Markets analyst Andrew Kaip reported that Royal Gold Inc.’s (RGLD:NASDAQ; RGL:TSX) Q1 FY20 revenue was higher than anticipated and costs, lower. Accordingly, “we expect positive revisions to Q1 FY20 earnings and cash flow,” he added.
Kaip highlighted the U.S. firm’s sales during the quarter, which amounted to about 60,000 ounces (60 Koz) of gold equivalent. The total was 13% higher than BMO’s estimate despite expectations for lower streaming sales resulting from production limitations at Mt. Milligan during calendar Q1/19.
The total gold equivalent ounces sold with respect to Royal Gold’s streaming agreements constituted 50 Koz gold, 510 Koz silver and 1,100 tons of copper.
Of the three metals, only gold sales were higher, thus primarily accounting for the beat. The reason for that was a drawdown and sellout of gold inventory, leaving the company with 18 Koz of the precious metal currently in inventory.
Royal Gold intends to release its Q1 FY20 results on Nov. 6, 2019, after the market closes and hold a conference call the following day at noon EST.
BMO has a Market Perform rating on Royal Gold. It is currently trading at around $129.88 per share.
Disclosure: 1) Doresa Banning compiled this article for Streetwise Reports LLC and provides services to Streetwise Reports as an independent contractor. She or members of her household own securities of the following companies mentioned in the article: None. She or members of her household are paid by the following companies mentioned in this article: None. 2) The following companies mentioned in this article are billboard sponsors of Streetwise Reports: None. Click here for important disclosures about sponsor fees. 3) Comments and opinions expressed are those of the specific experts and not of Streetwise Reports or its officers. The information provided above is for informational purposes only and is not a recommendation to buy or sell any security. 4) The article does not constitute investment advice. Each reader is encouraged to consult with his or her individual financial professional and any action a reader takes as a result of information presented here is his or her own responsibility. By opening this page, each reader accepts and agrees to Streetwise Reports’ terms of use and full legal disclaimer. This article is not a solicitation for investment. Streetwise Reports does not render general or specific investment advice and the information on Streetwise Reports should not be considered a recommendation to buy or sell any security. Streetwise Reports does not endorse or recommend the business, products, services or securities of any company mentioned on Streetwise Reports. 5) From time to time, Streetwise Reports LLC and its directors, officers, employees or members of their families, as well as persons interviewed for articles and interviews on the site, may have a long or short position in securities mentioned. Directors, officers, employees or members of their immediate families are prohibited from making purchases and/or sales of those securities in the open market or otherwise from the time of the interview or the decision to write an article until three business days after the publication of the interview or article. The foregoing prohibition does not apply to articles that in substance only restate previously published company releases.
Disclosures from BMO Capital Markets, Royal Gold, October 8, 2019
IMPORTANT DISCLOSURES
Analyst’s Certification I, Andrew Kaip, hereby certify that the views expressed in this report accurately reflect my personal views about the subject securities or issuers. I also certify that no part of our compensation was, is, or will be, directly or indirectly, related to the specific recommendations or views expressed in this report.
Analysts who prepared this report are compensated based upon (among other factors) the overall profitability of BMO Capital Markets and their affiliates, which includes the overall profitability of investment banking services. Compensation for research is based on effectiveness in generating new ideas and in communication of ideas to clients, performance of recommendations, accuracy of earnings estimates, and service to clients.
Analysts employed by BMO Nesbitt Burns Inc. and/or BMO Capital Markets Limited are not registered as research analysts with FINRA. These analysts may not be associated persons of BMO Capital Markets Corp. and therefore may not be subject to the FINRA Rule 2241 restrictions on communications with a subject company, public appearances and trading securities held by a research analyst account.
Company Specific Disclosures
Disclosure 5: BMO Capital Markets or an affiliate received compensation for products or services other than investment banking services within the past 12 months from Royal Gold.
Disclosure 6C: Royal Gold is a client (or was a client) of BMO Nesbitt Burns Inc., BMO Capital Markets Corp., BMO Capital Markets Limited or an affiliate within the past 12 months: C) Non-Securities Related Services. Disclosure 9B: BMO Capital Markets makes a market in Royal Gold in United States.
For Important Disclosures on the stocks discussed in this report, please click here.
The recent rotation in the US stock market and US major indexes have set up a very interesting pattern in the Metals and VIX charts. Our researchers believe precious metals, Gold and Silver, are setting up a new momentum base/bottom and are beginning an early stage bullish price rally that may surprise many traders. If you have not been following our research, please take a minute to read these past research posts :
Our researchers believe the bottom in Metals has already set up on October 1, 2019. This setup aligns with our earlier analysis that a new bullish price leg is setting up that will propel Gold to levels above $1600 before the end of November – possibly resulting in a rally that attempts to breach the $1700 price level.
As skilled technical traders, there are times when we must understand how the news cycles and external events can have dramatic impact on prices and trends in the financial markets. These are times when we must protect our assets by deploying very skilled trades, proper position sizing and become even more skilled at understanding the global stock market dynamics.
Daily Silver Chart
Silver, or as we have termed it “The Super-HERO of Metals”, will likely move much higher, even faster than Gold. If our research is correct, the next upside price leg in Metals will see Silver rally to levels well above $20, then stall briefly, then begin a move to levels above $26 (or higher). The Gold to Silver ratio will likely fall to levels near 65 throughout this move. That would mean that Silver would appreciate about 11% to 15% faster than Gold will appreciate over the next 60 to 90+ days.
VIX – Daily Volatility Index Chart
And finally, the VIX. At this point, our research team believes a broader downside price rotation has already begun to set up in the US stock market (with Technology and “unicorn” sectors at severe risk) which may prompt a move in prices to retest the December 2018 lows. This is why we believe the VIX is very likely to begin an upside price move over the next 30 to 60+ days and attempt to break above the 26 to 27 level as the US stock market reacts to increased fear and uncertainty. This is, obviously, also why we believe Gold and Silver will begin to move dramatically higher very quickly.
Our researchers are attempting to follow all the news and price activity we can handle over the past 4+ weeks or longer. At this point, it seems all the global markets are unstable in terms of price trends, extended volatility, and uncertainty. We believe our expectations within the metals markets, us stock market and the VIX predictions are relatively saved expectations given the research we’ve completed.
It would be wise for skilled traders to prepare for a moderate to deep price correction at this point. Price has failed to move higher above historic all-time high price levels and has begun to move lower. Unless some extremely positive news, event or outcome is reached within the next 90+ days, it is very likely that price will continue to rotate within established ranges attempting to identify true support levels. This ride could become very volatile – very quickly.
As a technical analysis and trader since 1997, I have been through a few bull/bear market cycles. I believe I have a good pulse on the market and timing key turning points for both short-term swing trading and long-term investment capital. The opportunities are massive/life-changing if handled properly.
Be sure to ride my coattails as I navigate these financial markets and build wealth while others lose nearly everything they own during the next financial crisis.
I can tell you that huge moves are about to start unfolding not only in metals, or stocks but globally and some of these supercycles are going to last years. My simple technical trading strategy using ETFs will allow you to follow the markets closely and trade with it so you never get caught on the wrong side of the market with big losses.
NOTICE: Our free research does not constitute a trade recommendation or solicitation for our readers to take any action regarding this research. It is provided for educational purposes only. Our research team produces these research articles to share information with our followers/readers in an effort to try to keep you well informed. Visit our web site to learn how to take advantage of our members-only research and trading signals.