By Hussein Sayed, Chief Market Strategist (Gulf & MENA), ForexTime
Positive US earnings offset by weak economic data
Fall in US retail sales increases bets for 25 basis points rate cut
Pound falls after DUP said they won’t support current Brexit deal
Investors are positioning themselves for a choppy ending to the trading week. After positive earnings from US banks boosted major indices on Tuesday, weak data from the world’s largest economy led investors to question if this rally is sustainable. Brexit headlines continue to provide mixed signals despite a deal looking more likely when compared to a week ago. Meanwhile, there seem to be dark clouds hanging over the US-China trade deal after US House of Representatives passed a bill in support of anti-government protestors in Hong Kong.
US consumers are spending less
The US manufacturing sector and business spending have been showing signs of weakness over the past couple of months. However, investors were still optimistic that the US consumer, the biggest driver of economic growth, remained in good health. Data on Wednesday proved this is no longer the case after US retail sales dropped for the first time in seven months, suggesting there may be some cracks in the key component of the US growth engine. Retails sales fell 0.3% in September from an upwardly revised 0.6% increase in August. While a single economic release isn’t enough to conclude that consumers are becoming more cautious, it may strengthen the belief that the weakness in other parts of the economy will translate into less consumer spending.
The data increased bets of a third rate cut in the cycle by the Federal Reserve at its meeting later this month. According to CME’s Fed Watch Tool, the chances of 25 basis point rate cut increased to 87.1% from 82.3% a week ago. Given that a rate cut is mostly priced into markets, any development in trade and earnings will guide the direction of equities and fixed income assets.
A lot of noise from Brexit headlines
Sterling has moved six big figures since last Thursday or 5.5% higher against the US Dollar, topping at 1.2875 yesterday as a Brexit deal seemed very near from almost a zero chance a week ago. Helping boost the rally were reports that the DUP may be willing to accept the new terms of the deal of Prime Minister Boris Johnson. However, a statement from DUP Leader Arlene Foster this morning has pressured Sterling as she said her party won’t now support the Brexit deal as it currently stands. At the time of writing Sterling is trading down 0.6% against the Dollar.
Looking at options markets, dealers started adding more premium on the short side than the long side after the DUP statement. While a lot can change over the next 48 hours, predicting Sterling’s next move is very tricky. However, given that a significant amount of optimism related to a Brexit deal has already been priced in, any further negative headlines will pressure Sterling today.
Disclaimer: The content in this article comprises personal opinions and should not be construed as containing personal and/or other investment advice and/or an offer of and/or solicitation for any transactions in financial instruments and/or a guarantee and/or prediction of future performance. ForexTime (FXTM), its affiliates, agents, directors, officers or employees do not guarantee the accuracy, validity, timeliness or completeness, of any information or data made available and assume no liability as to any loss arising from any investment based on the same.
mixed signals despite a deal looking more likely when compared to a week ago. Meanwhile, there… Read More
US stocks pulled back on Wednesday after a weak retail sales report. The S&P 500 slid 0.2% to 2989.69. The Dow Jones industrial average slipped 0.1% to 27002.52. Nasdaq lost 0.3% to 8124.18. The dollar weakening accelerated after US Census Bureau reported retail sales in September fell 0.3% over month when 0.3% increase was expected. The live dollar index data show the ICE US Dollar index, a measure of the dollar’s strength against a basket of six rival currencies, slid 0.3% to 98.01 but is higher currently. Stock index futures point to mixed openings today.
DAX gains while European indexes slip
European stock indexes ended mixed on Wednesday against the background of weak data. Both GBP/USD and EUR/USD continued climbing yesterday with Pound turning lower currently while euro higher still. The Stoxx Europe 600 slipped 0.05% led by financial shares as euro-zone final inflation came in at 0.8% after 1% gain in August. Germany’s DAX 30 rose 0.3% to 12670.11. France’s CAC 40 slid 0.1% and UK’s FTSE 100 lost 0.6% to 7167.95 as Brexit negotiators failed to reach a deal the last day of talks before a crucial European Union summit.
Hang Seng gains while Asian indexes decline
Asian stock indices are mixed today after reports Treasury Secretary Steve Mnuchin said Washington hopes President Donald Trump and China’s President Xi Jinping will sign an agreement at the Asia-Pacific Economic Cooperation summit in Chile in mid-November. Nikkei slipped 0.1% to 22451.86 despite yen resumed slide against the dollar. Chinese stocks are mixed: the Shanghai Composite Index is down 0.05% while Hong Kong’s Hang Seng Index is 0.6% higher. Australia’s All Ordinaries Index turned 0.8% lower as Australian dollar accelerated its climb against the greenback.
Brent futures prices are edging higher today. Prices gained yesterday despite American Petroleum Institute report late Wednesday US crude inventories rose by 10.5 million barrels last week. December Brent crude added 1.2% to $59.42 a barrel on Wednesday. Today at 16:30 CET the Energy Information Administration will release US Crude Oil Inventories.
Note: This overview has an informative and tutorial character and is published for free. All the data, included in the overview, are received from public sources, recognized as more or less reliable. Moreover, there is no guarantee that the indicated information is full and precise. Overviews are not updated. The whole information in each overview, including opinion, indicators, charts and anything else, is provided only for familiarization purposes and is not financial advice or а recommendation. The whole text and its any part, as well as the charts cannot be considered as an offer to make a deal with any asset. IFC Markets and its employees under any circumstances are not liable for any action taken by someone else during or after reading the overview.
Shares of Relmada Therapeutics have traded wildly today after it announced Phase 2 results for its anti-depressant drug dextromethadone. The firm’s shares have traded 100200% higher today and the stock was halted several times trading due to extreme price volatility.
Early this morning, Relmada Therapeutics Inc. (RLMD:NASDAQ), a clinical-stage company developing novel therapies for the treatment of central nervous system (CNS) diseases, reported top-line data from REL-1017-202, a double-blind, placebo-controlled Phase 2 clinical study evaluating the safety, tolerability and efficacy of two doses of REL-1017 (dextromethadone), 25 mg once a day and 50 mg once a day, as an adjunctive treatment in patients with treatment resistant depression.
The firm reported that the Phase 2 study measured 62 adult subjects with major depressive disorder (MDD) who did not respond to one to three courses of antidepressant treatment in their current episode. The key findings of the trial were that “subjects in both the REL-1017 25 mg and 50 mg treatment groups experienced statistically significant improvement of their depression compared to subjects in the placebo group on all efficacy measures, including: the Montgomery-Asberg Depression Rating Scale (MADRS); the Clinical Global Impression-Severity (CGI-S) scale; the Clinical Global Impression-Improvement (CGI-I) scale; and the Symptoms of Depression Questionnaire (SDQ).” The company advised that the study also confirmed the favorable safety and tolerability profile of REL-1017 as was also observed in the Phase 1 studies.
Dr. Ottavio Vitolo, Relmada’s head of R&D and chief medical officer, commented, “We are very pleased to announce these highly compelling results…This is the first clinical evidence that REL-1017 exerts a rapid and robust antidepressant effect, which continues even after treatment discontinuation. These findings replicate what was previously observed in animal studies and support a potentially neurotrophic effect of REL-1017. We would like to thank the participating investigators, our collaborators at Syneos Health and our colleagues at the Massachusetts General Hospital (MGH) Clinical Trials Network and Institute, whose contribution was critical to controlling the placebo response. We look forward to continuing the development of REL-1017 with the goal of bringing a new effective treatment to the millions of patients suffering from depression.”
Regarding the study, Maurizio Fava, M.D., chief of the Department of Psychiatry, Massachusetts General Hospital, added, “The results of this Phase 2 study demonstrate a solid and rapid antidepressant effect and overall favorable tolerability and safety profile of REL-1017…Ultimately, the goal is to improve the lives of individuals with serious depression who have not responded to standard therapies. These data suggest that REL-1017 could offer a treatment option to such patients, and I am hopeful that the results of ongoing studies will continue to show great promise.”
Relmada’s CEO Sergio Traversa also noted, “We are delighted to report these data that we believe represent a critical step forward in the effort to bring a new and potentially treatment paradigm changing option to patients who suffer from major depression…These results confirm for the first time in severely depressed patients that REL-1017 is showing rapid, statistically and clinically meaningful antidepressant activity, in conjunction with a favorable tolerability and safety profile, and a simple oral administration regime. We look forward to discussing with the U.S. Food and Drug Administration the next steps to enable us to rapidly advance the clinical development of this important clinical program.”
The company explains in the report that it is developing dextromethadone (REL 1017) as a rapidly acting oral agent for the treatment of depression, and that dextromethadone works as an NMDA receptor antagonist and on the same binding site as ketamine, but has shown no ketamine psychotomimetics side effects. The firm further claims that dextromethadone is fundamentally differentiated from all currently FDA-approved antidepressants, as well as all atypical antipsychotics used adjunctively. The firm indicated that the U.S. FDA granted Fast Track designation for dextromethadone for the adjunctive treatment of major depressive disorder in April 2017.
Relmada Therapeutics states that it is a clinical-stage, biotechnology company “developing novel medicines that potentially address areas of high unmet medical need” in the treatment of depression, central nervous system (CNS) diseases and ophthalmological disorders. The company’s diversified portfolio of products at various stages of development include its lead program, dextromethadone (REL-1017), an N-methyl-D-aspartate (NMDA) receptor antagonist as a rapid-acting oral treatment for depression. The firm advises that NMDA receptor antagonists may have potential in the treatment of a range of psychiatric and neurological disorders associated with a variety of cognitive, neurological and behavioral symptoms.
Relmada Therapeutics began the day with a market capitalization of about $110.8 million with approximately 9.894 million shares outstanding. RLMD shares opened much higher today at $32.10 (+$20.9048, +186.733%) over yesterday’s $11.1952 closing price. The stock has traded wildly today between $18.67 and $36.00/share and closed at $26.20 (+$15.00, +134.03%).
Disclosure: 1) Stephen Hytha compiled this article for Streetwise Reports LLC and provides services to Streetwise Reports as an independent contractor. He or members of his household own securities of the following companies mentioned in the article: None. He or members of his household are paid by the following companies mentioned in this article: None. 2) The following companies mentioned in this article are billboard sponsors of Streetwise Reports: None. Click here for important disclosures about sponsor fees. 3) Comments and opinions expressed are those of the specific experts and not of Streetwise Reports or its officers. The information provided above is for informational purposes only and is not a recommendation to buy or sell any security. 4) The article does not constitute investment advice. Each reader is encouraged to consult with his or her individual financial professional and any action a reader takes as a result of information presented here is his or her own responsibility. By opening this page, each reader accepts and agrees to Streetwise Reports’ terms of use and full legal disclaimer. This article is not a solicitation for investment. Streetwise Reports does not render general or specific investment advice and the information on Streetwise Reports should not be considered a recommendation to buy or sell any security. Streetwise Reports does not endorse or recommend the business, products, services or securities of any company mentioned on Streetwise Reports. 5) From time to time, Streetwise Reports LLC and its directors, officers, employees or members of their families, as well as persons interviewed for articles and interviews on the site, may have a long or short position in securities mentioned. Directors, officers, employees or members of their immediate families are prohibited from making purchases and/or sales of those securities in the open market or otherwise from the time of the interview or the decision to write an article until three business days after the publication of the interview or article. The foregoing prohibition does not apply to articles that in substance only restate previously published company releases. 6) This article does not constitute medical advice. Officers, employees and contributors to Streetwise Reports are not licensed medical professionals. Readers should always contact their healthcare professionals for medical advice.
RoboForex, an international broker, announces the official start of its business operations in the Republic of Belarus. The company’s new office already started servicing clients in Minsk, at Myasnikova Street, 70, office 308. Also, the broker launched its website at www.roboforex.by, where clients can register and get access to the Company’s products and services after successfully completing this procedure.
At the moment, residents of the Republic of Belarus and several other countries have an opportunity to invest in 97 instruments through MetaTrader 4 platform. The official presentation of the company will take place during the conference “Systematic approach in investing” organized with support from RoboMarkets/RoboForex Group. The event will take place on October 19th in the “Pekin” hotel in Minsk. Participation in the conference is free.
Andrei Dziarnovich, CEO RoboForex BY: “We’ve brought all our services, offers, and marketing products into conformity with the regulator’s rules and requirements, and are now starting our business operations in the Republic of Belarus. Our office is already servicing its first clients and I hope this number will grow day after day. Right now, our major goal is to expand the client base due to the provision of high-quality and competitive conditions and services. The company will be officially presented on October 19th at the conference “Systematic approach in investing” in Minsk.
In April 2019 the company, which provides services under RoboForex brand in Belarus, received certificate No. 15 of the National Bank of the Republic of Belarus. The company is listed in the forex companies register in accordance with the country’s current legislation. A month later, the registered company became an official member of the The Association for the Development of Financial Market.
About RoboForex
RoboForex is a company, which delivers brokerage services on a world-wide basis. The company provides traders, who work on financial markets, with access to its proprietary trading platforms. RoboForex Ltd has the brokerage license IFSC/60/271/TS. More detailed information about the Company’s products and activities can be found on the official website at www.roboforex.com.
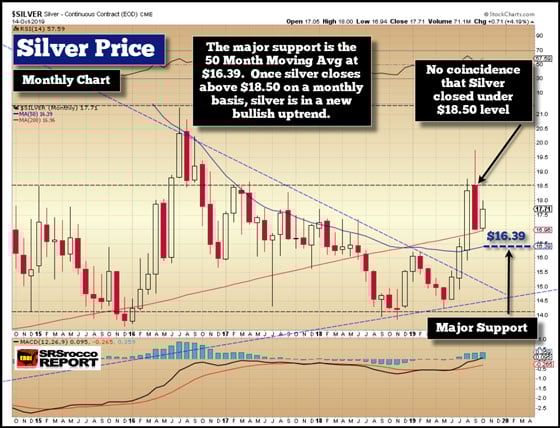
While the silver price is trading at another important short-term technical level, the underlying fundamentals continue to improve. Since silver peaked at $19.75 at the beginning of September, it has been correcting lower to key support levels. As I mentioned in my last update, the silver price would like correct back down to a key support level before moving higher. And, if history is a guide, there is a likely price where that turnaround will occur.
However, it is essential to understand that technical analysis is only one aspect that guides the silver market price. Another more important factor is the improving fundamentals for precious metals as the Fed, and central banks begin to ramp up QE (money printing) once again. Of course, Fed Chairman Powell says the $60 billion a month in Treasury purchases is NOT QE.
I got a good laugh from Sven Henrich (northmantrader.com) response in his article Control:
Don’t call it QE they say, but ignore the fact that they are running a program equal in size to the annual US military budget. At $60B that’s exactly what it is. Massive
Fed Chair Jay Powell: The economy is in a good place. Now here’s a $60B per month Treasury bill buying program, multiple rate cuts and daily repo operations. How stupid do they think we are?
If the U.S. economy is in such a GOOD PLACE, then why does the Federal Reserve need to buy $60 billion a month in U.S. Treasuries? And, as the Northman trader stated, the Fed Treasury purchases are equal in size to the U.S. military spending. According to U.S. Government 2020 fiscal budget, the Department of Defense will spend $718 billion this year. Thus, $60 billion multiplied by 12 months is $720 billion.
That puts it all into perspective. The amount of U.S. Treasuries, the Federal Reserve, is buying a month, is approximately the same amount the military is spending. This is nothing more than SMOKE & MIRRORS to keep the sheep asleep.
Even with the Fed lowering interest rates, continuing repo operations until January 2020, and the $60 billion a month in U.S. Treasury purchases, the Dow Jones Index is still trading near the same level it was at the end of 2017. Sure, we could see the Dow spike higher if the U.S.-China trade agreement is successful, but the underlying fundamentals of the U.S. and global economies continue to weaken.
Which means, the reason to own precious metals will only improve as the Fed and central banks lose control of the QE and zero interest rate policy. This is not an IF, but WHEN.
With that being said, let’s look at where the silver price may head over the short term. Currently, the silver price is trading within another triangle formation. As of the close yesterday, silver closed up against upper triangle formation:
There is no coincidence that silver stopped right at the upper part of the triangle formation for the past four days. When stocks and commodities trade in this pattern, if it breaks above that diagonal line, it would be bullish short term. However, the gold and silver prices have opened lower in U.S. markets this morning. So, it doesn’t look like it will break above that upper triangle trend line, but we don’t know what tomorrow will bring.
If silver does break above that trend line, it could move up higher for a short period. But, we still must consider the COT REPORT structure. Currently, the commercial short position is still near its highs, suggesting there may be a continued correction in the silver price until the shorts have liquidated a significant portion of the positions. Here is the current COT Report for silver. While we may see silver sell continue to sell off over the next few weeks or month, there is a positive sign:
The green arrows show where the net commercial short position was near a high, and the red is when it was at a low. A high commercial net short position means the silver price has reached a short-term top, and the opposite is true when the net commercial short position is at a low. The following silver chart will show the price at the time of these highs and lows in the commercial net short position:
When the commercial net short position was near a high on Feb 26th, the silver price was $15.83. By the time the commercials liquidated the short positions to be at a net-zero on May 28th, the silver price fell to $14.32. As of the current closing date (Tuesday) on the COT Report, silver was trading at $17.80, nearly $2 higher than on Feb 26th. So, with the commercial short positions near a high, the silver price is $2 higher than what it was on Feb 26th.
From Feb 26th to May 28th, the silver price only fell about $1.50. If the same trend takes place, then the silver price would fall right to the critical 50 Month Moving Average shown below at $16.39:
As I have stated several times in articles and video updates, the IMPORTANT KEY LEVEL was the 50 Month Moving Average which silver has been below since 2013. When it finally broke above it in a big way in September, it’s not uncommon for a stock or commodity to retrace that key resistance, now turned support level before moving higher. Thus, if silver corrects back down to that $16.39 level, the commercial short positions will likely be close to a net-zero.
Now, there is no coincidence that the monthly silver price closed right under that important $18.50 level shown in that large red monthly candlestick. While we can blame the market makers for “Painting the chart” by keeping silver below that key technical level, they can’t stop the improving fundamentals that will push the silver price higher over the next several years.
Here are a few words for those who continue to believe technical analysis is worthless in a rigged market. There are two separate events taking place in the market today:
Stocks, bonds, real estate, commodities, and precious metals are trading via technical analysis within a highly manipulated financial system. As stated above, by the Fed buying $60 billion a month of U.S. Treasuries, the same as the monthly military spending, should give an idea of how much the central banks are propping up the markets. So, stocks, bonds, real estate, commodities, and precious metals will continue to trade within that manipulated system until the Fed, and central banks lose control.
When the Fed and central banks lose control of the financial system, and they will, then technical analysis will no longer be a good indicator of the market price. Instead, the surging demand for the precious metals by investors looking to protect their wealth will finally be trading in a free market that will likely go hog-wild.
So, once again. If you want to leave comments on how useless technical analysis is for silver in a rigged market, then stop looking at the daily silver prices. However, if you are going to look at the daily silver prices, then all I am doing is providing short-term analysis on HOW THE TRADERS LOOK AT SILVER.
Do you understand that? With that in mind, I believe as the U.S. Government and China come up with a final trade deal, that could push the stock markets higher and the precious metals lower. Take it or leave it. But, again… that doesn’t change the fact that days of the Fed and central bank control of the financial system are coming to an end.
Lastly, it was an excellent sign to see silver finally break above the 50-month moving average. Furthermore, it isn’t unusual for silver to retrace the key level it broke through before the next leg higher. So, as we wait for the Fed and central banks to make a real mess of the financial system, we are just going to have to watch as silver trades in the current highly rigged market.
The Money Metals News Service provides market news and crisp commentary for investors following the precious metals markets.
Ever since the RBA said they were paying special attention to employment figures when determining future rate policy, the jobless numbers in Australia have become more relevant to the markets.
A consensus still hasn’t formed around when we could expect the next rate cut. And we still are waiting to see how much of an effect the precipitous fall in rates this year has had.
For a while now, Australia’s unemployment rate has been high in comparison to other countries, but within the range that most economists agree is structural.
Wages have been growing steadily and above the inflation rate. Yet policymakers are still trying to bring the rate down further.
Consensus of Expectations
The headline figure for the market is Employment Change. Expectations are for this to come in at +31.5K, compared to 34.7K jobs added in August. Although a little less, it’s still at the top of what has become something of a normal range between +10K and +40K. We could expect a stronger market move if the results were outside of those points.
Projections indicate that the Unemployment rate will stay the same as last month, at 5.3%. Even without a change, it would still be a continuation of the upward trend in the number of jobseekers that has consolidated since bottoming out in March.
Of course this the middle of Australia’s winter, when temporary work is at a low ebb.
The Smaller Data
As a matter of reference, we want to keep an eye on the participation rate.
Expectations are for this to tick up to 66.3% from 66.2% in the prior month. Even if job creation remains healthy, we can still have rising unemployment as more people join the workforce. This appears to be the case for Australia, which has a consistent increase in participation since March.
The question is whether more people are joining because they are being enticed by higher wages (positive for the economy), or whether people who have left the workforce are returning because they are having trouble making ends meet (negative for the economy).
At the same time as the employment data, we get the Quarterly NAB Business Confidence survey. Generally, it doesn’t move the currency directly but is useful for trend traders.
Expectations are for business confidence to improve to 26 from 6. This would be a major improvement, bringing it back to levels not seen since early 2018, back when it appeared, Australia’s economy was doing great. This was before the effects of the trade war.
Going Forward
This is the last of the major data out of Australia for the week. But, there could still be some substantial volatility on Friday, when we get a deluge of Chinese data, including GDP, unemployment and Industrial Production.
Unless there is a major surprise in the employment data and China’s GDP on Friday, there doesn’t seem to be much to suggest the AUD will break out of the descending channel it has been stuck in all year.
New Zealand inflation slowed in the third quarter to 1.5% from a year earlier, after the 1.7% pace in the second quarter. Will the NZDUSD continue falling?
On 1-hour timeframe NZDUSD: H1 is in downtrend, below the 200-period moving average MA(200) which is falling. The RSI indicator is below 50 level but has not reached the oversold zone yet.
In its latest World Economic Outlook released this week, the International Monetary Fund gave a rather downbeat assessment of global financial conditions.
The IMF warned that global growth is projected to fall to just 3% this year. This marks its lowest levels since the 2008 financial crisis, dropping down from 3.8% in 2017.
This latest forecast is a -0.2% revision from the last one issued in July.
Recessionary Risks
The group cautioned that should the rate of global growth slip below 2.5%, this would signify a recession.
Gita Gopinath, the IMF’s chief economist, warned over the handling of such conditions, saying:
“At 3% growth, there is no room for policy mistakes and [there is] an urgent need for policymakers to cooperatively de-escalate trade and geopolitical tensions.”
The IMF has noted that world trade volume growth was just 1% over the first half of 2019. This its lowest level since 2012.
The report cited the ongoing trade war between the US and China as the chief driver for the downward trajectory in world growth.
Looking ahead, the IMF warned that if all planned US and Chinese tariffs are activated, world growth will fall by a further 0.8% into 2020.
Key takeaways from the IMF’s latest outlook
Growth in advanced economies is forecast to slow from 2.3% in 2018 to 1.7% this year.
US growth to slow from 2.9% last year to 2.4% in 2019.
UK growth forecast to fall to 1.2% for 2019, down from 1.4% last year, as a result of Brexit uncertainty.
German growth forecast to hit 0.5% by year-end, down from 1.5% in 2018, as a result of the collapse in automobile production.
China’s economic growth forecast to slide from 6.6% to 6.1% as a result fo the negative impact of US trade tariffs.
Saudi Arabia’s growth forecasts cut by 1.7% this year.
Output growth in India lowered by 0.9%.
In China, output forecasts down by 0.3% this year and 0.2% next year, marking just an 8% growth rate.
Looking ahead, the IMF report noted:
“With uncertainty about prospects for several of these countries, a projected slowdown in China and the US and prominent downside risks, a much more subdued pace of global activity could well materialize.”
Services Sectors Under Threat
Manufacturing readings globally have been falling heavily this year. However, services sector indicators have managed to stabilize.
That being said, the IMF warned that this might not last. They stated:
“The divergence between manufacturing and services has persisted for an atypically long duration, which raises concerns of whether and when weakness in manufacturing may spill over into the services sector,”
In all, the report makes for dire reading. It clearly highlights the damage inflicted by the US/China trade war.
This latest update puts even more focus on the need for a resolution to the trade war. In fact, it hones in on the importance of the ongoing trade talks and the potential for an initial deal between the two countries.
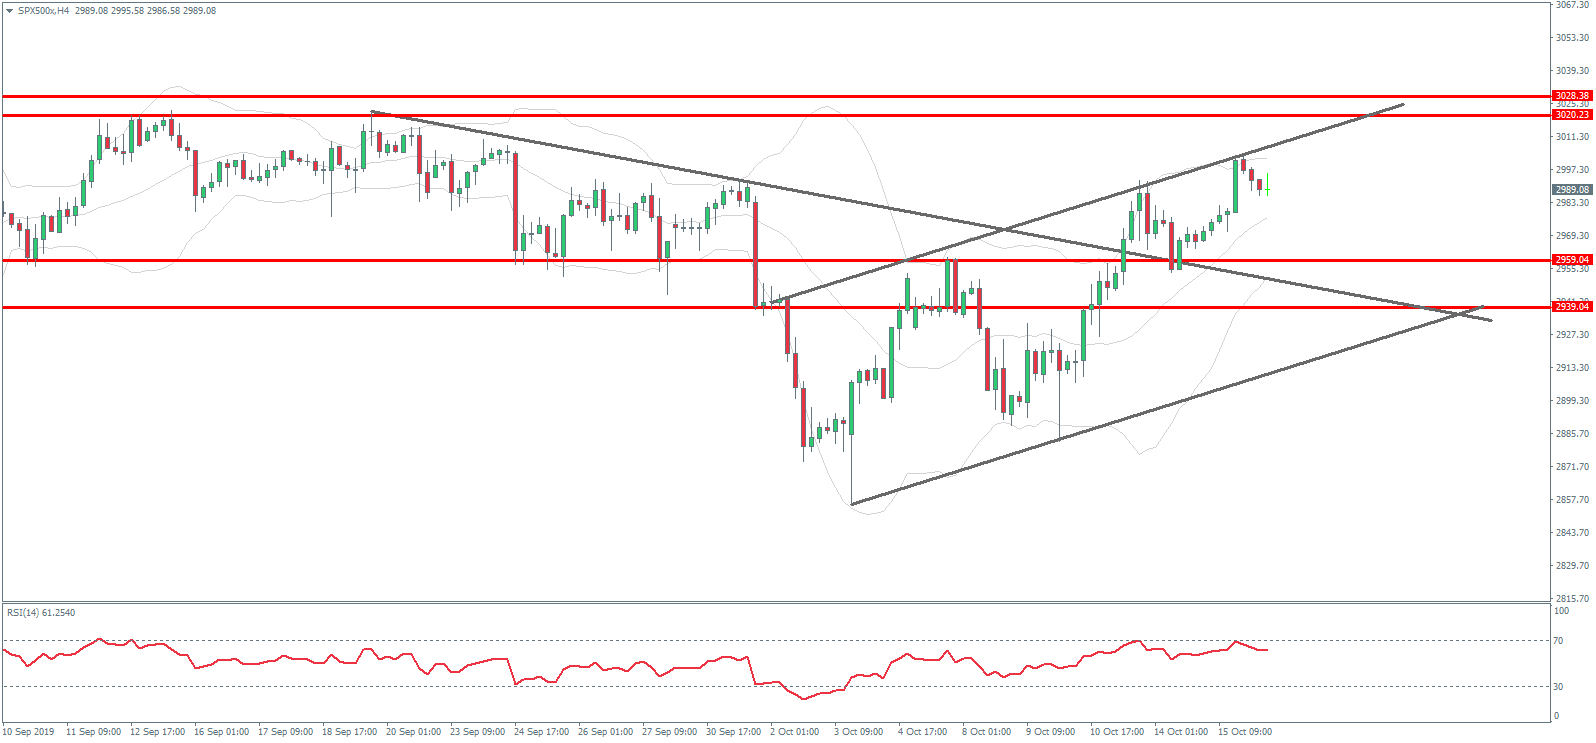
Technical Perspective
The SPX500 continues to move higher within the local bullish channel. Price recently broke out above the bearish trend line from year to date highs and has subsequently retested the trend line, which held as support.
For now, focus is on a further push higher with the band of resistance between 3020.23 and 3028.38 (all-time highs) the next area to watch. To the downside, any retest of the 2959.04 level should find support.
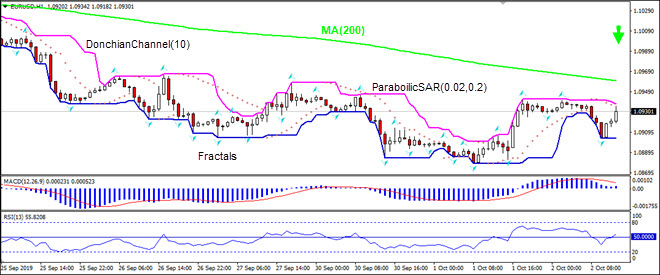
Euro-zone inflation slowed to near 3-year low 0.8% in September. Will the EURUSD decline?
The price chart on 1-hour timeframe shows EURUSD: H1 is trading sideways. The price is above the 200-period moving average MA(200) which is rising. And the RSI is at 50 level and has not reached the oversold zone. There is no trend yet formed, traders have to decide when it would be a best time to enter the market.
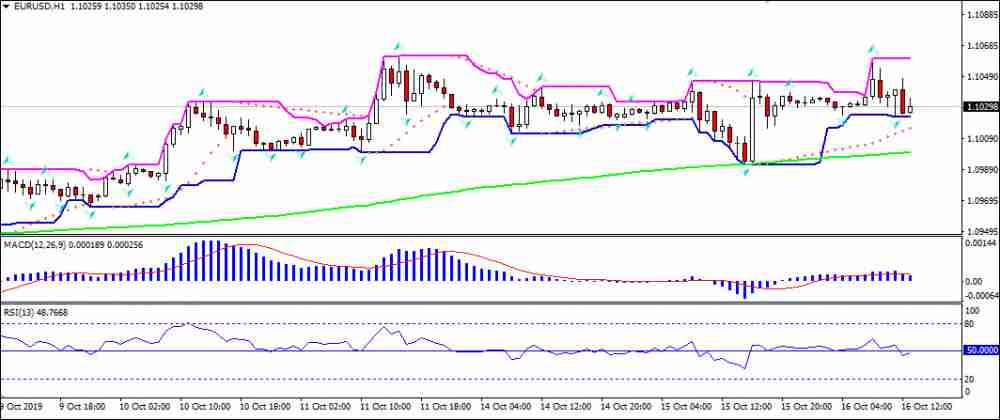
The Dollar index (DXY) immediately fell by some 0.2 percent, dropping below the 98.0 psychological level once more, following the release of the September US retail sales data. The print showed a 0.3 percent month-on-month decline, versus the 0.3 percent gain that markets had expected. This was the first contraction in US retail sales since February.
Considering that the previous three monthly readings on US retail sales had exceeded market expectations, the September contraction sticks out like a sore thumb. US consumers have been propping up the growth momentum in the world’s largest economy, hence any sign of a pullback would then raise concerns over the US economy’s health. Coupled with the fact that the last three readings on the US non-farm payrolls have also underwhelmed markets, the data suggests that the cracks in the US economy are growing.
Investors ramp up expectations for October Fed rate cut following US retail sales decline
Going by the recent economic indicators, it’s no surprise then that investors are raising the odds of the next Fed rate cut. Looking at the Fed funds futures, market expectations for a 25-basis point cut in October jumped by about 10 percentage points to 83 percent, although investors still forecast that the Fed will leave its benchmark interest rates unchanged during the December FOMC meeting.
The Greenback’s decline is offering some reprieve for the likes of the Euro and the Pound, although other currencies in the DXY basket, such as the Canadian and Australian dollars, are still ceding ground to the Dollar.
Disclaimer: The content in this article comprises personal opinions and should not be construed as containing personal and/or other investment advice and/or an offer of and/or solicitation for any transactions in financial instruments and/or a guarantee and/or prediction of future performance. ForexTime (FXTM), its affiliates, agents, directors, officers or employees do not guarantee the accuracy, validity, timeliness or completeness, of any information or data made available and assume no liability as to any loss arising from any investment based on the same.