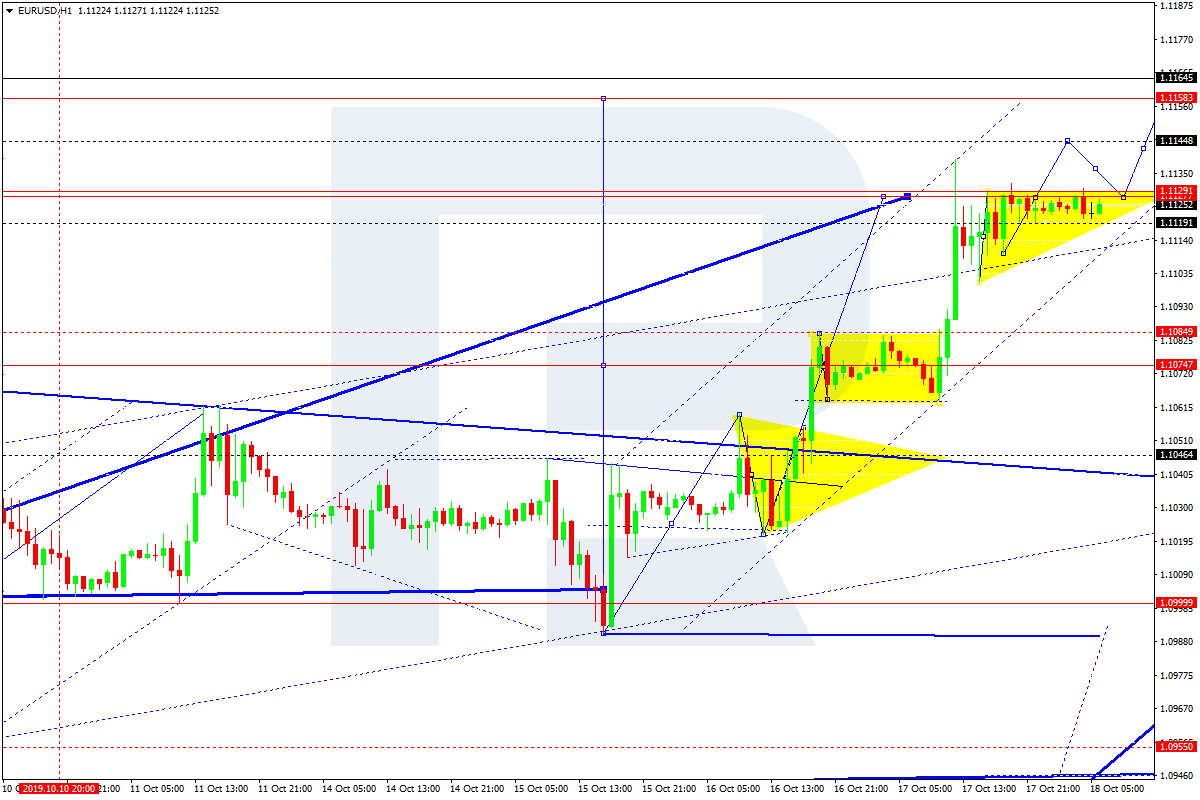
EURUSD continues forming the ascending structure from 1.1074; right now, it is consolidating below 1.1129. Possibly, the pair may break this range to the upside and continue growing towards 1.1144. Later, the market may form a new descending structure to reach 1.1129 and then start another growth towards 1.1158 to complete this ascending wave. After that, the instrument may start a new correction with the target at 1.1000.
GBPUSD, “Great Britain Pound vs US Dollar”
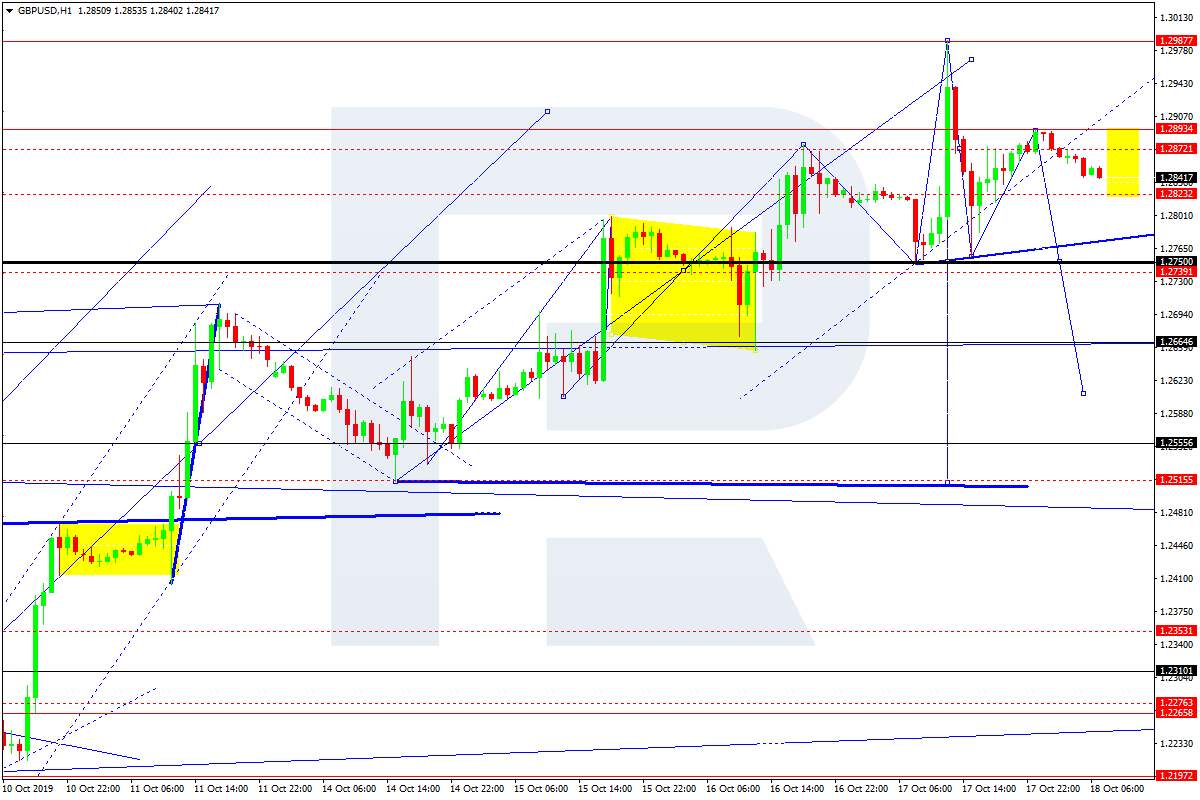
After reaching the target at 1.2980, GBPUSD has completed the descending impulse at 1.2755 along with the correction towards 1.2893; right now, it is moving downwards. Possibly, the pair may break 1.2750 and then continue trading downwards with the target at 1.2555.
USDCHF, “US Dollar vs Swiss Franc”
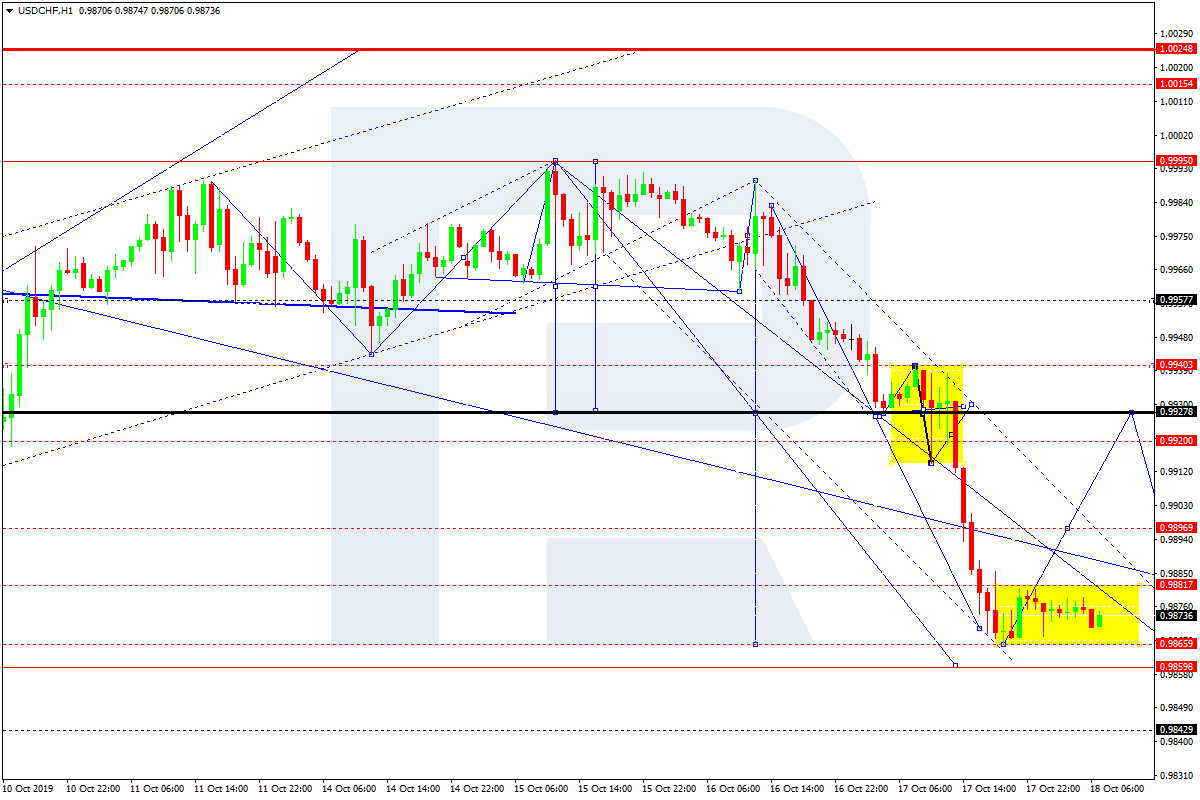
After completing another consolidation range around 0.9927, USDCHF has broken it to the downside and may continue the descending correction towards 0.9860. After that, the instrument may resume trading upwards with the first target at 0.9930.
USDJPY, “US Dollar vs Japanese Yen”
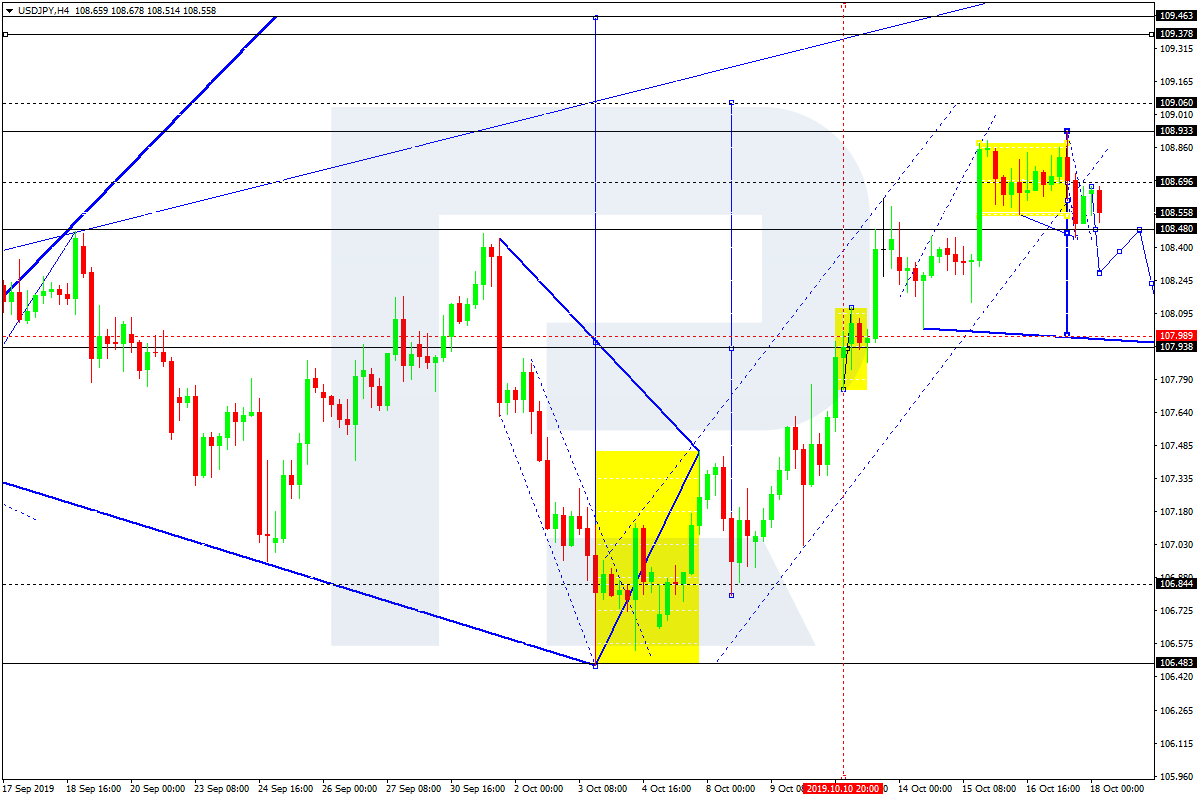
USDJPY continues consolidating around 108.69. If later the price breaks this range to the downside, the instrument may form a new descending structure to reach 108.00; if to the upside – resume trading upwards with the target at 109.06.
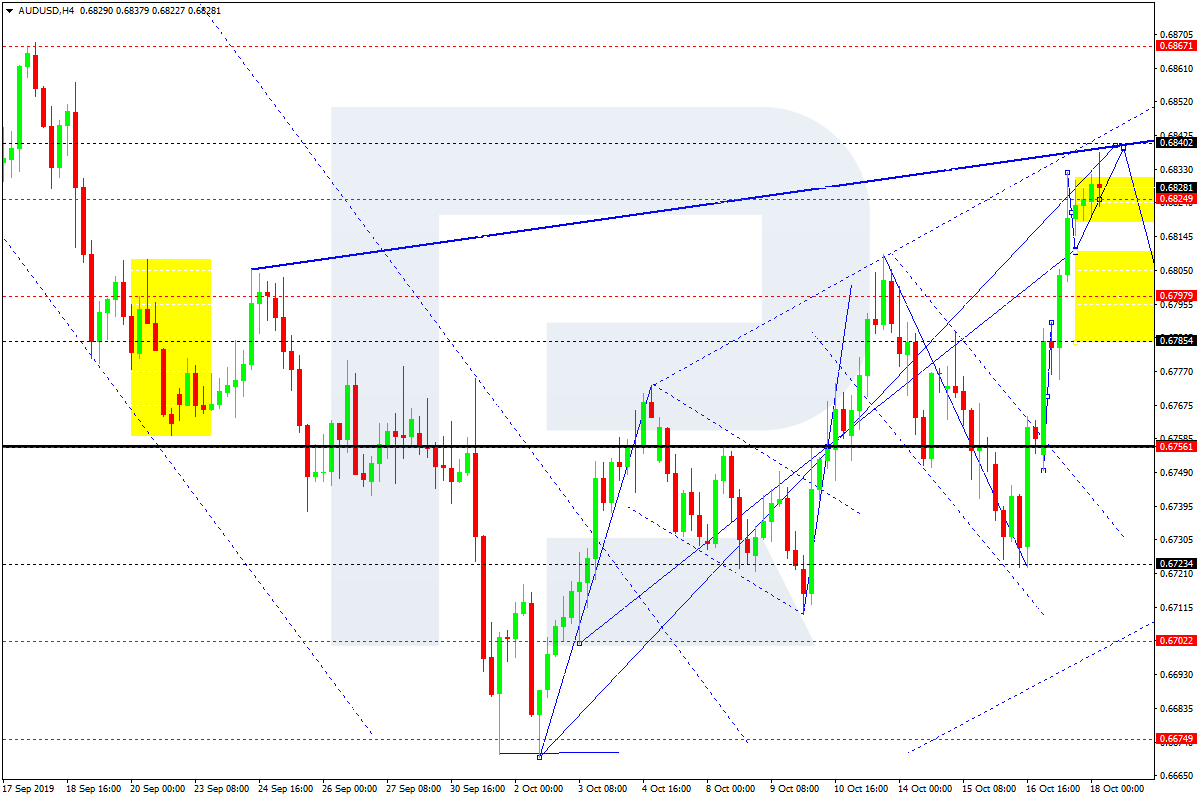
AUDUSD, “Australian Dollar vs US Dollar”
AUDUSD is moving upwards; right now, it is forming the fifth wave with the target at 0.6840. After that, the instrument may consolidate and form a reversal pattern. The first downside target is at 0.6755.
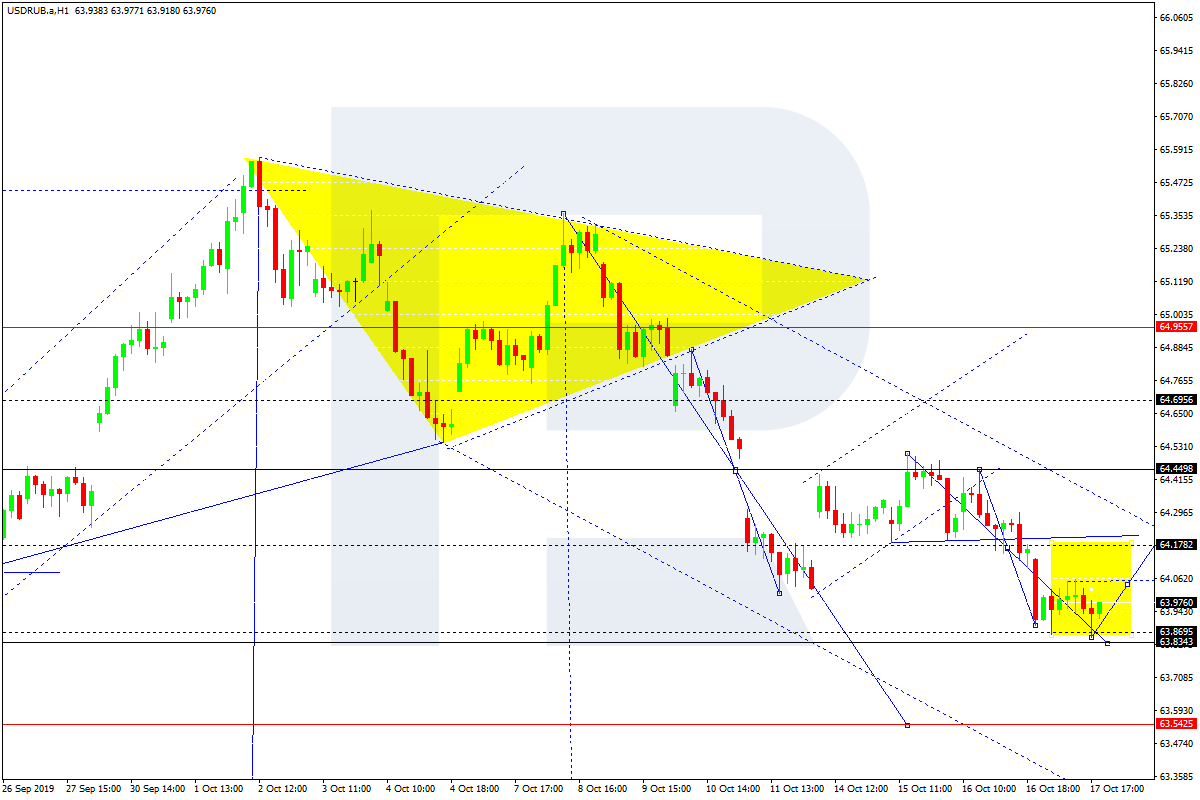
USDRUB, “US Dollar vs Russian Ruble”
USDRUB has reached 63.87; right now, it is consolidating near the lows. Possibly, the pair may grow towards 64.17. Later, the market may continue trading inside the downtrend with the target at 63.54.
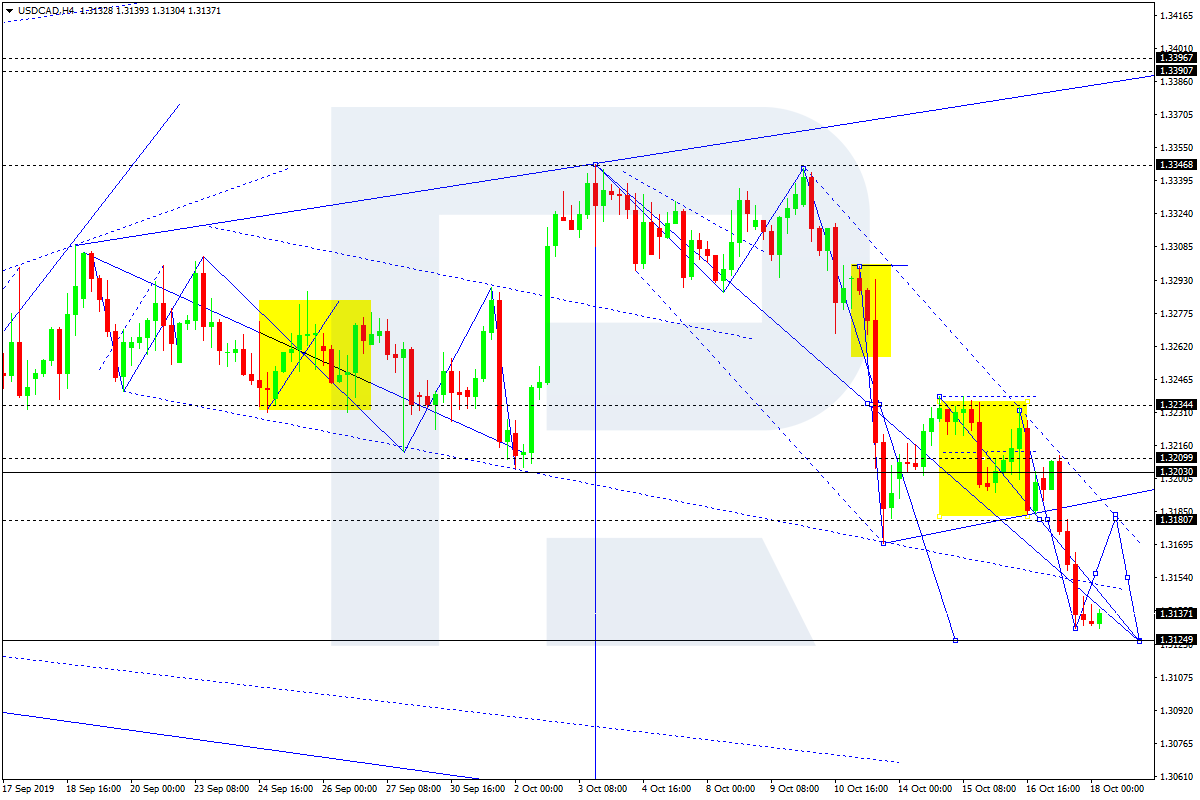
USDCAD, “US Dollar vs Canadian Dollar”
USDCAD continues falling towards 1.3125. Later, the market may consolidate and form a reversal pattern. The pair is expected to form one more ascending structure with the target at 1.3235.
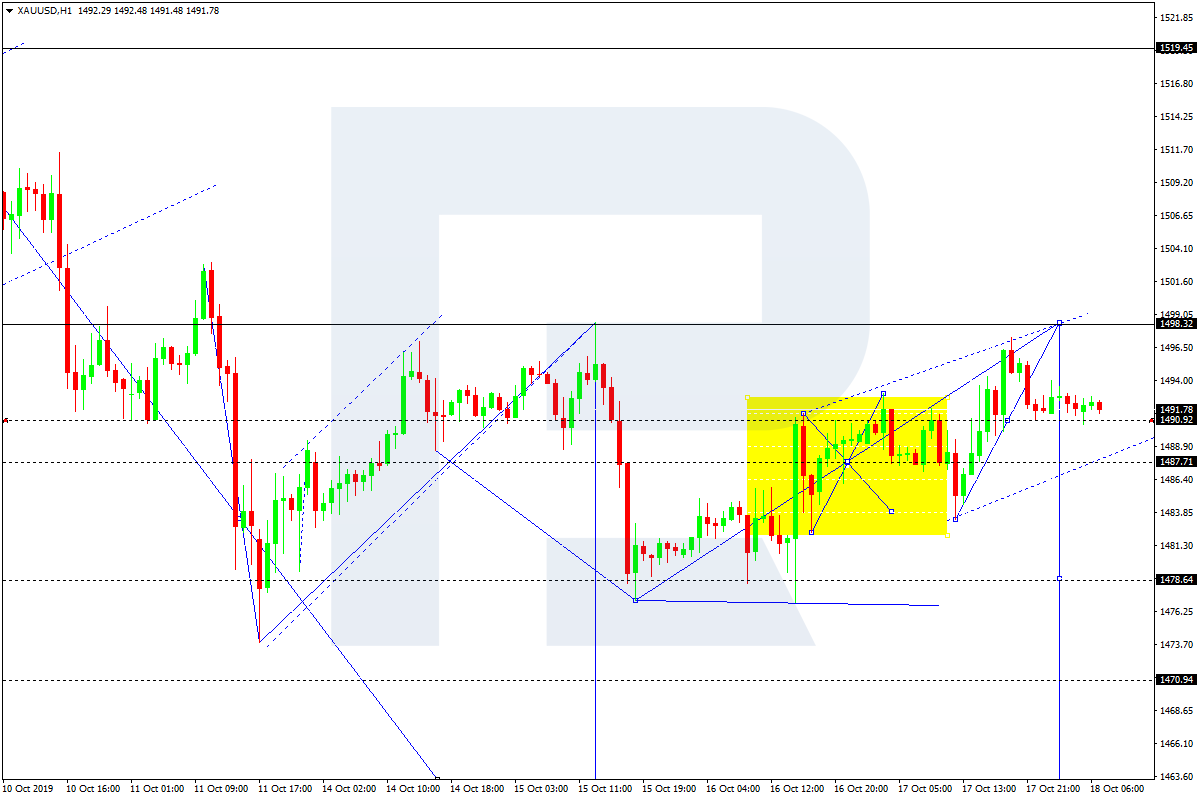
XAUUSD, “Gold vs US Dollar”
Gold is still growing towards 1498.30. After that, the instrument may fall to break 1487.70 and then continue trading inside the downtrend with the predicted target at 1459.33.
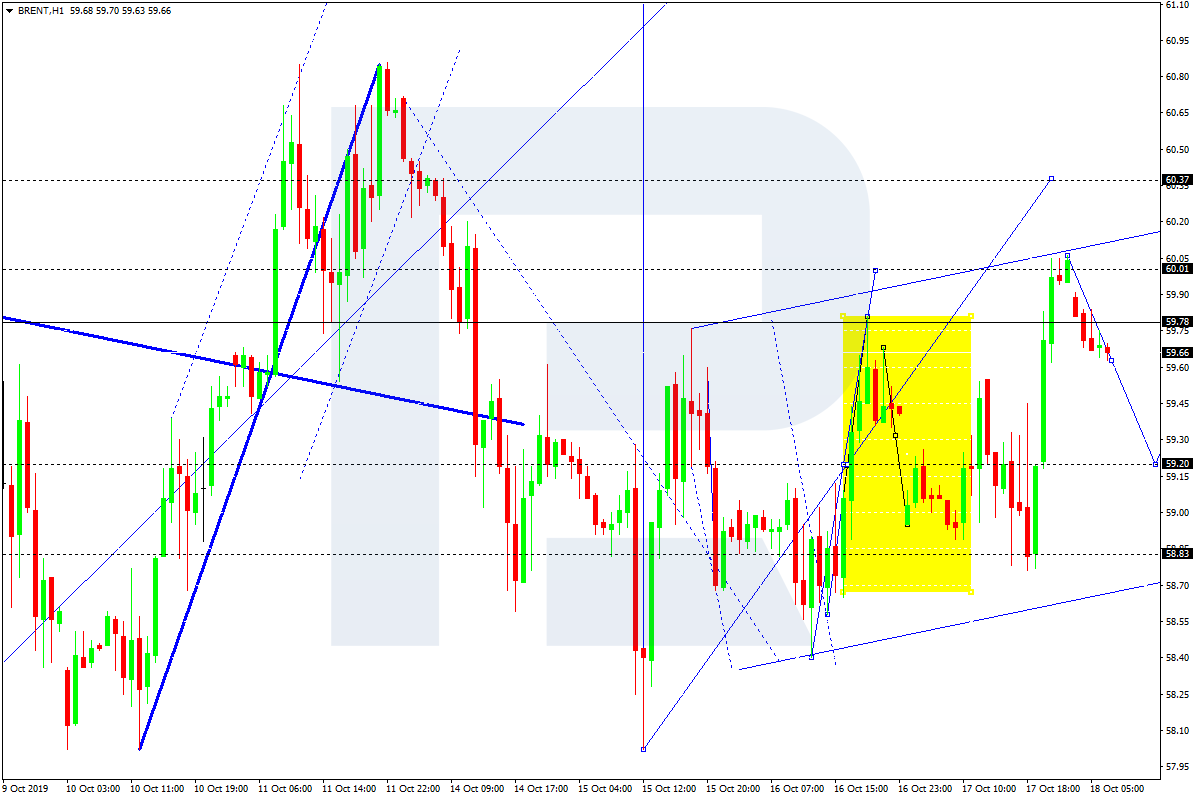
BRENT
НAfter reaching the short-term target at 60.00, Brent is moving downward to reach 59.20. Later, the market may resume trading upwards with the first target at 60.40.
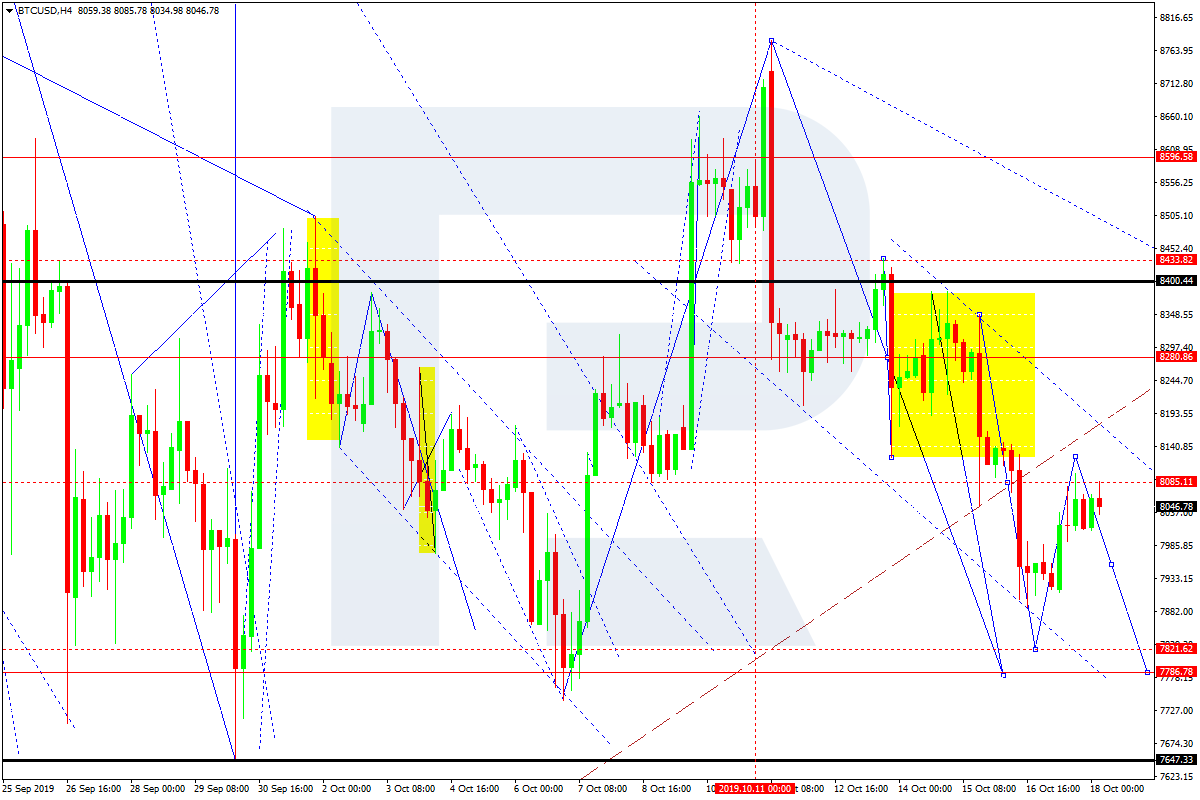
BTCUSD, “Bitcoin vs US Dollar”
BTCUSD has returned to 8085.00. Today, the pair may form a new descending structure to reach 7787.00 and then resume growing towards 8280.00.
Attention! Forecasts presented in this section only reflect the author’s private opinion and should not be considered as guidance for trading. RoboForex LP bears no responsibility for trading results based on trading recommendations described in these analytical reviews.
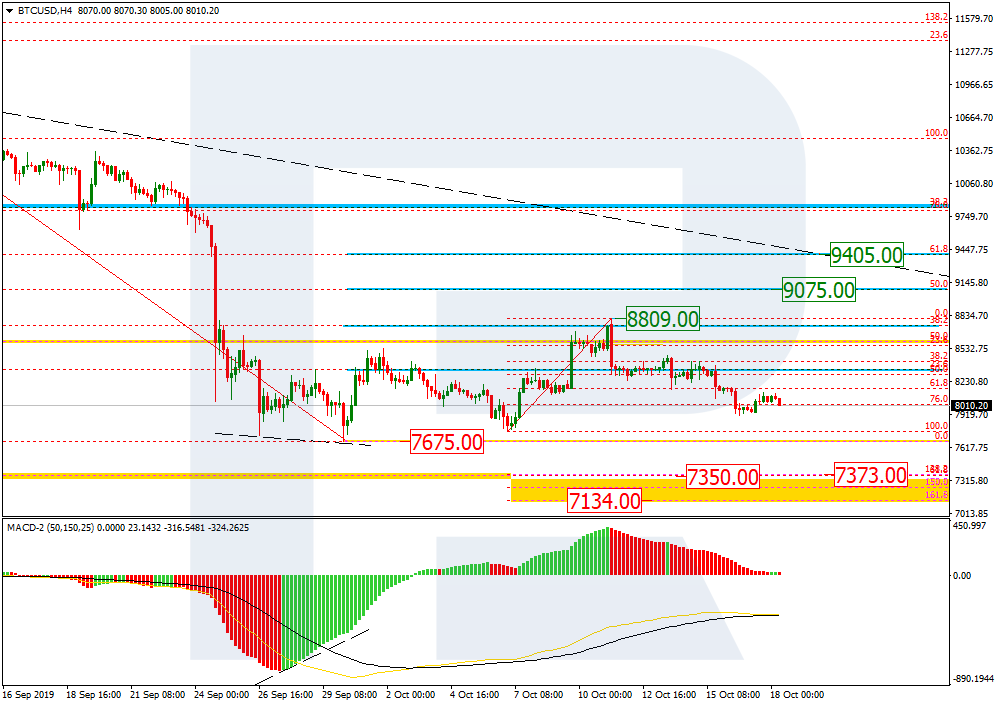
As we can see in the H4 chart, after reaching 38.2% fibo, BTCUSD has started a new decline towards the low at 7675.00. if the price breaks it, the instrument may not only fall to reach mid-term 61.8% fibo at 7350.00, but also enter the post-correctional extension area between 138.2% and 161.8% fibo at 7373.00 and 7134.00 respectively. The resistance is the high at 8809.00.
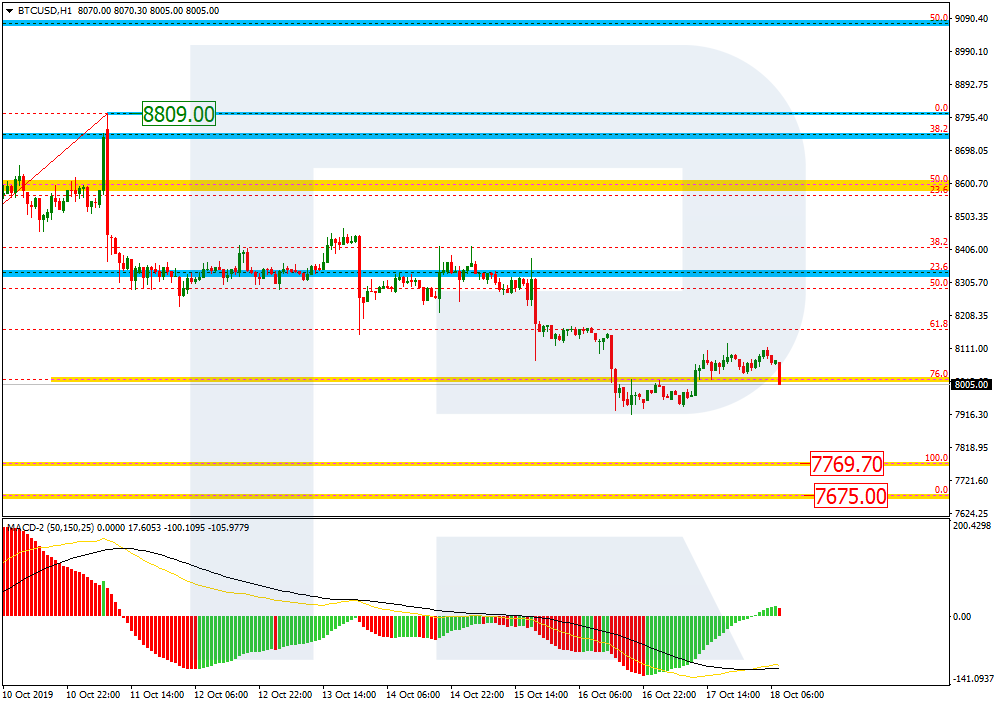
In the H1 chart, the pair is steadily trading downwards to reach the low 7675.00.
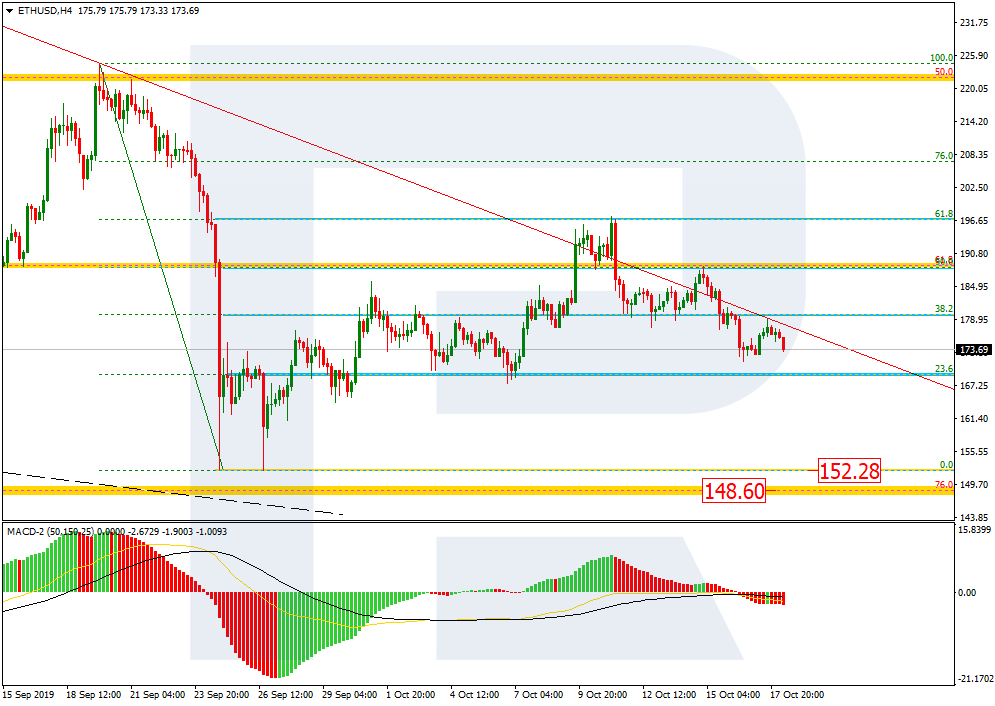
ETHUSD, “Ethereum vs. US Dollar”
As we can see in the H4 chart, the correctional uptrend has reached 61.8% fibo; after testing the resistance, the pair has started a new decline along it. The closest downside target is the local low at 152.28. After breaking it, this decline may be heading towards mid-term 76.0% fibo at 148.60.
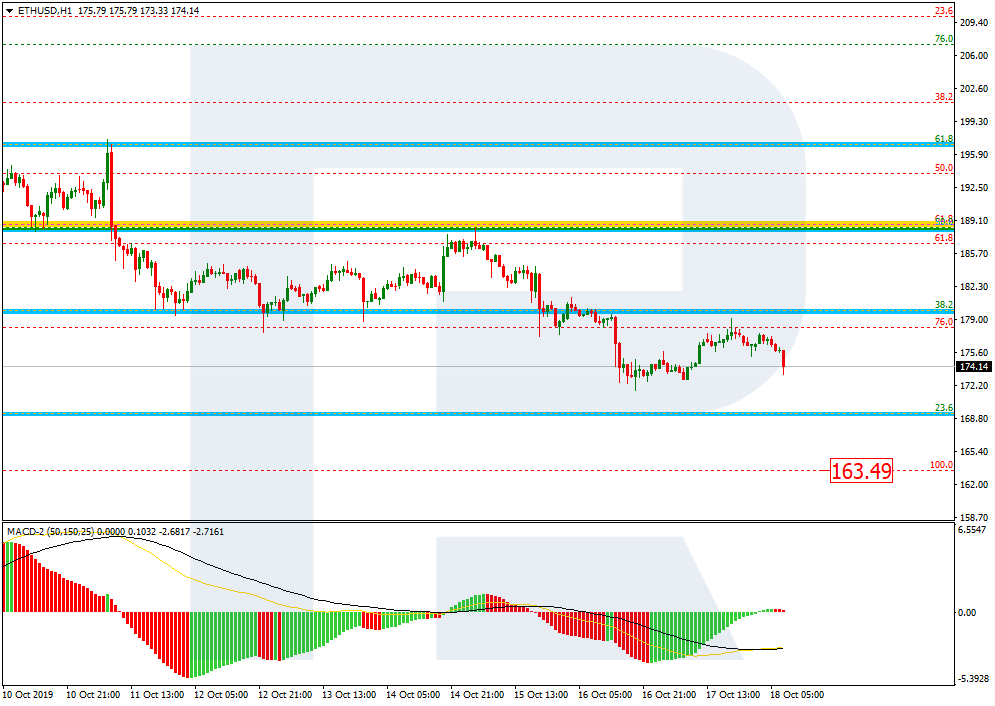
In the H1 chart, the instrument is forming a stable downtrend.
Attention! Forecasts presented in this section only reflect the author’s private opinion and should not be considered as guidance for trading. RoboForex LP bears no responsibility for trading results based on trading recommendations described in these analytical reviews.
On Thursday the 17th of October, trading on the euro closed up. The rally restarted in the European session over reports that EU leaders have approved a Brexit deal. This deal will now be voted on by the European and British parliaments with votes planned for Saturday. There are fears that the deal will get voted down in the UK parliament. These fears caused the pound to erase its daily gains. The euro has bolstered its position thanks to the EURGBP cross.
Day’s news:
11:00 Eurozone: current account (Aug).
13:00 UK: European Council summit on Brexit.
20:00 US: Baker Hughes US oil rig count.
Current situation:
The pair rose to the upper line of the channel just as expected. The increased appetite for risk saw the rate rise to 1.1140. The pair has now been consolidating for 22 hours. The market is now braced for some sharp movements. Brexit and the US-China trade deal remain at the forefront of traders’ minds.
The Democratic Unionist Party and Scottish National Party have both publicly announced their opposition to the deal, so markets are in for some turbulent times through the end of the month.
We reckon that the rise to 1.1140 is not the end of the upwards movement. We expect the pair to rise to 1.1163 followed by a correction to the trend line at 1.1110 as the bulls cash in on their long positions. It’s essential to keep an eye on the news. The future direction of the majors will be determined by the reaction to geopolitical developments rather than by technical analysis. However, analysis can help to identify entry and exit points. Today is Friday, so volatility should remain high until trading closes in Europe.
The single currency continued its growth relative to the greenback. EUR/USD quotes updated two-month highs. The trading tool found resistance at 1.11350. Round level 1.11000 is the immediate support. Today, investors will be focused on the summit of EU leaders. We also recommend that you keep track of up-to-date information regarding the settlement of the trade conflict between the US and China. The EUR/USD currency pair has the potential for further growth. Positions must be opened from key levels.
Pay attention to the speeches of FOMC representatives.
The price fixed above 50 MA and 100 MA, which signals the strength of buyers.
The MACD histogram is in the positive zone, but below the signal line, which gives a weak signal to buy EUR/USD.
The Stochastic Oscillator is in the neutral zone, the %K line is below the %D line, which indicates a bearish sentiment.
Trading recommendations
Support levels: 1.11000, 1.10850, 1.10550
Resistance levels: 1.11350, 1.11500, 1.11800
If the price consolidates above 1.11350, expect further growth toward 1.11600-1.11800.
Alternatively, the quotes could decrease toward 1.10700-1.10500.
The GBP/USD currency pair
Technical indicators of the currency pair:
Prev Open: 1.28255
Open: 1.28907
% chg. over the last day: +0.26
Day’s range: 1.28395 – 1.28909
52 wk range: 1.1959 – 1.3385
The GBP/USD currency pair continues to consolidate. Unidirectional trends are not observed. At the moment, the trading instrument is consolidating in the range 1.27800-1.29000. EU representatives and UK parliamentarians agreed on a deal on Brexit. This compromise avoids the hard Brexit scenario. Investors are waiting for the EU summit, at which lawmakers must approve this agreement. We recommend opening positions from key levels.
The Economic News Feed for 18.10.2019 is calm.
Indicators do not give accurate signals: the price is testing 50 MA.
The MACD histogram has approached the 0 mark.
The Stochastic Oscillator is in the oversold zone, the %K line crossed the %D line. There are no signals at the moment.
Trading recommendations
Support levels: 1.27800, 1.26500, 1.25300
Resistance levels: 1.29000, 1.29800
If the price consolidates above 1.29000, expect further growth toward 1.29800-1.30500.
Alternatively, expect a decrease toward 1.27000-1.26500.
The USD/CAD currency pair
Technical indicators of the currency pair:
Prev Open: 1.31997
Open: 1.31352
% chg. over the last day: -0.50
Day’s range: 1.31314 – 1.31448
52 wk range: 1.2727 – 1.3664
The USD/CAD currency pair again went down. The trading instrument has set new local lows. Looney is currently consolidating in the range 1.31300-1.31600. The technical picture signals a further fall in the USD/CAD quotes. The Canadian dollar is further supported by the positive dynamics of oil quotes. We recommend opening positions from key levels.
The Economic News Feed for 18.10.2019 is calm.
Indicators point to the strength of sellers: the price has fixed below 50 MA and 100 MA.
The MACD histogram is in the negative zone, but above the signal line, which gives a weak signal to sell USD/CAD.
The Stochastic Oscillator is near the overbought zone, the %K line crossed the %D line. There are no signals at the moment.
Trading recommendations
Support levels: 1.31300, 1.31000
Resistance levels: 1.31600, 1.31850, 1.32100
If the price consolidates below 1.31300, expect a further drop toward 1.31000-1.30800.
Alternatively, expect the quotes to grow toward 1.31900-1.32100.
The USD/JPY currency pair
Technical indicators of the currency pair:
Prev Open: 108.751
Open: 108.648
% chg. over the last day: -0.17
Day’s range: 108.516 – 108.685
52 wk range: 104.97 – 114.56
The USD/JPY currency pair continues to trade flat. Unidirectional trends are not observed. At the moment, the following key support and resistance levels can be identified: 108.450 and 108.900, respectively. In the near future, the technical correction of the USD/JPY quotes is not ruled out. Market participants expect up-to-date information regarding trade negotiations between Washington and Beijing. Positions must be opened from key levels.
The Economic News Feed for 18.10.2019 is calm.
Indicators do not give accurate signals: the price crossed 50 MA and 100 MA.
The MACD histogram has moved into the negative zone, which indicates the strength of sellers.
The Stochastic Oscillator is in the neutral zone, the %K line crossed the %D line. There are no signals at the moment.
Trading recommendations
Support levels: 108.450, 108.100, 107.850
Resistance levels: 108.900, 109.300, 109.600
If the price consolidates above 108.900, expect further growth toward 109.300-109.500.
Alternatively, expect them quotes to decrease toward 108.100-107.800.
Recent rotation in multiple foreign currencies hints at the fact that a new stage of the “Capital Shift” process is taking place and that skilled technical investors need to pay very close attention to how these currencies continue to react over the next 3 to 6+ months. In the recent past, most of the world’s foreign currencies were declining in value while the US Dollar continued to strengthen. In fact, we authored many research articles about these trends and how weakness in foreign currencies will drive new foreign investment into the US stock markets for two simple reasons; strength and security.
Now that a few of the world’s most mature economies, and some that may surprise you, are starting to change directions, we may be beginning a new stage of the “capital shift” process that may open up multiple new opportunities for skilled technical traders. As the old saying goes, “follow the money”. At this point, if our research team is correct about these price trend changes, following the money may mean opening our eyes to new investment opportunities across the Pacific and Atlantic – as well as very near to the US.
The first thing we want to highlight is our belief that the US Dollar and US stock market should continue to provide price strength and upward price opportunity – even throughout any price correction or contraction that our researchers may identify. Our predictive modeling systems have shown us what we believe to be an incredibly accurate prediction of future price activity over the next 3 to 5+ years.
Even though we are not going to share that research with you today, the one thing we want all of our followers to understand is that the US stock market, and likely the US Dollar, are poised to continue to see longer-term upward price growth over the next 3+ years. Yes, there may be a few price rotations/declines throughout this process and we need to be aware that price naturally attempts these types of rotations in an effort to provide future price support, price exploration and future price trends. The price must always attempt to establish new highs or lows throughout a trending process.
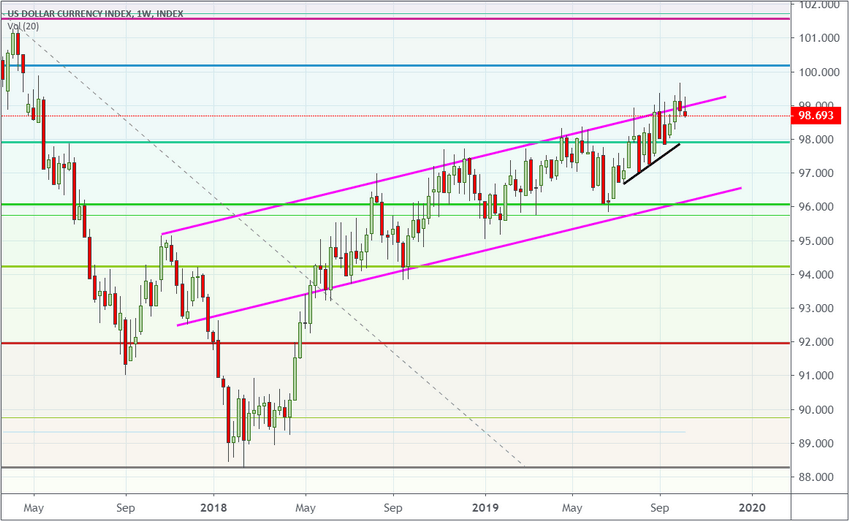
US DOLLAR
The US Dollar has been trending higher since early 2018. We believe the US Dollar will continue to push higher within the price channels we’ve drawn on this chart and, eventually, attempt to move to levels above 100 near the end of 2020 (or slightly after this date). We don’t believe anything will disrupt the continued strength of the US Dollar unless some major economic/credit crisis completely destroys the support of the global economic markets and takes everything down with it.
Our researchers believe the new shift in the “capital shift” process of global investing is centered around the concept that certain global currencies, as well as their associated stock markets and strategic stock sectors, may have reached a point where price is exceedingly below fair value and when one considers the fundamental economic strengths related to maturity, economic capabilities, geopolitical or proximity economic factors and future leadership/opportunity factors – investors are suddenly viewing these currencies and stock markets as “uniquely positioned for potential upside growth”. Thus, this change in perspective could drive a new upside price trend throughout a number of undervalued currencies as well as present a very real possibility that skilled technical traders may find real value and real opportunity by expanding their search criteria into assets related to these currencies.
One of the most basic elements of investing is understanding how supply-demand economic functions work and where the current “equilibrium” is at. The easiest way for us to try to explain this concept is to think of a very sought-after product (let us assume one ounce of gold) and the price of that gold as a measure of the price level in relation to demand. When the price of gold is very low, buyers rush into the market to buy up as much as they can afford because the perception is that gold prices should be higher (thus gold is undervalued). This means the equilibrium level is higher than the current price level of gold. When the price of gold is very high, buyers stay away from purchasing (or can’t purchase because it is too high) and the price will eventually begin to fall lower because demand is very low. This means the equilibrium level is lower than the current high price of gold.
Price always moves from above or below the equilibrium level to price levels on the opposite side of the equilibrium level. Think of the equilibrium level as the optimal price level where demand meets supply and where future expectations of price are minimized. This equilibrium level is where the price would be if we removed all the hype, fear, greed and speculation out of the market. The equilibrium level fluctuates as true fundamentals and true price exploration takes place across the supply-demand curve. Almost like the average temperature fluctuates throughout the seasons of the year.
When a shift in investor sentiment happens, much like a shift in seasons, price changes direction begins to rally of decline and this shift in trend changes the supply-demand equilibrium level as investors pile into or pull out of a market. Thus, if our researchers are correct and this change in the longer-term opportunity for selected currencies is a true longer-term capital shift, it may be a very early opportunity for investors to begin focusing on the opportunities that will become present in the near future.
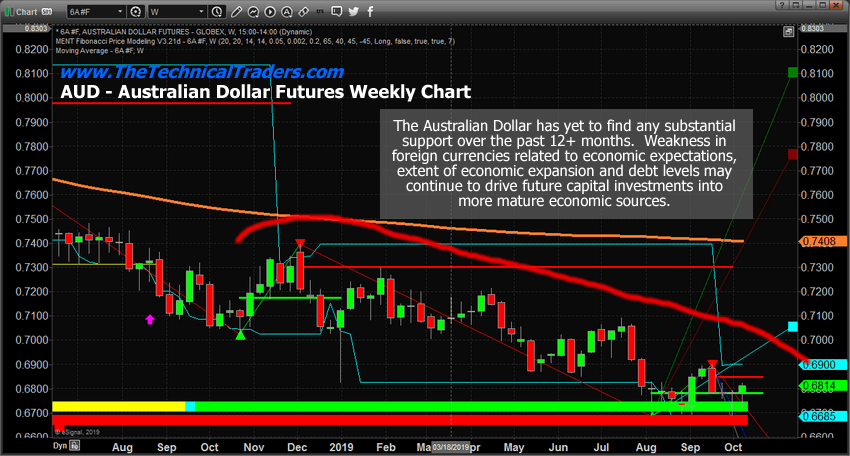
Australian Dollar
The first currency we want to focus on is the Australian Dollar. Historically, the Australian Dollar has continued to trend lower over the past 18+ months and currently shows very little strength or opportunity to form a bottom. The lows near 0.67 may prove to become a future bottom in price, but the trend has not confirmed this yet and because of that, we believe weakness is still prevalent in price.
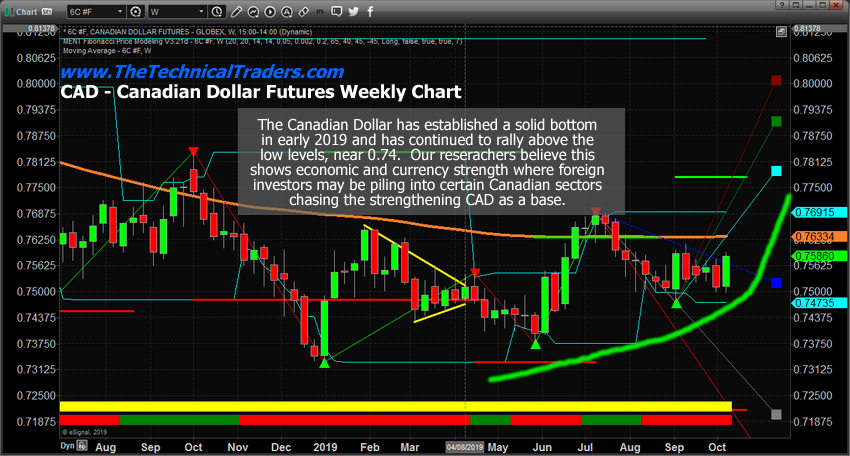
Canadian Dollar
The Canadian Dollar, on the other hand, has set up an intermediate price bottom in early 2019 and has continued to strengthen moderately over the past 10+ months. One thing that we want to point out about our research is that we believe currencies and nations that have strong economic ties and proximity advantages (being close to the US and having strong economic ties with the US) are very likely to perform well or begin to strengthen in the near future. Canada has a number of factors that may prove to be advantageous going forward. Strong economic ties with the US, a booming cannabis and resource market, strong agriculture exports and a very mature economy compared to other nations.
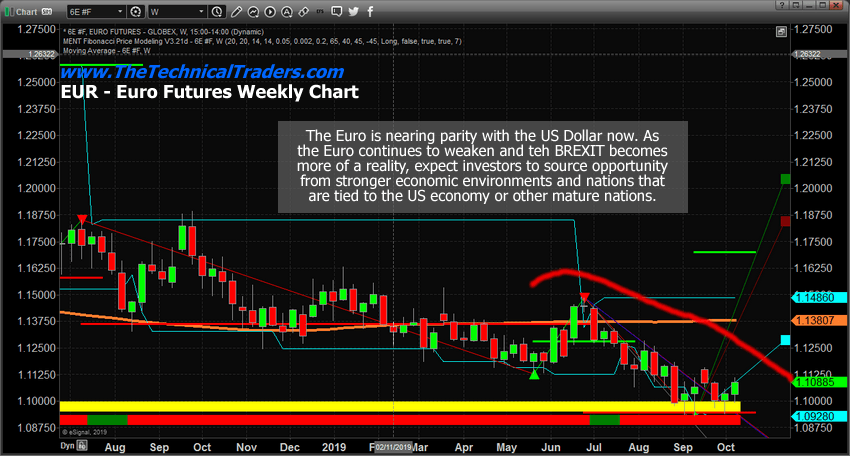
Euro
The Euro price chart continues to illustrate price weakness as future expectations of economic strength is very far off. The interesting facet related to the Euro is that a weakening Euro will eventually present a very clear opportunity for investors the instant the European-union enters any type of economic recovery or strength. Until that happens, we believe the continued price weakness will potentially drive the Euro lower – eventually attempting true parity with the US Dollar.
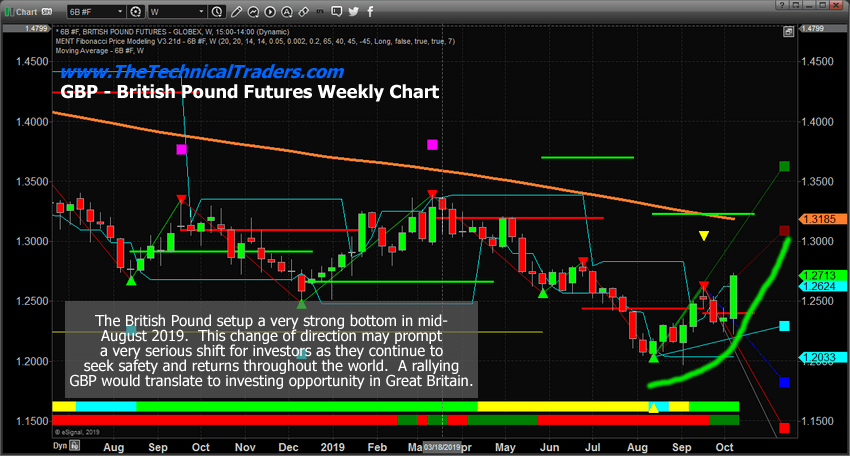
British Pound
The British Pound has recently rebounded to the upside with some level of ferocity. Of course, this 6+ week upside price rally does not make a new longer-term price trend yet – but we believe this upside price move may be related to the future BREXIT deal and renewed economic ties/trade with the US. In other words, investors may be shifting expectations and price levels into acceptance that the British Pound may become a very solid future investment assuming the BREXIT deal creates a renewed economic cooperation between Great Britain and the US.
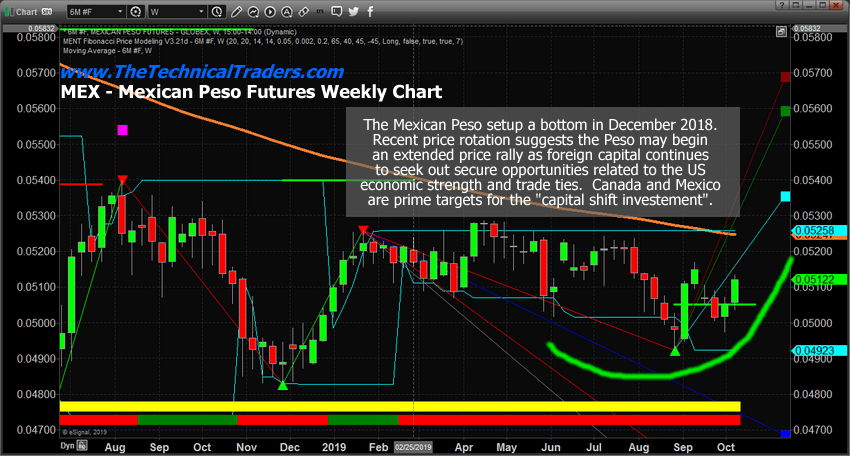
Mexican Peso
Lastly, the Mexican Peso has recently started to base near 0.049 and may possibly attempt to move above longer-term resistance near 0.053 on renewed expectations of a stronger economy, stronger economic ties with the US and a post-US 2020 Presidential election rally. Currently, the bottom in the Peso occurred in 2017 near 0.04785. We believe the Peso could rally above 0.061 over the next 18+ months – resulting in an 18%+ upside price rally related to stronger US economic growth and stronger economic ties between the US and Mexico.
Concluding Thoughts:
These changed in direction in the Mexican Peso, Canadian Dollar and British Pound suggest that global investors may begin shifting capital into the strongest sectors and/or the value sectors of these countries attempting to capture a late 2020 price rally that may carry forward into the 2021 and beyond economic recovery that we expect to take place after the 2020 US Presidential elections.
Please keep in mind that quite a bit hinges of the outcome of the US Presidential elections in 2020. Just like we saw on election night in November 2016, global investors and global corporate leaders will react to any fear or opportunity related to who is expected to win the US elections in 2020. More taxes, more regulation, more uncertainty will immediately derail any attempted economic recovery that sets up over the next 10+ months. We need to watch how these currencies strengthen before the election, then become very cautious 2 to 3 weeks before the election takes place in 2020.
I urge you visit my ETF Wealth Building Newsletter and if you like what I offer, join me with the 1-year subscription to lock in the lowest rate possible and ride my coattails as I navigate these financial market and build wealth while others lose nearly everything they own during the next financial crisis. Join Now and Get a Free 1oz Silver Bar!
As a technical analysis and trader since 1997, I have been through a few bull/bear market cycles. I believe I have a good pulse on the market and timing key turning points for both short-term swing trading and long-term investment capital. The opportunities are massive/life-changing if handled properly.
NOTICE: Our free research does not constitute a trade recommendation or solicitation for our readers to take any action regarding this research. It is provided for educational purposes only. Our research team produces these research articles to share information with our followers/readers in an effort to try to keep you well informed. Visit our web site (www.thetechnicaltraders.com) to learn how to take advantage of our members-only research and trading signals.
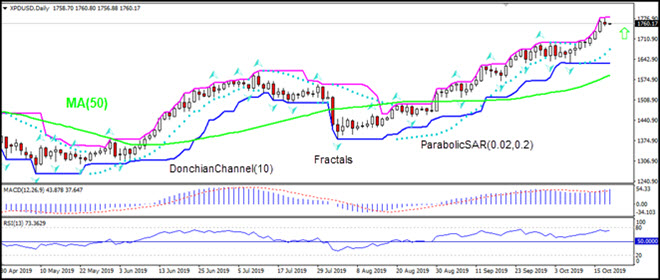
EU car sales grew strongly in September. Will the XPDUSD continue gaining?
Palladium is one of three precious metals together with platinum and rhodium used in catalytic converters for car exhausts. And more than 80 percent of the world’s palladium is used in the catalytic converters that help vehicles reduce their pollutant output. Sales of new passenger cars in the European Union rose sharply in September compared to a year earlier – the car industry association in European Union, ACEA, reported on Wednesday care sales increased by 14.5% to nearly 1.25 million cars in EU. Double-digit growth was recorded in four of the five major car markets. Increasing demand for catalytic converters is bullish for XPDUSD.
On the daily timeframe the XPDUSD: D1 is rising above the 50-day moving average MA(50).
The Parabolic indicator gives a buy signal.
The Donchian channel indicates uptrend: it is widening up.
The MACD indicator gives a bullish signal: it is above the signal line and the gap is widening.
The RSI oscillator is near the overbought zone but has not crossed into it.
We believe the bullish momentum will continue after the price breaches above the upper boundary of Donchian channel at 1781.87. This level can be used as an entry point for placing a pending order to buy. The stop loss can be placed below the lower Donchian boundary at 103.86. After placing the order, the stop loss is to be moved every day to the next fractal low, following Parabolic signals. Thus, we are changing the expected profit/loss ratio to the breakeven point. If the price meets the stop loss level (1628.79) without reaching the order (1781.87), we recommend cancelling the order: the market has undergone internal changes which were not taken into account.
The dollar index fell for the third consecutive day, with price falling to a two-month low.
The declines come amid a weak patch of economic reports. The US-China trade talks also did not offer any fresh news for investors.
As a result, the dollar took a backseat. This led to most of its peers posting some modest gains.
Euro Maintains Gains as US Data Disappoints
Economic data from the United States on Thursday saw a string of weak reports. As a result, the euro maintained its gains. The weekly jobless claims came in at 214,000 in line with the estimates.
Housing starts rose 1.26 million coming below estimates. Industrial production was down, falling 0.4%. This was more than the estimates of a 0.2% decline.
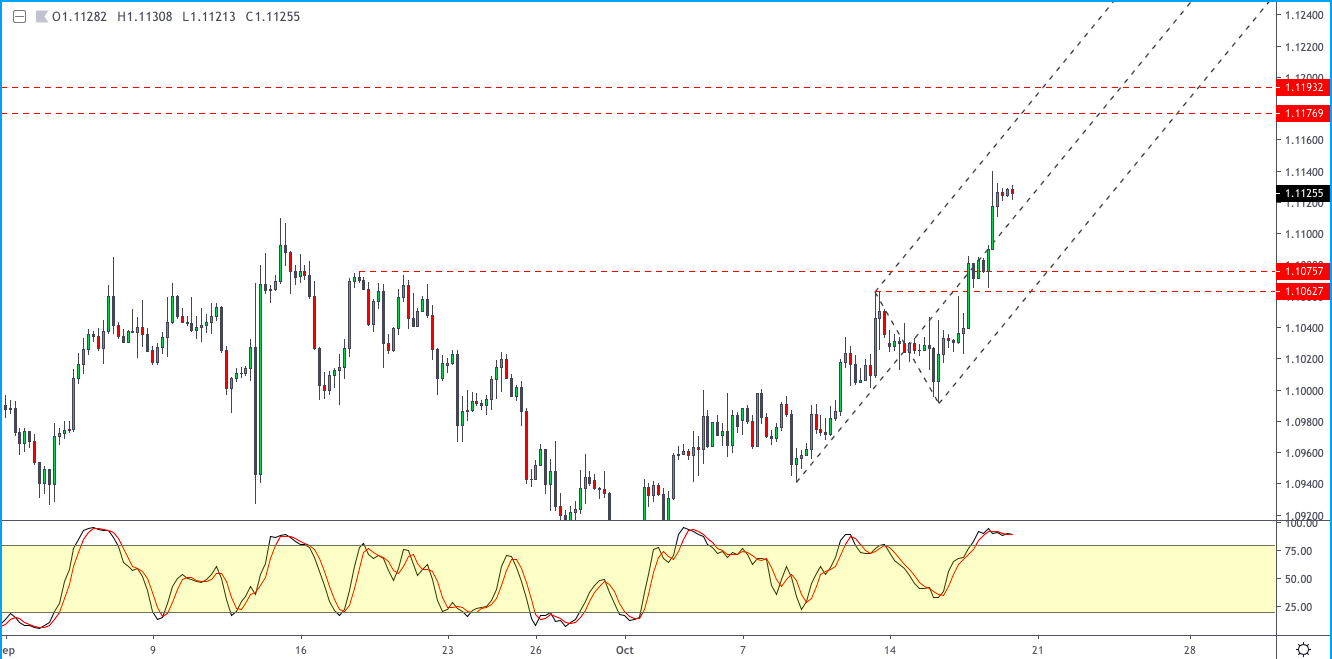
Will the EURUSD Maintain the Uptrend?
The currency pair is in a short-term uptrend. This was confirmed after price breached the resistance area of 1.1075–1.1062. The current gains could see price action aiming for the upper resistance area of 1.1193–1.1176. In the near term though, price action could see a correction back to 1.1075–1.1062.
A retest of this level to establish support will confirm the upside. Alternatively, the bullish momentum could see price rising straight for the resistance level.
UK Brexit Deal Hits a Snag
The pound sterling rallied to a five-week high on initial reports that the EU and the UK reached an agreement regarding Brexit. The news comes just a week before the UK is set to leave the EU and months of deliberation.
But later in the day, the deal was rejected by the UK’s key ally, the Democratic Unionist Party (DUP). The negotiations now remain fluid. This could potentially see some higher volatility in the GBP.
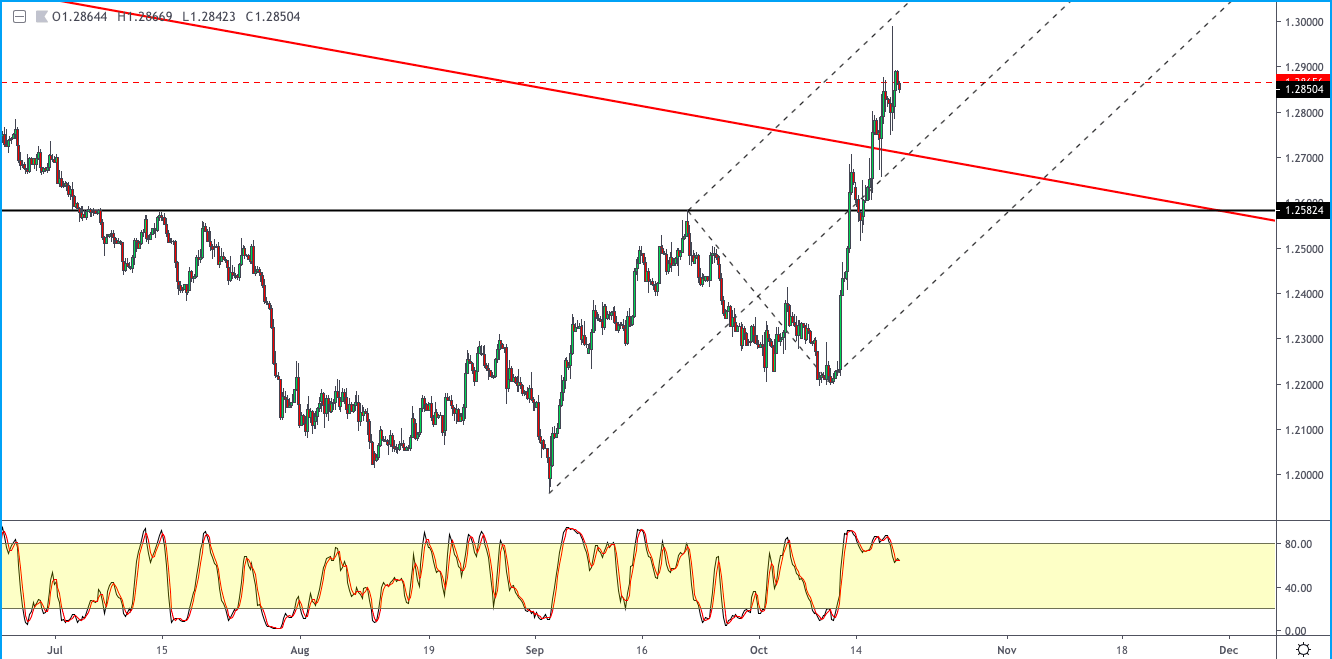
GBPUSD Likely to Post a Correction
The currency pair has been in a steady uptrend. But on Thursday, price action retreated after spiking to a daily high of 1.2989. This comes as price action hit a major resistance level.
The pullback also coincides with the hidden bearish divergence on the daily chart time frame. In the near term, GBPUSD could see pulling back below the resistance area. The lower support at 1.2582 remains due for another possible test of support.
US Crude Oil Inventories Rise More than Expected
The weekly crude oil inventories report saw another week of buildup in oil inventories. For the week ending October 11th, oil inventories were up 9.3 million.
The EIA also said that oil inventories were almost two percent above the five-year average. Gasoline inventories were, however, down by 2.6 million barrels for the same period. It follows a 1.2 million barrels decline from the week before.
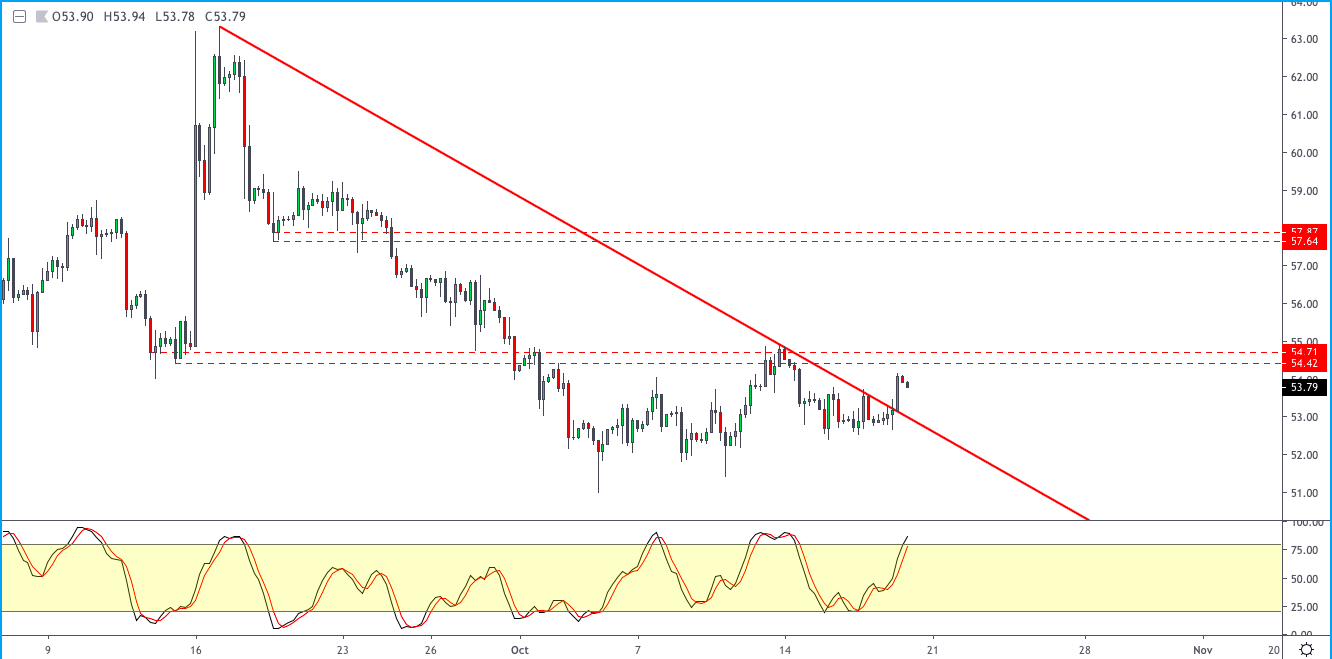
Oil Price Bucks the Trend
Crude oil prices managed to post some modest gains despite the bearish fundamentals. Price action remains on track to test the resistance area of the 54.70 – 54.42 region. This comes as oil breaks the falling trend line.
A close above the resistance area is needed to confirm further upside gains. The next main resistance level is at the 57.87 – 57.64 region. To the downside, declines should stall near the trend line that acts as a dynamic support.
Recently I met an incredible trader and x-Bloomberg television anchor. His name is Adam Johnson and if you have not listened to his podcasts or followed his stock trading portfolio be sure to visit his website BullsEyeBrief.com
Adam reached out to me a few weeks ago wanting to have me on his podcast show to talk markets because he focuses on individual stocks and their fundamentals, while I am a pure chartist that dissects price charts layer by later to find out what they are telling us will happen next.
Listen to this fantastic show Adam put together!
If you would like to receive my daily market analysis and forecasts along with my ETF trade alerts subscribe here.
As we enter the weekly close, we want to take a look at the USD/JPY, especially with several Fed officials speaking today.
Over the last few days, we saw the latest Brexit developments and a truce in the trade conflict between the US and China result in an obvious risk-on market environment, pushing the USD/JPY into the region around 109.00 and given the recent price action further gains seem to have a higher likelihood than a sharper drop.
Still, even if we get to see a short-term push above 109.00, we don’t necessarily consider such a push to be sustainable. Because after the Fed restarted their asset purchases to prevent a cash crunch in money markets and planning to buy US Treasuries for the next 8.5 months at a pace of 60 billion USD per month, any hints from Fed officials in today’s speeches that the Fed is to consider extending that program if no improvement in regards to the “liquidity issue” is seen, the US dollar could see a new wave of selling.
That said, if we fail to sustainably recapture 109.00, another attempt to break back below 106.80/107.00 stays a serious possibility, even though the USD/JPY stays technically neutral on a daily time-frame between 106.80/107.00 and 108.50/109.00:
Source: Admiral Markets MT5 with MT5-SE Add-on USD/JPY Daily chart (between August 31, 2018, to October 17, 2019). Accessed: October 17, 2019, at 10:00pm GMT – Please note: Past performance is not a reliable indicator of future results, or future performance.
In 2014, the value of the USD/JPY increased by 13.7%, in 2015, it increased by 0.5%, in 2016, it fell by 2.8%, in 2017, it fell by 3.6%, in 2018, it fell by 2.7%, meaning that after five years, it was up by 4.1%.
Discover the world’s #1 multi-asset platform
Admiral Markets offers professional traders the ability to trade with a custom, upgraded version of MetaTrader 5, allowing you to experience trading at a significantly higher, more rewarding level. Experience benefits such as the addition of the Market Heat Map, so you can compare various currency pairs to see which ones might be lucrative investments, access real-time trading data, and so much more. Click the banner below to start your FREE download of MT5 Supreme Edition!
Disclaimer: The given data provides additional information regarding all analysis, estimates, prognosis, forecasts or other similar assessments or information (hereinafter “Analysis”) published on the website of Admiral Markets. Before making any investment decisions please pay close attention to the following:
This is a marketing communication. The analysis is published for informative purposes only and are in no way to be construed as investment advice or recommendation. It has not been prepared in accordance with legal requirements designed to promote the independence of investment research, and that it is not subject to any prohibition on dealing ahead of the dissemination of investment research.
Any investment decision is made by each client alone whereas Admiral Markets shall not be responsible for any loss or damage arising from any such decision, whether or not based on the Analysis.
Each of the Analysis is prepared by an independent analyst (Jens Klatt, Professional Trader and Analyst, hereinafter “Author”) based on the Author’s personal estimations.
To ensure that the interests of the clients would be protected and objectivity of the Analysis would not be damaged Admiral Markets has established relevant internal procedures for prevention and management of conflicts of interest.
Whilst every reasonable effort is taken to ensure that all sources of the Analysis are reliable and that all information is presented, as much as possible, in an understandable, timely, precise and complete manner, Admiral Markets does not guarantee the accuracy or completeness of any information contained within the Analysis. The presented figures refer that refer to any past performance is not a reliable indicator of future results.
The contents of the Analysis should not be construed as an express or implied promise, guarantee or implication by Admiral Markets that the client shall profit from the strategies therein or that losses in connection therewith may or shall be limited.
Any kind of previous or modeled performance of financial instruments indicated within the Publication should not be construed as an express or implied promise, guarantee or implication by Admiral Markets for any future performance. The value of the financial instrument may both increase and decrease and the preservation of the asset value is not guaranteed.
The projections included in the Analysis may be subject to additional fees, taxes or other charges, depending on the subject of the Publication. The price list applicable to the services provided by Admiral Markets is publicly available from the website of Admiral Markets.
Leveraged products (including contracts for difference) are speculative in nature and may result in losses or profit. Before you start trading, you should make sure that you understand all the risks.
The third quarter of 2019 was marked by key monetary policy decisions. The ECB and the Federal Reserve stood out, among a few other central banks. There is speculation about the fact that the monetary policy is shifting to dovish.
While some central banks, such as the Fed, remain optimistic, others have clearly shifted the bias. The European Central Bank restarted its quantitative easing program during the period. This comes just after ending QE in December 2018.
The Federal Reserve delivered two rate cuts at the July and September meetings, lowering interest rates by a combined 50 basis point. The US yield curve once again inverted, something historically viewed as a predictor of a recession.
Given the long expansion stretch since the 2008 global financial crisis, it is not surprising that economists expect growth to slow. The prospects of a recession continue to remain high in the coming years.
US Growth Slows, Eurozone Inflation Remains Tame
The US economy grew at a slower pace of 2.0%, underlining concerns among economists. However, the US unemployment rate was steady at a 50-year low. Although wage growth was somewhat slower over the period.
Meanwhile, in the eurozone, inflation was stubbornly sluggish at 1.0%. Amid slowing growth in Germany, it was appropriate to see the ECB’s new easing measures.
Besides monetary policy, global themes were also a prevailing factor. Mainly, it was the US-China trade talks and Brexit that were partly responsible for volatility in the FX markets.
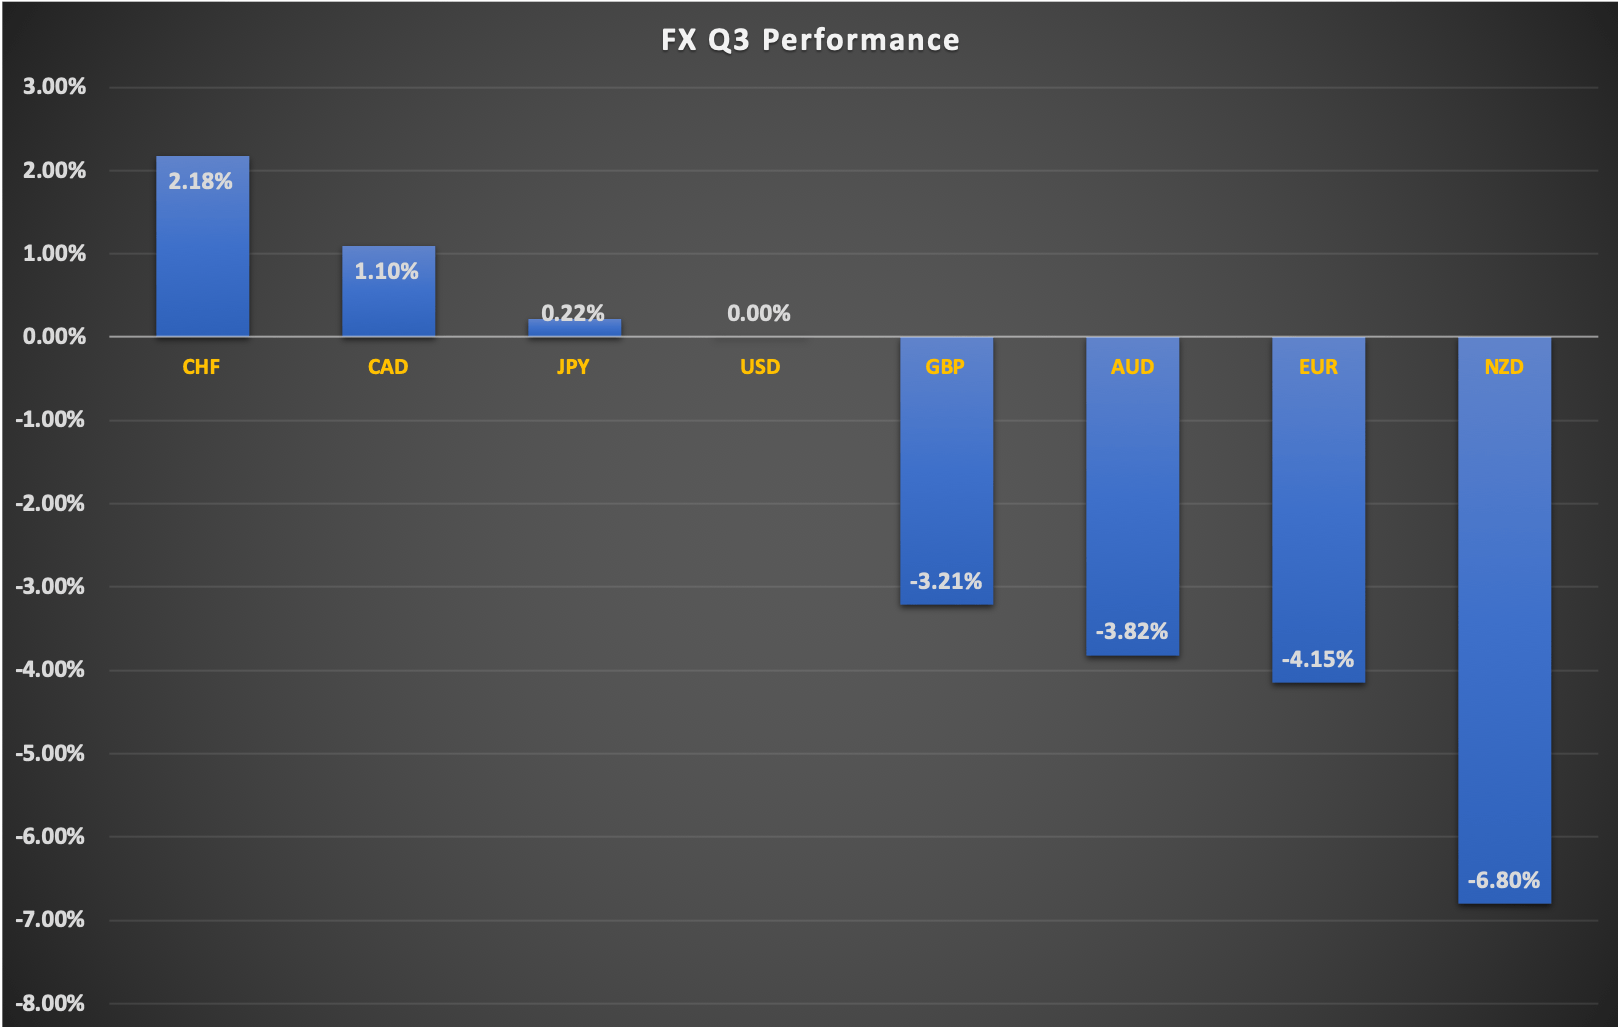
FX Markets – Q3 2019 Performance
FX Performance, Q3 2019 (Relative to USD)
The third quarter of 2019 saw the Swiss franc emerging as the top-performing currency, gaining 2.18% on the quarter. With the Japanese yen rising a modest 0.22%, the safe-haven currencies rose, suggesting the risk-on mood.
The gains came mostly due to deteriorating trade developments with China and the United States. The Washington administration imposed fresh tariffs on China in September on goods valued at $110 billion.
This soured the mood for investors, leading to a rise in safe-haven assets.
On the currency front, the Kiwi was, of course, the worst-performing currency. The NZD was down over 6.80% on the quarter. The declines came as the RBNZ steadily cut interest rates. Between the July–September period, the RBNZ cut rates by 50 basis points in August.
This was a surprise for the markets. The weak fundamentals for New Zealand were aptly represented by the declines in the currency.
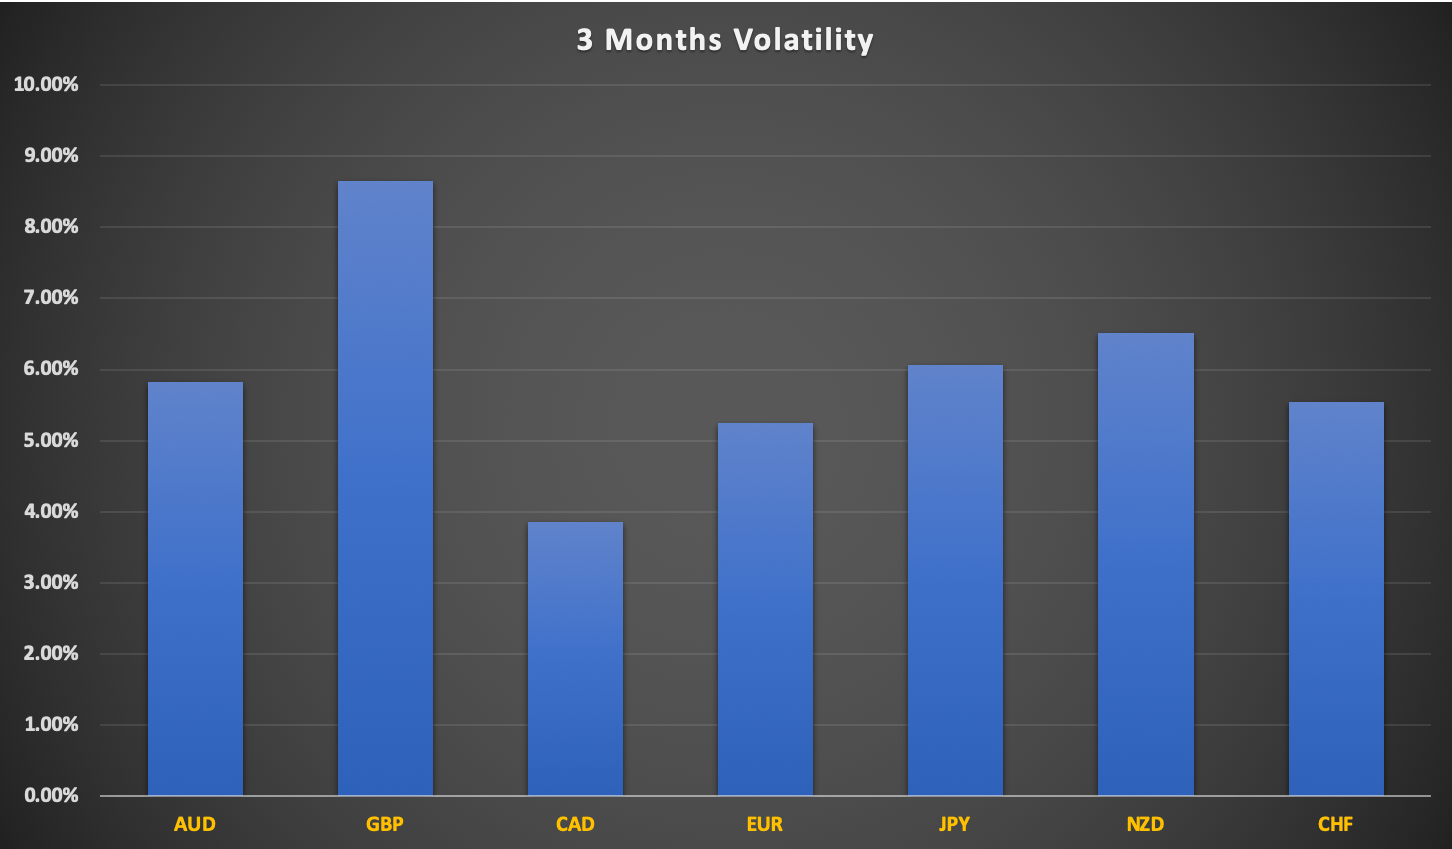
FX Q3 Volatility
But in terms of volatility, it was the pound sterling that was the most volatile. The three-month volatility as shown in the chart below shows the sterling’s volatility at 8.66%.
FX Volatility, Q3 2019
The volatility was as expected. Most of the moves in the sterling were Brexit related. The third quarter saw the UK’s leadership change. Boris Johnson took on the top job following the resignation of Theresa May.
Johnson’s hard-line stance on leaving the EU without a Brexit deal saw a lot of market activity. In a bid to achieve his goal, Johnson also dismissed the UK parliament. A move that was later overruled by the Supreme Court.
The third quarter saw the pound sterling reacting to developing news and the prospects of a no-deal Brexit increased quite a bit.
Overall, the third quarter of this year was marked with uncertainty and a dovish monetary policy. The upcoming quarter is likely to be more interesting.
Brexit developments are showing signs of positive movement. Meanwhile, the US-China trade talks are also hopeful at the current state.