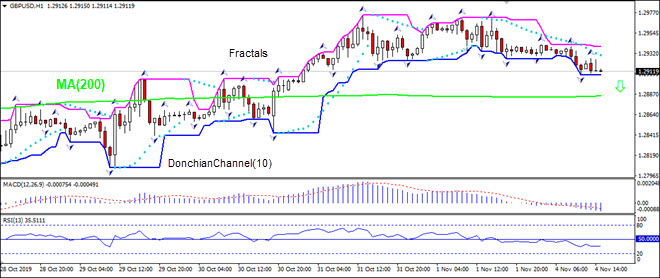
UK construction activity declined in October for the sixth consecutive month. Will the GBPUSD decline?
On 1-hour timeframe GBPUSD: H1 is in downtrend, above the 200-period moving average MA(200) which is levelling off. The RSI indicator is below 50 level but has not reached oversold zone.
The US dollar has kicked off the new week on a firmer footing. USD index rallied to 97.11 last from earlier lows of 96.99. Friday’s jobs report was mixed, but broadly positive. The headline NFP figure came in at 128k vs 90k expected.
Despite the beat in the NFP, the unemployment rate was higher last month at 3.6% from 3.5% prior, while average hourly earnings were also a little soft at 0.2% on the month, versus an expected 0.3%. This week, key focus will be on the ISM Non-Manufacturing reading due tomorrow.
EUR Lower on USD Strength
EURUSD has been a little lower over the morning so far on Monday, largely as a result of the stronger US dollar. Today, markets will be focusing on Christina Lagarde who makes her first speech as the new president of the ECB. Traders will be keen to see if Lagarde gives any insight into her views on the economy and ECB monetary policy. EURUSD trades 1.1159 last.
GBP Traders Waiting on BOE
GBUSD has had a muted start to the week, trading slightly in the red as of writing. Incoming headlines around the UK elections campaign will remain the key driver in the short term for GBP.
However, the main focus this week is the BOE meeting on Thursday with traders noting a growing risk that the BOE could cut rates given the further extension to Brexit which is prolonging uncertainty. GBPUSD trades 1.2920 last.
Risk Rallies on Monday
Risk assets have started the week with a bang as the SPX500 continues to trade to fresh all-time highs. Against a backdrop of a further rate cut from the Fed and increased optimism over a US-China trade deal, US equities remain well supported with SPX500 trading 3076.68 last. The UK100 & GER30 are higher at the start of the week also following the avoidance of a no-deal Brexit.
JPY & Gold Lower
Safe havens have been lower over the session so far on Monday. Unsurprisingly, given the gains in risk assets and a more risk-positive environment, JPY and gold are both lower against the dollar. USDJPY trades 108.37 last with price having fallen back below the 108.84 level. XAUUSD trades 1510.21 last, stalling just shy of the key 1522.75 level.
Crude Remains Resilient
Oil prices have started the week in the red, given the stronger US dollar seen over the morning so far. Last week, the EIA reported a huge 5.7 million barrel increase in US crude stores, far higher than analyst projections. However, crude was able to reverse the initial downside to trade higher on the back of the Fed rate cut which, along with better optimism over a US-China trade deal, is keeping the outlook positive for crude in the near term. Crude trades 56.26 last, back above the 55 level this week.
CAD Clinging On
USDCAD has been a little lower today, capped b the 1.3145 level for now. Last week, the BOC kept rates on hold though signaled that further cuts will likely be necessary given weaker global conditions. However, if crude prices start to recover over the coming months on a US-China trade deal this could help alleviate some of the pressure on the BOC.
AUD on The Up
AUDUSD is at an important technical point, testing the bearish trend line from mid-2018 highs along with the .6926 structural level, which is holding for now. Expectations that the US and China will sign a trade deal is keeping AUD supported here as risk assets rally, suggesting the likelihood that we break above the .6926 level soon. However, the RBA meets this week and has the potential to send AUD lower is it strikes a dovish tone. While the bank is not expected to ease again at this point, it could well signal the likelihood of further easing, as we saw with the BOC.
Brexit extension may reduce risks for UK companies
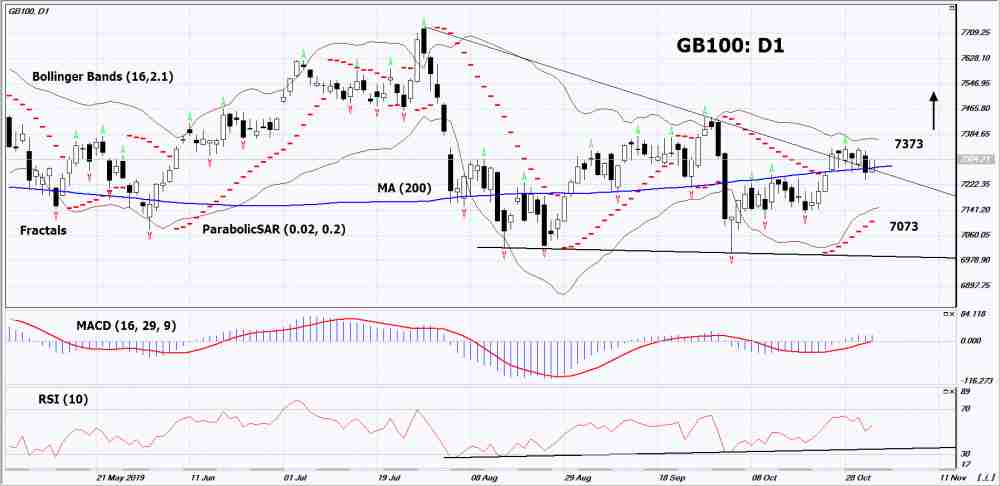
The British FTSE 100 index is noticeably behind the S&P 500 due to Brexit risks and looks underestimated. Will the GB100 quotations grow?
Since mid-2016, when a referendum on Britain’s withdrawal from the European Union took place, the FTSE 100 grew by 15%, and the S&P 500 – by 50%. Due to this lag, the dividend yield of the British index is now 4.6% versus 2.4% for the US. The P/E (total capitalization / total profit of companies for the year) of the FTSE 100 is 14.8. This is below the P/E of the S&P 500, now equal to 21.2. The timing of Britain’s exit from the EU was postponed from October 31, 2019 to January 31, 2020. This can reduce Brexit risks and help align the fundamental performance of the FTSE 100 with other global stock indices. Note that since the beginning of 2019, the S&P 500 has risen by 22%, and the FTSE 100 – by 8.5%.
On the daily timeframeGB100: D1 is in a neutral trend around the 200-day moving average line. Various technical analysis indicators have generated signals to increase. Further growth of quotations is possible in case of successful completion of Brexit and positive economic indicators in the UK.
The Parabolic indicator demonstrates a signal to increase.
The Bolinger bands narrowed, indicating a volatility decrease. The bottom line of the Bollinger has a slope up.
The RSI indicator is above the mark of 50. It has formed a divergence to increase.
The bullish momentum may develop if GB100 exceeds its last upper fractal and the upper Bollinger line: 7373. This level can be used as an entry point. The initial stop lose should be placed below the last two lower fractals, the lower Bollinger line, the 200-day moving average line and the Parabolic signal: 7073. After the pending order is opened, the stop shall be moved following Bollinger and Parabolic signals to the next fractal minimum. Thus, we are changing the potential profit/loss to the breakeven point. More risk-averse traders may switch to the 4-hour chart after the trade and place a stop loss moving it in the direction of the trade. If the price meets the stop level (7073) without reaching the order (7373), we recommend to cancel the order: the market sustains internal changes that were not taken into account.
The UK PM fought desperately to get his Brexit deal through parliament.
However, in the end, his efforts failed. While MPs did ultimately back the PM’s deal, parliament refused to support rushing the deal through in time to deliver Brexit by the October 31st deadline which was in place at the time.
Following his defeat, Johnson deferred to the procedure outlined in the recently passed Benn Bill and requested a 3 month Brexit extension from the EU.
EU Grants UK January 31st, 2020 Brexit “Flextension”
The EU was in no rush to agree to a Brexit deadline. Initial comments from EC president Donald Tusk cast doubt over whether the EU would grant the UK a further Brexit extension.
The endless deliberations and negotiations have irritated EU leaders and divided opinions. After taking a week to agree to grant the UK an extension, the EU took an extra few days before announcing the deadline with which it was comfortable.
After a tense period for both the markets and UK politicians, the EU agreed to the UK’s 3 month Brexit extension request. Additionally, the EU noted that it has granted the UK a “flextension”. This means that if parliament can agree on a deal ahead of the deadline, the UK will be allowed to leave sooner.
UK PM Calls December Elections
News that the EU had granted the UK’s extension request was initially received as GBP positive.
MPs had backed Johnson’s deal but were against the initial timeline. Therefore, the new deadline would grant Johnsons the chance to garner proper support to implement his deal.
However, the picture has somewhat changed following the calling of general elections in December. Following parliamentary approval, the UK will now vote on the next government on December 12th.
Johnsons Pushing For Pre-Christmas Brexit
Johnson remains adamant that his deal is the best outcome. In fact, he has said that should the Conservative party take a majority and lead government again, he will press ahead with his deal to complete Brexit by Christmas.
The opposition party, Labour, has said that it will support a second referendum should it take power. Corbyn would like to ask the country whether it would rather support the current Brexit deal on offer or remain in the EU.
Taking a slightly more hard-line stance, the Liberal Democrats plan to revoke Article 50 and cancel Brexit if they win.
Labour & Conservative Close in Polls
Initial polling results from ORB International show that the race between the Conservative party and the Labour party is a lot closer than many people think. The Tories are at 36% and Labour is at 28%.
Given the major voting upsets we have seen in recent years, such a narrow margin so early on is a major red flag for Johnson.
There has been a huge mobilization of support behind the call for a second referendum. This could spill over into a win for Labour. However, given the massive division on this issue, it is difficult to see any party making a clean sweep. Another coalition government seems the most likely result unless things shift materially.
GBP Boosted By Brexit Delay
The market has so far taken the news of a further Brexit delay as a positive.
Over October, GBPUSD enjoyed its strongest month since January 2018 as the market paired its short positions. This latest three-month delay means that, once again, the UK has avoided the potential catastrophe of a no-deal Brexit. And most importantly, the chances of the UK leaving with a deal have increased, keeping GBP supported.
With the general elections on the horizon, there is also the outside chance that we could see Brexit canceled altogether. More specifically, this would be the case if we saw a Labour- Liberal Democrat government formed.
Technical Perspective
Looking at GBPUSD on the monthly chart, you can see that price has formed a large double bottom with the post-Brexit referendum closing at a low of 1.2253. Price has rallied firmly off the level, with the RSI indicator showing bullish divergence.
The next area to watch will be the retest of the long term bearish trend line from 2014 highs. If price breaks back above here, the focus will shift to the 1.4280 structural resistance.
Coming down onto the daily chart, you can see the extent of the recent rally. Price is close to testing the long term bearish trend line now, where we also have decent structural resistance between 1.3291 -1.3368. To the downside, any retest of the 1.2498 level should find support and while above here, focus is on further upside.
The USD lost favor as the economic data on Friday saw a packed day.
The ISM manufacturing PMI for October came in at 48.3, missing estimates of 49.0. This marks the third month of contraction in the manufacturing sector.
The payrolls report was also mixed. The economy added 128k jobs, slightly better than estimates. September’s payrolls were revised upwards to 180k. But the unemployment rate ticked up to 3.6% on an increase in the participation rate. Wage growth slowed to a pace of 0.2% on the month.
Euro Gains on the Back of a Weaker USD
The euro logged gains as the US dollar fell. The currency pair, although a bit volatile, was trading near the previously established highs. Economic data from the eurozone was sparse.
This left most of the heavy lifting to the US data. A mixed bag of reports kept the USD subdued as a result.
EURUSD Could Retest Resistance at 1.1177
The currency pair recovered from the sell-off earlier this week and posted a strong rebound. This pushed the prices close to the resistance level of 1.1177.
Previous attempts to test this resistance level saw the EURUSD falling short before reversing. If the current momentum prevails, the EURUSD could hopefully test this resistance level more firmly.
Oil Jumps as Better Chinese Data
The declines in oil prices stalled after Friday’s data from China. The latest figures for October saw a modest recovery in China’s manufacturing sector.
The Caixin manufacturing PMI rose to 51.7, beating estimates of 51.0 and up from 51.4. Furthermore, Friday’s oil rig count also saw an increase, adding to the bullish sentiment in oil.
WTI Crude Oil Could Test 57.6 Resistance
The current rebound in oil prices comes as price tested the support area of 54.71 – 54.42. The reversal comes as this level previously held as resistance.
Therefore, the upside bias prevails. The upper resistance level at 57.6 – 57.9 will be the next target. But oil prices will need to break past this level to maintain the bullish momentum.
Gold Rises on the Back of Weak US Data
The precious metal did not make any major gains but closed on Friday with some moderate gains. The gains come on the back of weak economic data from the US.
It also now puts the Fed’s policy choice in question. The central bank said that it would not cut rates further. But the markets remain skeptical about this.
XAUUSD Consolidations at Resistance
Friday’s price action saw XAUUSD closing back at the resistance area of 1511. There was a modest recovery above this level towards the closing hours. Price action needs to follow through from here to confirm further upside.
The next main resistance is at 1534 which could be tested if the bullish momentum can prevail.
After finishing the correction, EURUSD is moving upwards. Possibly, the pair may form one more ascending wave towards 1.1231. Today, the price may reach 1.1181 and then resume falling to reach 1.1156. After that, the instrument may start another growth with the target at 1.1202.
GBPUSD, “Great Britain Pound vs US Dollar”
GBPUSD is consolidating around 1.2948. Possibly, today the pair may form a new descending structure to reach 1.2909 and then resume trading upwards to break 1.2975. Later, the market may continue growing with the target at 1.3087.
USDCHF, “US Dollar vs Swiss Franc”
USDCHF is consolidating around 0.9870. Today, the pair may fall to reach 0.9840 and then form one more ascending structure towards 0.9870. After that, the instrument may start a new decline with the target at 0.9813.
USDJPY, “US Dollar vs Japanese Yen”
USDJPY has completed the ascending impulse at 108.23 along with the correction; right now, it is forming the second impulse. Possibly, the pair may break 108.27 and then continue the correction towards 108.56. Later, the market may continue trading downwards with the target at 108.27.
AUDUSD, “Australian Dollar vs US Dollar”
AUDUSD is moving upwards. Today, the pair may reach 0.6925 and then form a new descending structure towards 0.6903. After that, the instrument may start another growth with the target at 0.6950.
USDRUB, “US Dollar vs Russian Ruble”
After rebounding from 64.14 and then breaking 63.56, USDRUB is moving downwards to reach 63.00. The pair isn’t traded today due to the holiday in Russia. After the market opening tomorrow, the pair may reach 63.27 and then form one more ascending structure towards 63.63. Later, the market may resume falling with the short-term target at 63.00.
USDCAD, “US Dollar vs Canadian Dollar”
USDCAD is falling; it has already broken 1.3145. Possibly, the pair may continue trading downwards to reach 1.3104 and then start a new growth with the target at 1.3155.
XAUUSD, “Gold vs US Dollar”
Gold is consolidating above 1506.15. Today, the pair may fall towards 1496.60. After that, the instrument may start another growth to return to 1506.15 to test it from below and then form a new descending structure with the target at 1480.00.
BRENT
After reaching 60.85, Brent has completed the continuation pattern to extend this wave towards 62.16. Possibly, today the pair may form a new descending structure to reach 60.84 and then resume growing towards 61.50, thus forming another consolidation range between these levels. If later the price breaks this range to the downside, the market may continue moving downwards to reach 59.33; if to the upside – resume trading inside the uptrend with the short-term target at 64.00.
BTCUSD, “Bitcoin vs US Dollar”
BTCUSD is moving downwards. Possibly, today the pair may fall to break 9040.00 and then continue the correction towards 8900.00. Later, the market may start another growth to return to 9040.00 and then resume moving downwards to reach the key correctional target at 8700.00. After that, the instrument may form one more ascending structure towards 11100.00.
Attention! Forecasts presented in this section only reflect the author’s private opinion and should not be considered as guidance for trading. RoboForex LP bears no responsibility for trading results based on trading recommendations described in these analytical reviews.
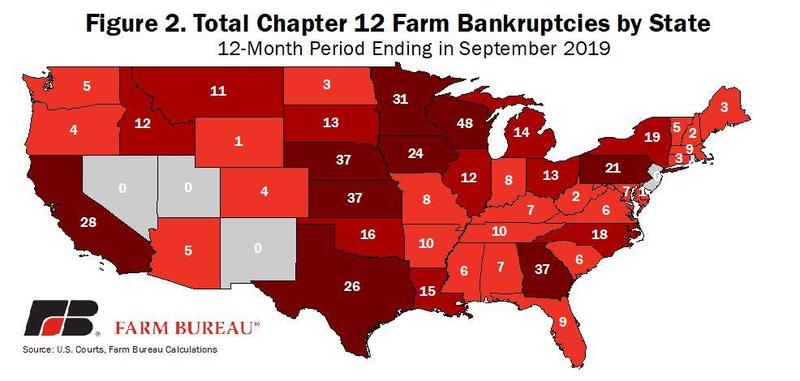
Farm delinquencies skyrocket +24% year over year as global trade issues and the ability to service credit continues to be a problem. This is a tell-tale sign that the US Fed decreased the Prime Rate recently as a result of broader credit issues related to higher interest rates for corporate and other borrowers. The last thing the Fed wants is another collapse on the lending markets similar to 2008-09.
(source: zerohedge.com)
Low growth continues to plague the global economy as this extended run in the US stock market continues to mature. There are many questions all traders are asking – will it continue higher or have we reached a new peak in price activity? Many economists believe we are ending an expansion period related to the revaluation of the global markets after the 2008-09 credit market collapse. The typical price cycle of approximately 6~7 years has extended beyond traditional bounds and many analysts are wondering how it may end?
If an economic cycle has truly come to an end, we should expect to see some change in economic activity levels, consumer confidence and mortgage/housing activities. The end of an economic cycle is usually aligned with some moderate level of economic contraction and a slowing of economic activity. The one thing that may continue throughout this end of the mature economic cycle is the “capital shift” where capital rushes away from risk and into the US stock market as long as the reversion event stays at bay. (source: zerohedge.com)
Consumer Confidence levels have fallen recently to new lows. This is a very clear sign that consumers expect the economy to contract a bit based on continued trade-related issues and the overall maturity of the economic cycle.
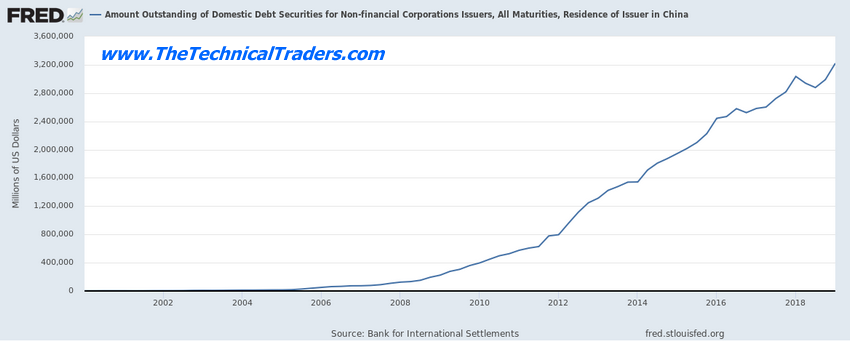
Most of the “rest of the world” has continued to binge on credit/debt since the 2008-09 credit crisis. This is a very clear sign that the US Fed and global central banks have pumped trillions of dollars out into the consumer, corporate and global markets over the past 8+ years. The question for all of us is when and if this debt becomes a liability – when does this credit become un-serviceable?
China and Asia were some of the biggest consumers of US credit/debt since 2008-09. This graph highlights the incredible 10,667% increase in debt in China since the 2008-09 levels – from approx 300 million to 3.2 billion in 8-9 short years. It appears the global economic rally was really the “binge on credit” rally.
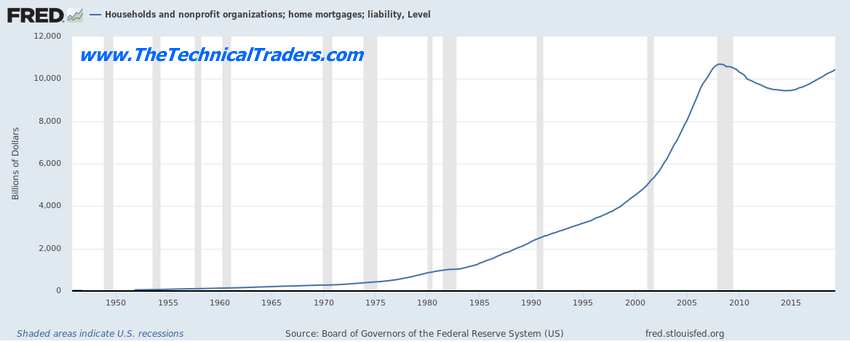
US Mortgage debt has climbed to near all-time highs recently as well. This is a sign that the US housing market has rallied to levels that are very close to the peak levels in 2007-08 – just before the crash. It may also be a sign that cracks may soon start to appear in the housing markets across the US as delinquencies and foreclosures may continue to skyrocket. People need to be able to service this debt/liability effectively in order to maintain their assets.
We believe the path of least resistance in the US stock market is higher – at least until price breaks below the current price trend channel. The continued capital shift where foreign investors continue to pour capital into the US stock market will likely continue until some event shakes the confidence of these foreign investors.
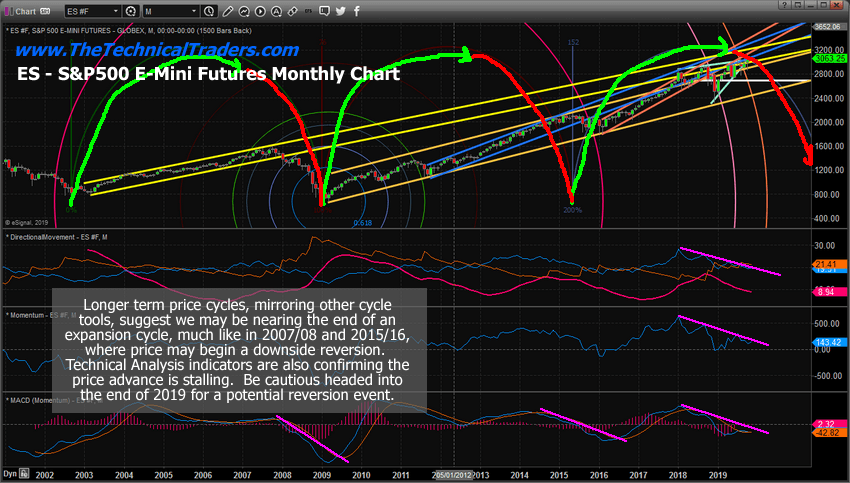
You can see from our Monthly chart of the ES, below, we have highlighted the longer-term economic maturity trend which typically lasts about 6~7 years. The rotation in 2015-16 was very mild as the US Fed continued a type of quantitative easing process by buying bonds and keeping interest rates historically low. Because the US stock market actually failed to experience any real price rotation near this 2015~2016 cycle date – we believe the current cycle highs are extremely extended and related to the credit binge that has taken place over the past 8+ years.
Our cycle research suggests we may have already past a cycle peak event and may be operating on borrowed time right now. This suggests that any further upside price activity in the US stock market may be a function of the overall strength of the US stock market compared to the weakening economic activity throughout the world. In other words, the capital shift process is still feeding large amounts of capital into the US stock market as foreign investors flee risk and uncertainty. If and when this ends, the US stock market will likely begin a price reversion process that may result in a very deep price correction.
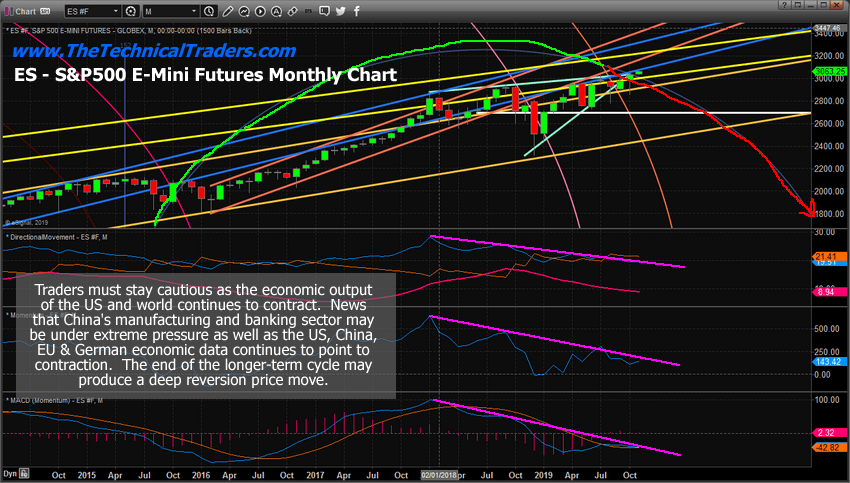
This last Monthly ES chart provides a closer look at the technical indicator data that we believe highlights the overall weakness that is building up in the US stock market. Even though we’ve recently pushed to new all-time highs, our technical indicators are suggesting that price is actually weakening in the upside price trend and could break lower at any moment.
The Direction Movement index, Momentum, and MACD of Momentum are all highlighting a weakening price trend that appears to be setting up for a broader downside price move eventually. Traders need to be very aware of the risks in this extended upside price trend and to prepare for the potential of a new credit crisis event related to the current credit levels that are far more extended than in 2008-09. If something breaks in the credit markets now, there appears to be nearly 5x to 10x the amount of credit extended throughout the global than there was 8 short years ago.
November will be the month of breakouts and breakdowns and should spark some trades. I feel the safe havens like bonds and metals will be turning a corner and starting to firm up and head higher but they may not start a big rally for several weeks or months.
October was a boring month for most major asset classes completing their consolidation phase. Natural gas was the big mover in October and subscribers and I took full advantage of the bottom and breakout for a 15-22% gain and its till on fire and trading higher by another 3% this week already.
If you like to catch assets starting new trends and trade 1x, 2x and 3x ETF’s the be sure to join my premium trade alert service called the Wealth Building Newsletter.
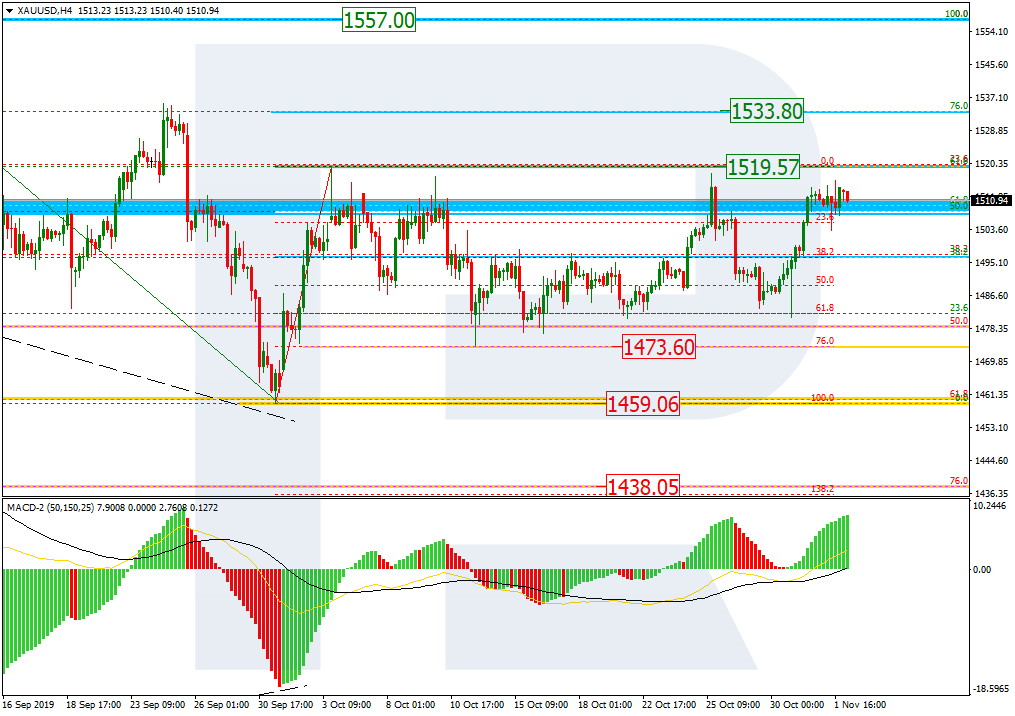
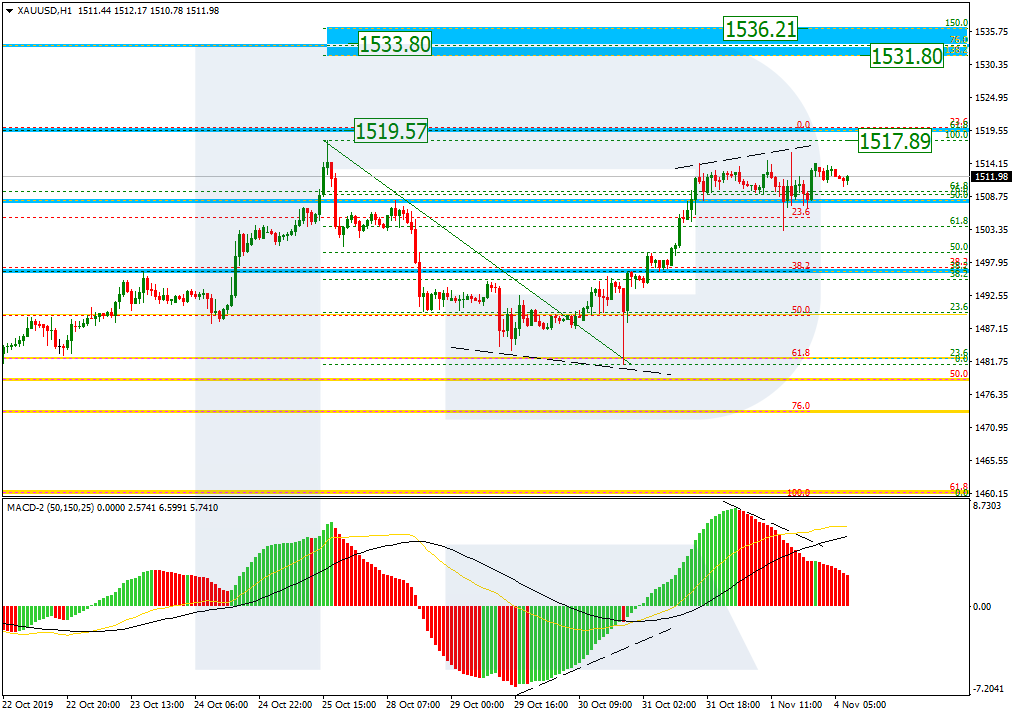
As we can see in the H4 chart, it’s been a month since the pair started moving sideways after the convergence. XAUUSD is getting closer to the high at 1519.57 and trying to break it for the third time. If the price breaks the high, the instrument may continue growing towards 76.0% fibo at 1533.08 and then the key high at 1557.00.
In the H1 chart, there is a convergence on MACD while the pair is trading close to the previous high at 1517.89, which means that the price is slowing down the current growth, which may be later followed by a new short-term pullback. If the instrument breaks the above-mentioned high, it may continue growing towards the post-correctional extension area between 138.2% and 161.8% fibo at 1531.80 and 1536.21 respectively.
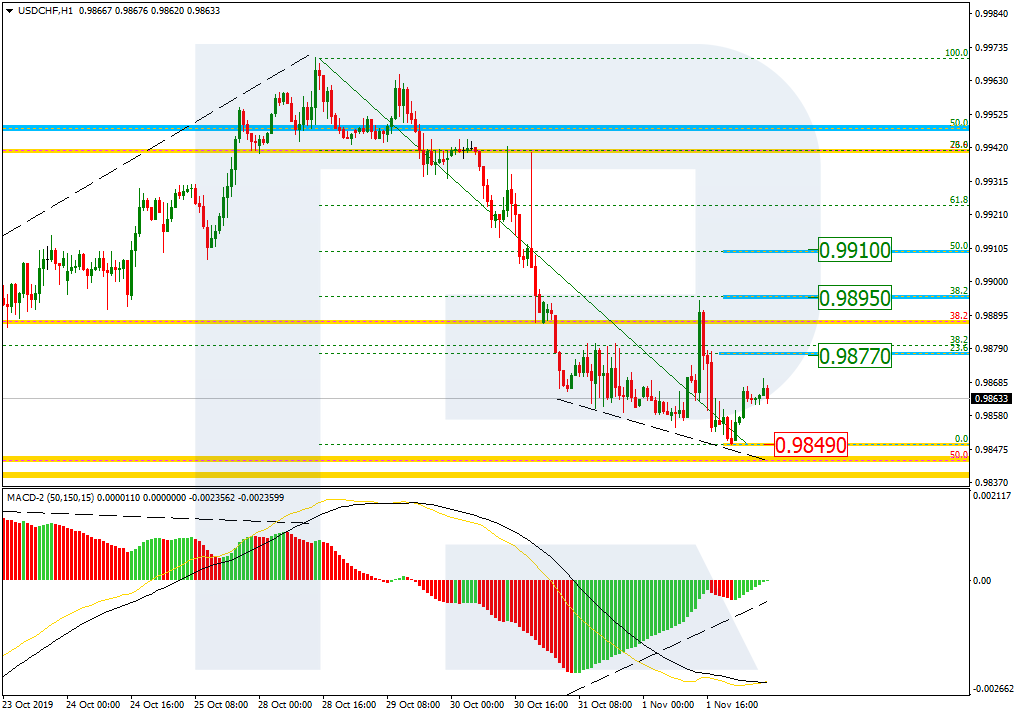
USDCHF, “US Dollar vs Swiss Franc”
As we can see in the H4 chart, another descending impulse is heading towards the fractal low at 0.9840. If USDCHF breaks this level, the instrument may continue the mid-term descending tendency towards 61.8% and 76.0% fibo at 0.9801 and 0.9748 respectively.
In the H1 chart, there is a convergence on MACD, which may indicate a possible pullback. The upside correctional targets may be 23.6%, 38.2%, and 50.0% fibo at 0.9877, 0.9895, and 0.9910 respectively. the support is the low at 0.9849.
Attention! Forecasts presented in this section only reflect the author’s private opinion and should not be considered as guidance for trading. RoboForex LP bears no responsibility for trading results based on trading recommendations described in these analytical reviews.
The economic calendar for the week ahead will continue with the RBA and the BoE holding their respective monetary policy meetings. Although no changes will be made, the monetary policy meetings stand out among a host of other things.
Most of the economic data over the week focus on a mix of high-impact events and some second-tier data. Most noticeably, the new ECB President Christine Lagarde will be giving a speech on Monday.
Investors will keep a close eye on Lagarde in order to gauge what the future monetary policy direction of the ECB will be.
Data from the United States will see the release of the ISM non-manufacturing PMI report. Besides the NMI report, it is a relatively quiet week for the dollar. There are a number of Fed members who will take turns this week.
The Fed speech lineup comes on the back of last week’s Fed rate cuts, which the central bank said it would pause for the remainder of the year.
Here’s a brief look at the key economic events coming up for the week ahead.
RBA Interest Rate and Retail Sales Report
Focus turns to Australia this week which has a somewhat busy calendar. The week starts off with the retail sales report followed by the RBA meeting. Later in the week, the RBA will also be releasing its meeting minutes.
Retail Sales to Chug on at a Steady Pace
The monthly retail sales report is due on Monday.
Economists forecast that Australia’s retail sales will rise by 0.4% in September. The data comes after retail sales in August also rose 0.4%. However, the results were disappointing compared to the forecasts.
The data was weaker despite the policy stimulus in the economy. This includes refunds on income tax and interest rate cuts.
A disappointment on the data will no doubt keep the bearish sentiment alive.
RBA to Leaves Rates Unchanged
The Reserve Bank of Australia will be holding its monetary policy meeting later in the week.
The RBA meeting, which is due on Tuesday, will see officials leaving interest rates steady at 0.75%.
Interest rates in Australia have been cut to historic lows this year. The central bank hopes that the lower rates will boost inflation and also give a kickstart to the economy.
As a result, within the larger scheme of things, the retail sales report will likely give an estimate of how consumer spending fared during the month.
Bank of England to Remain on the Sidelines
The Bank of England will be holding its monetary policy meeting this week. But economists say that there will no changes from the policymakers. The UK’s central bank has left rates unchanged while waiting for the Brexit cloud to dissipate.
However, recent developments have pushed the UK’s Brexit deadline to January 2020. Meanwhile, the call for snap elections in early December will mean that the BoE will have to wait a bit more.
But the central bank is in no rush to change its monetary policy. Recent inflation reports have shown that consumer prices were retreating. This gives room for the BoE officials to wait and bide more time.
At the same time, the UK economy is somewhat slowing. It will be interesting to hear what officials think about the economy and its thoughts on forward guidance.
Christine Lagarde’s First Speech as ECB President
The week starts off for the eurozone with an opening speech by the new ECB President Lagarde. Formerly the head of the International Monetary Fund (IMF), investors will be keen to hear her speak.
There are mixed opinions on Draghi’s stimulus program and negative interest rates. Thus, investors will be looking to see if Lagarde will continue on with his policies.
Elsewhere, the economic data from the eurozone will cover industrial production from Germany. The numbers will be key given that the eurozone economy bucked the trend and came up with reasonably growth figures.
IHS Markit will be releasing the monthly services and manufacturing PMI figures for October.
This week – November 4 through November 9 – central banks from nine countries or jurisdictions are scheduled to decide on monetary policy: Australia, Malaysia, Thailand, Iceland, Poland, Romania, Belarus, Albania, Serbia, Czech Republic, United Kingdom and Peru.
Following table includes the name of the country, the date of the next policy decision, the current policy rate, the result of the last policy decision, the change in the policy rate year to date, and the rate one year ago.
The table is updated when the latest decisions are announced and can always accessed by clicking on This Week.