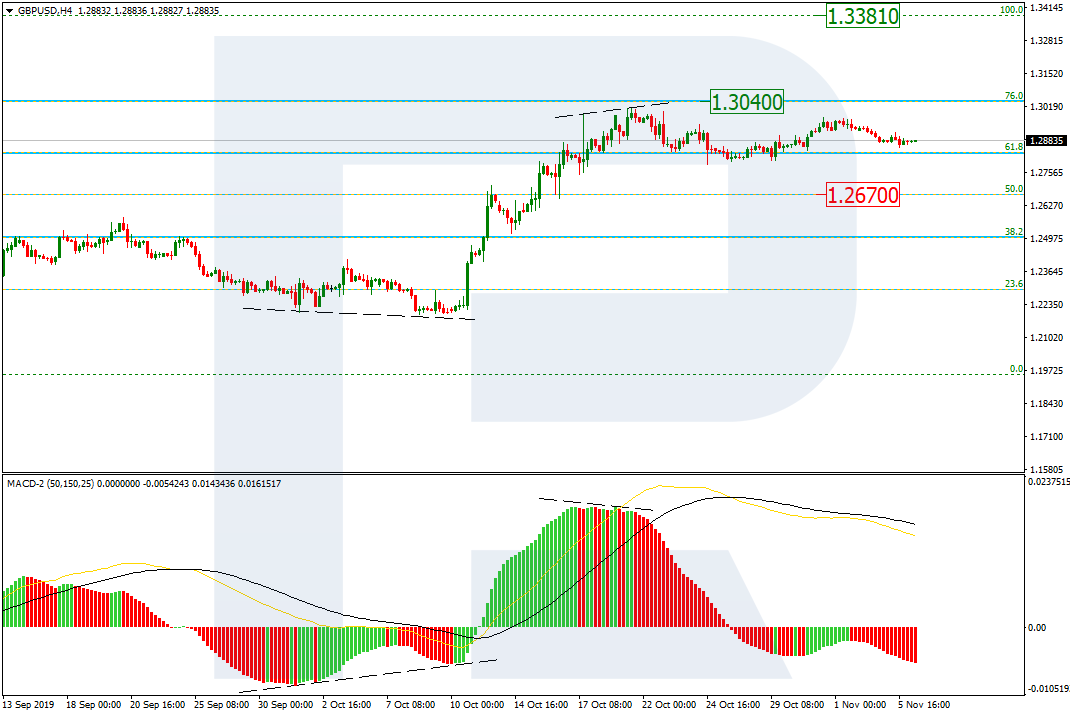
As we can see in the H4 chart, there was a divergence on MACD, which made GBPUSD complete the rising wave at 76.0% fibo at 1.3040 and start a new pullback. The support is at 1.2670. After completing the pullback, the instrument may start another rising impulse to reach the previous high at 1.3012 and then the key one at 1.3381.
The H1 chart shows more detailed structure of the current descending correction. The pair has already reached 23.6% fibo, but may yet continue falling towards 38.2%, 50.0%, and 61.8% fibo at 1.2699, 1.2604, and 1.2507 respectively.
EURJPY, “Euro vs. Japanese Yen”
As we can see in the H4 chart, after reaching 76.0% fibo at 121.55, EURJPY has started a new sideways movement. If the price breaks the resistance at 121.47, the pair may resume growing. The key target is the high at 123.36.
In the H1 chart, the pair has reached 23.6% fibo. In the future, the instrument may continue falling towards 38.2%, 50.0%, and 61.8% fibo at 119.79, 119.27, and 118.75 respectively.
Attention! Forecasts presented in this section only reflect the author’s private opinion and should not be considered as guidance for trading. RoboForex LP bears no responsibility for trading results based on trading recommendations described in these analytical reviews.
Euro-zone’s composite PMI improved in October: rose to 50.6 from 50.1 in September. Will the EURUSD rise?
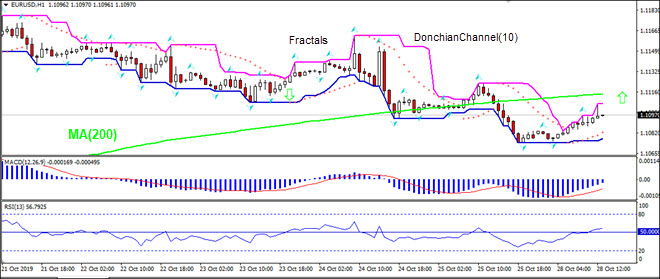
The price chart on 1-hour timeframe shows EURUSD: H1 is in uptrend. The price is rising toward the 200-period moving average MA(200) which is level. The RSI oscillator is below 50 level.
Yesterday, the US dollar strengthened significantly against its main competitors. The fall of EUR/USD quotes exceeded 50 points. The trading tool has reached key extremes. USD demand rose amid growing prospects for a settlement of the trade conflict between Washington and Beijing. According to media reports, the parties are considering the possibility of mutual concessions in order to sign the first stage of the agreement in November. Additional support for the US currency was provided by positive data on business activity in the US non-manufacturing sector from ISM. Currently, EUR/USD quotes are consolidating in the range of 1.10650-1.10850. The EUR/USD currency pair can decline further. We recommend opening positions from key levels.
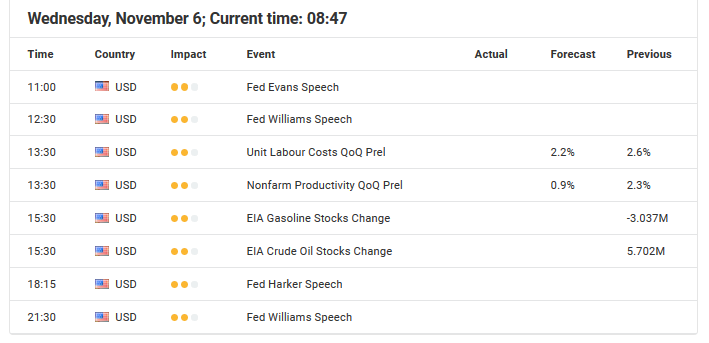
The Economic News Feed for 06.11.2019:
– Composite PMI by Markit (EU) – 11:00 (GMT+2:00);
– Retail Sales Volume (EU) – 12:00 (GMT+2:00);
Pay attention to the speeches by FOMC representatives.
Indicators signal the strength of sellers: the price has fixed below 50 MA and 100 MA.
The MACD histogram is in the negative zone, but above the signal line, which gives a weak signal to sell EUR/USD.
The Stochastic Oscillator is in the neutral zone, the %K line is below the %D line, which also indicates a bearish sentiment.
Trading recommendations
Support levels: 1.10650, 1.10250, 1.10000
Resistance levels: 1.10850, 1.11000, 1.11200
If the price consolidates below 1.10650, expect a further drop in the EUR/USD quotes toward 1.10300-1.10100.
Alternatively, the quotes could grow toward 1.11000-1.11200.
The GBP/USD currency pair
Technical indicators of the currency pair:
Prev Open: 1.28834
Open: 1.28835
% chg. over the last day: -0.03
Day’s range: 1.28687 – 1.28851
52 wk range: 1.1959 – 1.3385
An ambiguous technical pattern has developed on the GBP/USD currency pair. Sterling is consolidating. There is no defined trend. At the moment, the local support and resistance levels are 1.28650 and 1.29000, respectively. Investors expect additional drivers. Demand for the US dollar remains at a fairly high level. GBP/USD quotes can decline yet. We recommend opening positions from key levels.
The Economic News Feed for 06.11.2019 is quite calm.
The price fixed below 50 MA and 100 MA, which signals the strength of sellers.
The MACD histogram is in the negative zone, but above the signal line, which gives a weak signal to sell GBP/USD.
The Stochastic Oscillator is in the neutral zone, the %K line began to cross the %D line. There are no signals at the moment.
Trading recommendations
Support levels: 1.28650, 1.28400, 1.28100
Resistance levels: 1.29000, 1.29250, 1.29700
If the price consolidates below 1.28650, expect a further decline in GBP/USD quotes.
Alternatively, the quotes could grow toward 1.29200-1.29400.
The USD/CAD currency pair
Technical indicators of the currency pair:
Prev Open: 1.31496
Open: 1.31550
% chg. over the last day: +0.06
Day’s range: 1.31411 – 1.31704
52 wk range: 1.2727 – 1.3664
The USD/CAD currency pair continues to trade flat. Unidirectional trends are not observed. Financial market participants took a wait and see attitude before the release of important statistics from Canada. Looney is currently testing local support and resistance levels: 1.31400 and 1.31750, respectively. USD / CAD quotes have upside potential. We recommend paying attention to the dynamics of oil quotes. Positions must be opened from key levels.
At 17:00 (GMT+2:00) Ivey will publish a Canadian PMI.
Indicators do not give accurate signals, 50 MA has crossed 100 MA.
The MACD histogram has moved into the positive zone, which indicates the growth of USD/CAD.
The Stochastic Oscillator is in the overbought zone, the %K line has crossed the %D line. There are no signals at the moment.
Trading recommendations
Support levels: 1.31400, 1.31150, 1.31000
Resistance levels: 1.31750, 1.32000
If the price consolidates above 1.31750, expect the quotes to rise toward 1.32000-1.32200.
Alternatively, the quotes could decrease toward 1.31150-1.31000.
The USD/JPY currency pair
Technical indicators of the currency pair:
Prev Open: 108.586
Open: 109.170
% chg. over the last day: +0.52
Day’s range: 108.909 – 109.118
52 wk range: 104.97 – 114.56
A pronounced upward trend is observed on the USD/JPY currency air. The trading tool has reached the key extremes. The quotes are consolidating at 108.850-109.100. The demand for safe have currencies has weakened. JPY can decline further against the USD. Keep an eye on the US government bonds and open positions from the key levels.
During the Asian trading session, Japan has published a weak report on business activity in the service industry.
The price fixed above 50 MA and 100 MA, which signals the power of buyers.
The MACD histogram is in the positive zone, but below the signal line, which gives a weak signal to buy USD/JPY.
Stochastic Oscillator is in the neutral zone, the %K line is above the %D line, which indicates a bullish sentiment.
Trading recommendations
Support levels: 108.850, 108.650, 108.500
Resistance levels: 109.100, 109.250, 109.500
If the price consolidates above 109.100, expect further growth toward 109.300-109.500.
Alternatively the quotes could decrease toward 108.650-108.500.
After the FED cut rates by 25 basis points last Wednesday, but didn’t deliver any significant further impulses or signs in regards to future monetary policy steps, the ISM Non-Manufacturing data set yesterday pointed to a rise of 54.7 in October from a near 3-year low of 52.6 in September, beating market expectations of 53.5. Business activity, employment and new orders all grew at faster rates.
As a result, expectations among market participants of another FED rate cut by 25 basis points in December dropped to around 5%, making such a step very unlikely and pushed the yellow metal back below 1,500 USD.
If Gold bulls succeed in breaking above 1,520 USD, another test of the current yearly highs around 1,557 USD may be possible. However, currently the mode is bearish in the short term.
Nevertheless, the overall technical picture on a daily time-frame didn’t significantly darken, but instead brings now a potential mid-term long trigger around 1,440/450 USD into play.
Source: Admiral Markets MT5 with MT5SE Add-on Gold Daily chart (between 07 August 2018 to 05 November 2019). Accessed: 05 November 2019 at 10:00 PM GMT
Please note: Past performance is not a reliable indicator of future results, or future performance.
In 2014, the value of Gold fell by 1.7%, in 2015, it fell by 10.4%, in 2016 it increased by 8.1%, in 2017 it increased by 13.1%, in 2018, it fell by 1.6%, meaning that after five years, it was up by 6.4%.
Disclaimer: The given data provides additional information regarding all analysis, estimates, prognosis, forecasts or other similar assessments or information (hereinafter “Analysis”) published on the website of Admiral Markets. Before making any investment decisions please pay close attention to the following:
This is a marketing communication. The analysis is published for informative purposes only and are in no way to be construed as investment advice or recommendation. It has not been prepared in accordance with legal requirements designed to promote the independence of investment research, and that it is not subject to any prohibition on dealing ahead of the dissemination of investment research.
Any investment decision is made by each client alone whereas Admiral Markets shall not be responsible for any loss or damage arising from any such decision, whether or not based on the Analysis.
Each of the Analysis is prepared by an independent analyst (Jens Klatt, Professional Trader and Analyst, hereinafter “Author”) based on the Author’s personal estimations.
To ensure that the interests of the clients would be protected and objectivity of the Analysis would not be damaged Admiral Markets has established relevant internal procedures for prevention and management of conflicts of interest.
Whilst every reasonable effort is taken to ensure that all sources o
On Tuesday the 5th of November, trading on the single currency closed 0.48% down against the dollar. The pair declined along with the euro crosses amid a broadly stronger dollar following strong services PMI data.
The ISM non-manufacturing index in October rose from 52.6 to 54.7 points (against a forecast of 53.8). The probability of a rate slash in December has fallen. CME puts the likelihood of a December rate hike at 94.8%. This news led to a rise in US bond yields.
Day’s news (GMT+3):
13:00 Eurozone: retails sales (Sep).
16:00 US: Fed’s Evans speech.
17:30 US: Fed’s Williams speech.
18:00 Canada: Ivey PMI (Oct).
18:30 US: EIA crude oil stocks change (1 Nov).
Current situation:
On Tuesday we expected a recovery to the balance line. Growth was mitigated by news coming from the UK. Traders began ditching the euro for the pound on the EURGBP cross. The drop gathered pace in the US session to mark a total drop of 90 degrees.
Now the situation is as follows. A double top has formed between 31/10 and 04/11 on the hourly timeframe, and this model has now been confirmed on the H8 timeframe. Markets have already factored in a trade deal being concluded by the US and China, giving the impression that the rise was used to close long positions and open shorts.
The pair stopped at the 90th degree, while the 112th degree at 1.1043 is a reversal level. We’ve highlighted a correction zone within a rectangle on the chart. The market is technically ready for a decline. We now await a bullish divergence on the AO. Long positions will become viable after a breakout of the trend line at 1.1075.
The Dollar index (DXY) has gained 0.7 percent so far this week, briefly breaching the 98.0 psychological mark before easing from its highest levels in nearly three weeks. The DXY continues to demonstrate its resilience against its major peers, strengthening against all G10 currencies so far this week, and has erased its losses since the Fed lowered interest rates on October 30.
The Dollar has been buffered by signs that US economic growth momentum remains intact, a notion underscored by October’s better-than-expected ISM non-manufacturing index released yesterday and last week’s non-farm payrolls. Unless the incoming economic data point to a steeper-than-expected slowdown in the US economy, the Greenback should remain supported through year-end.
Fed officials’ speeches could yield clues on policy bias
Fed chair Jerome Powell recently stated that US monetary policy is in a “good place”, prompting investors to push back expectations for the next Fed rate cut, while any policy tightening has essentially been ruled out barring signs of “serious” inflation. The Fed Funds futures currently point to a better-than-even chance that the FOMC will maintain US interest rates at current levels at least through April 2020.
The slate of Fed speak over the coming days could offer further support for the Dollar, especially if they continue trumpeting the US economy’s solid footing. However, should investors get the sense that Fed officials are still open to policy easing over the near-term, we could see DXY unwinding recent gains as investors recalibrate their forecasts for US interest rates.
Asian currencies ride US-China trade deal optimism
Unlike G10 currencies, most Asian currencies have been able to strengthen against the Greenback this week, as investors grow increasingly confident that a US-China trade deal will become official sometime in November. A signed deal, albeit a limited one, could trigger another bout of risk-on sentiment which should give Asian currencies another leg up.
Strengthening in the Yuan and USDCNY breaking below the psychologically important 7.0 mark offered cues for the former’s regional peers to follow suit, considering the Yuan’s role as a barometer for US-China trade relations. However, Asian currencies will need more concrete signs that the deal will be formalized before they can realize more upside against the Greenback.
Bullion bulls in doubt as US-China trade deal grows likelier
Gold fell sharply below the $1500 psychological level before bouncing off $1479.50, as investors grow hopeful once again that the US and China will come to a trade agreement this month. Risk sentiment has been volatile of late, with investors reacting to every headline pertaining to the US-China trade conflict. A signed deal this month would ease global recession fears while potentially sending Gold prices towards $1460.
Disclaimer: The content in this article comprises personal opinions and should not be construed as containing personal and/or other investment advice and/or an offer of and/or solicitation for any transactions in financial instruments and/or a guarantee and/or prediction of future performance. ForexTime (FXTM), its affiliates, agents, directors, officers or employees do not guarantee the accuracy, validity, timeliness or completeness, of any information or data made available and assume no liability as to any loss arising from any investment based on the same.
US stocks pulled back on Tuesday despite positive data. The S&P 500 slipped 0.1% to 3074.67. The Dow Jones industrial average however gained 0.1% to new record 27492.63. Nasdaq added 0.02% to 8434.68. The dollar strengthening was intact as the Institute of Supply Management’s service sector activity index rose to 54.7% in October, up from 52.6% in September. The live dollar index data show the ICE US Dollar index, a measure of the dollar’s strength against a basket of six rival currencies, rose 0.3% to 97.90 and is higher currently. Futures on US stock indices point to lower openings.
CAC 40 leads European indexes gains
European stock market advanced third straight session on Tuesday. Both the EUR/USD and GBP/USD continued their slide yesterday with both pairs higher currently. The Stoxx Europe 600 ended 0.2% higher led by mining stocks. The German DAX 30 added 0.1% to 13148.50. France’s CAC 40 rose 0.4%. UK’s FTSE 100 advanced 0.3% to 7388.08 as services sector contraction halted in October.
Australia’s All Ordinaries Index leads Asian indexes losses
Asian stock indices are mixed today against the backdrop of reports Chinese negotiators want the removal of 15% tariffs on about $125 billion worth of goods that went into effect September 1 and the $250 billion of import duties. Nikkei rose 0.2% to 23303.82 despite yen reversing its slide against the dollar. Chinese stocks are mixed as China’s central bank cut its base interest rate on a one-year loan by 0.05% to 3.25%: the Shanghai Composite Index is down 0.6% while Hong Kong’s Hang Seng index is 0.2% higher. Australia’s All Ordinaries Index turned 0.6% lower despite Australian dollar resuming its slide against the greenback.
Brent futures prices are falling today. Prices rose yesterday: January Brent rose 1.3% to $62.96 a barrel on Tuesday. Trade group the American Petroleum Institute late Tuesday report indicated US crude supplies rose by 4.3 million barrels last week. Today at 16:30 CET the Energy Information Administration will release US Crude Oil Inventories.
Note: This overview has an informative and tutorial character and is published for free. All the data, included in the overview, are received from public sources, recognized as more or less reliable. Moreover, there is no guarantee that the indicated information is full and precise. Overviews are not updated. The whole information in each overview, including opinion, indicators, charts and anything else, is provided only for familiarization purposes and is not financial advice or а recommendation. The whole text and its any part, as well as the charts cannot be considered as an offer to make a deal with any asset. IFC Markets and its employees under any circumstances are not liable for any action taken by someone else during or after reading the overview.
Shares of RedHill Biopharma Ltd. traded more than 10% higher today after the firm announced that the FDA has approved its Talicia delayed-release capsules for the treatment of H. pylori infection in adults. The firm plans to commence distribution by its U.S. sales force in Q1/20.
This morning Tel Aviv-based specialty biopharmaceutical company RedHill Biopharma Ltd. (RDHL:NASDAQ), which is focused on the development and commercialization of proprietary drugs for the treatment of gastrointestinal diseases, announced that “the U.S. Food and Drug Administration (FDA) has approved Talicia® (omeprazole magnesium, amoxicillin and rifabutin) delayed-release capsules 10 mg/250 mg/12.5 mg for the treatment of Helicobacter pylori (H. pylori) infection in adults.” The company stated its sales force expects to launch Talicia in the U.S. in Q1/20.
The firm advised in the release “Talicia is the only rifabutin-based therapy approved for the treatment of H. pylori infection and is designed to address the high resistance of H. pylori bacteria to current clarithromycin-based standard-of-care therapies. It is estimated that H. pylori resistance to clarithromycin more than doubled between 2009-2013.”
RedHill Biopharma’s CEO Dror Ben-Asher commented, “The FDA’s approval of Talicia demonstrates our unwavering dedication to patients suffering from gastrointestinal diseases…We are working to expand our sales force to approximately 140 representatives who will promote Talicia, Aemcolo and other gastrointestinal-focused products in our basket.”
Lead investigator of the Talicia Phase 3 studies, David Y. Graham, MD, MACG, professor of medicine, molecular virology and microbiology at Baylor College of Medicine in Houston, stated, “Talicia offers patients a much-needed new treatment option for H. pylori with an excellent safety and efficacy profile that is not compromised by clarithromycin or metronidazole resistance. The clinical studies for Talicia demonstrated high efficacy in eradication of H. pylori. Studies with Talicia found zero resistance to rifabutin and showed 17% resistance to clarithromycin, a current standard-of-care macrolide antibiotic, consistent with current data showing that clarithromycin-containing therapies fail in approximately 25-40% of cases.”
In addition, Colin W. Howden, MD, AGAF, FACG, Hyman Professor of Medicine & chief of the Division of Gastroenterology at the University of Tennessee Health Science Center, added, “H. pylori is a major cause of peptic ulcer and gastritis. It is also carcinogenic and is the leading cause of gastric cancer. Treatment of H. pylori infection has become increasingly difficult due to growing bacterial resistance and the lack of advances in treatment options over the past decade. Talicia offers a new effective treatment option to overcome bacterial resistance and provide optimal efficacy and I believe it could become a recommended first-line standard-of-care treatment for H. pylori infection.”
The company advises in the report that H. pylori bacterial infection is classified as a Group I carcinogen by the International Agency for Research on Cancer that affects over 50% of the population worldwide and approximately 35%, or over 100 million people, in the U.S., with an estimated 2.5 million patients treated annually in the U.S.
The firm further explains in the release that “Talicia is a three-drug combination of omeprazole, a proton pump inhibitor, amoxicillin, a penicillin-class antibacterial, and rifabutin, a rifamycin antibacterial, indicated for the treatment of Helicobacter pylori infection in adults.”
RedHill Biopharma is a specialty biopharmaceutical company focused on the development and commercialization of late clinical-stage, proprietary, orally administered, small molecule drugs for the treatment of gastrointestinal and inflammatory diseases and cancer. The company commercializes and promotes several gastrointestinal products in the U.S., including Donnatal, EnteraGam and Mytesi, and plans to also launch Aemcolo and Talicia in the U.S.
RDHL ADR shares opened higher today at $8.43 (+$1.51, +21.82%) over Friday’s $6.92 closing price. The stock has traded today between $7.28 to $8.55 per share and is currently trading at $7.65 (+0.83, +11.99%).
Disclosure: 1) Stephen Hytha compiled this article for Streetwise Reports LLC and provides services to Streetwise Reports as an independent contractor. He or members of his household own securities of the following companies mentioned in the article: None. He or members of his household are paid by the following companies mentioned in this article: None. 2) The following companies mentioned in this article are billboard sponsors of Streetwise Reports: None. Click here for important disclosures about sponsor fees. 3) Comments and opinions expressed are those of the specific experts and not of Streetwise Reports or its officers. The information provided above is for informational purposes only and is not a recommendation to buy or sell any security. 4) The article does not constitute investment advice. Each reader is encouraged to consult with his or her individual financial professional and any action a reader takes as a result of information presented here is his or her own responsibility. By opening this page, each reader accepts and agrees to Streetwise Reports’ terms of use and full legal disclaimer. This article is not a solicitation for investment. Streetwise Reports does not render general or specific investment advice and the information on Streetwise Reports should not be considered a recommendation to buy or sell any security. Streetwise Reports does not endorse or recommend the business, products, services or securities of any company mentioned on Streetwise Reports. 5) From time to time, Streetwise Reports LLC and its directors, officers, employees or members of their families, as well as persons interviewed for articles and interviews on the site, may have a long or short position in securities mentioned. Directors, officers, employees or members of their immediate families are prohibited from making purchases and/or sales of those securities in the open market or otherwise from the time of the interview or the decision to write an article until three business days after the publication of the interview or article. The foregoing prohibition does not apply to articles that in substance only restate previously published company releases. 6) This article does not constitute medical advice. Officers, employees and contributors to Streetwise Reports are not licensed medical professionals. Readers should always contact their healthcare professionals for medical advice.
Sector expert dissects recent Fed and other government actions and discusses his recent precious metals trades.
In the 1976 movie “Network,” British actor Peter Finch won an Academy Award for his stunning portrayal of news anchorman Howard Beale, whose on-air descent into insanity, prompted by the social and economic conditions of the times, is now legendary. The iconic scene where Beale, clad in a rumpled raincoat and with wet hair plastered to his head, goes on national TV and implores watchers to go to their windows and scream “I’m mad as hell and not going to take this anymore!” is one of the most awe-inspiring scenes in the history of filmmaking. Should you wish to watch the scene for yourselves, the link can be found here.
You know, I must confess that there are days that are becoming all too frequent now, that I feel like a 2019 version of Howard Beale. I watched last Wednesday as Fed Chairman Jerome Powell stood in front of a room full of reporters and masterfully executed the Art of Obfuscation as he convinced the financial markets that $60 billion per month of paper money creation is a) not inflationary, b) not an emergency measure and c) in no way to be considered “quantitative easing” (QE). As if that alone was insufficient in sending me to the closest window, Friday at 8:30 EST, they trot out the BLS non-farm payroll numbers as an upside “beat” thanks largely to revisions to the Birth-Death Model (for about the 50th time since 2008) after which stocks scream to all-time highs, confirming what I been raging about since September.
Notwithstanding the obsession that Mr. Trump has with the stock market, I have been saying for the past month that shorting the S&P in the last two weeks of October AND as we approach a presidential election year was (and is) not a very good idea. However, what made me want to pull a “Howard Beale” is that it is all happening under a mirage of phony statistics and doctored economic data.
Nowhere in the MSM was there any mention that the U.S. debt clock just ticked past $23 trillion or that the Fed balance sheet is now north of $4 trillion, both of which serve as testimonials to the insolvency of the U.S. and the fraud called the Federal Reserve. Watching the rejoicing on the anchor desks of CNBC as this magical levitation of stocks occurs in the face of massive debts and critical overvaluation is as maddening as it gets. Listening to Larry Kudlow interviewed each and every time the S&P has a 0.5% pullback on “Trade Concerns” is as predictable as the sun rising.
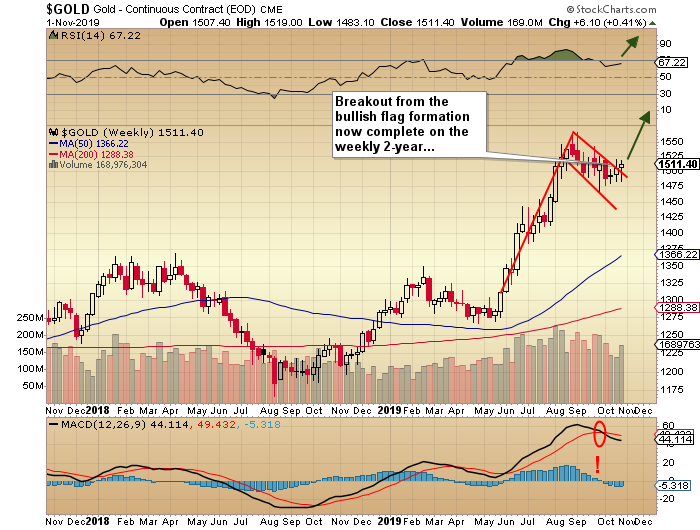
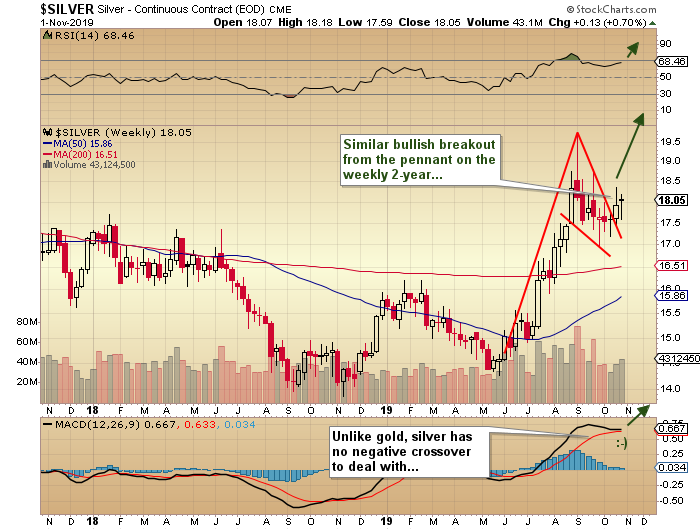
Rather than rant and rave about conditions over which we have no control, it is more fruitful to discuss the good things that are occurring in our markets such as the resumption of the bull markets in gold and silver and the associated miners. Of particular significance was the two attempted takedowns, the first on Wednesday after the FOMC rate cut and the second on Friday immediately following the jobs report, that were summarily rejected, leaving both gold and silver in fine shape technically and, more importantly, from a sentiment standpoint. The failure of the bullion bank behemoths to send the metals into all-out retreat has now resulted in the weekly charts registering breakouts from well-defined pennant formations, which in turn is significant because we are now into a period of positive seasonality for the precious metals that should last right through Q1 2020. I see new high ground for silver above $19.75 as it remains my “metal of choice” for the balance of 2019.
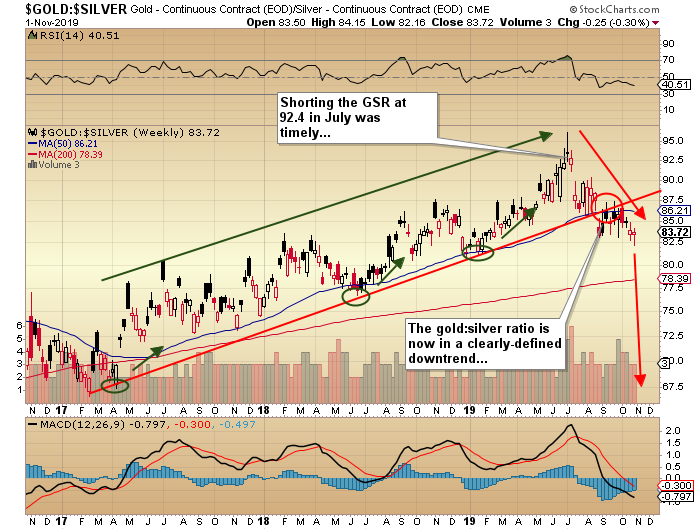
Of particular interest, as least for me, is the continuing downtrend in the gold-to-silver ratio (GSR), currently at 83.72 but well-off the highs seen last July when more than a few of the market mavens were calling for a move through 100. I took the other side of that trade by shorting it at 92.4 and since then have had to listen to all of the trolls perpetuating the “gold superior” myth that has clearly not been the case since the early summer. I continue to target 70 for the GSR, possibly by New Year’s Day but most probably in Q1/2020. Accordingly, I am overweight silver equities with major positions in Aftermath Silver Ltd. (AAG:TSX.V)(C$0.24) and Goldcliff Resource Corp. (GCN:TSX.V)(C$0.14) while carrying a handful of other primarily gold exploration names as well.
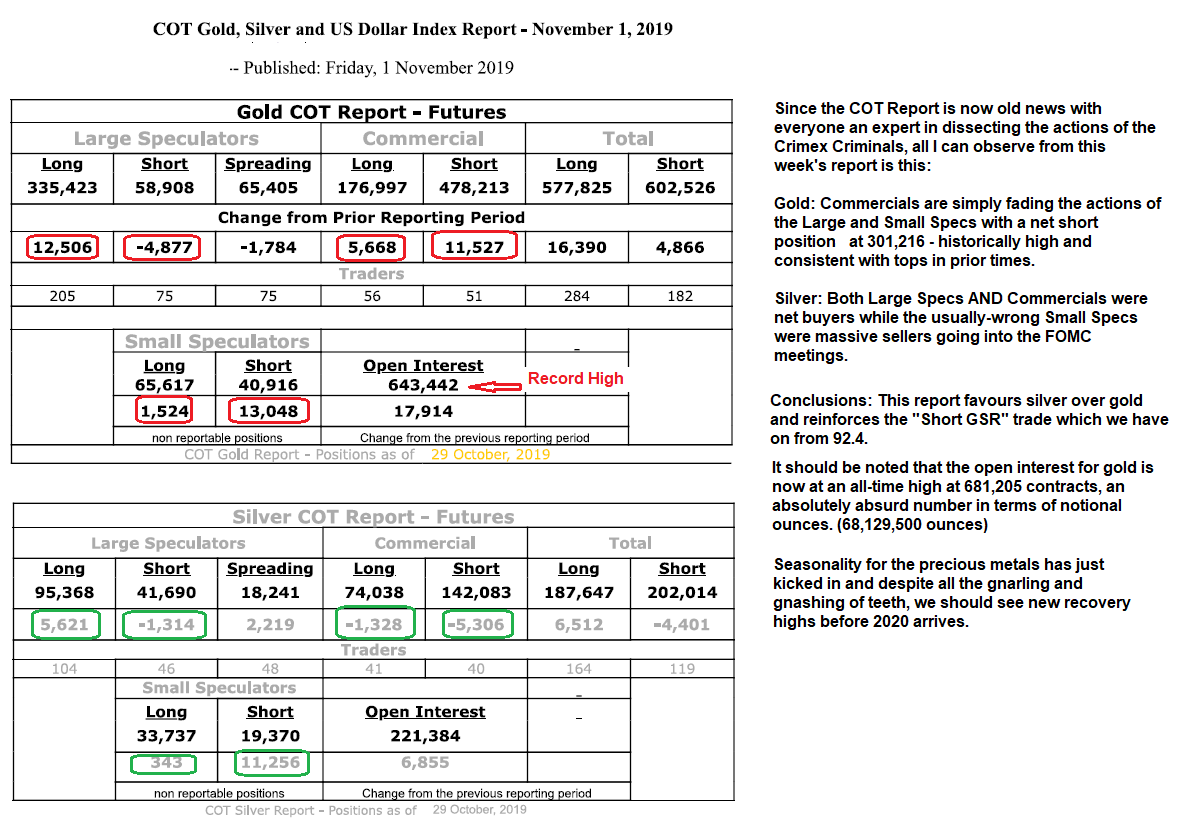
My remarks on the COT Report are found in the graphic shown below. I tweeted out last week how amusing I find it that it has now become a race to the finish as to who sends out their interpretation first. I find it laughable that certain “gold gurus” that had never read a COT report before 2018 are now fashioning themselves as “authorities” but the fact remains that any “system” that gets embraced by the masses is doomed to failure because once everyone follows it, it loses its luster in a big way. Never considered a timing tool for gold and silver, I use it as a risk barometer whereby extreme positions held by Commercials cannot should not be ignored and, more importantly, NEVER discounted. While it is true that 300,000 net gold shorts is a historically big number, it is interesting (and quite bullish) that both Large Specs AND Commercials were net buyers of silver last weekwhich in turn supports the “short GSR” trade and my overweight silver equities holdings.
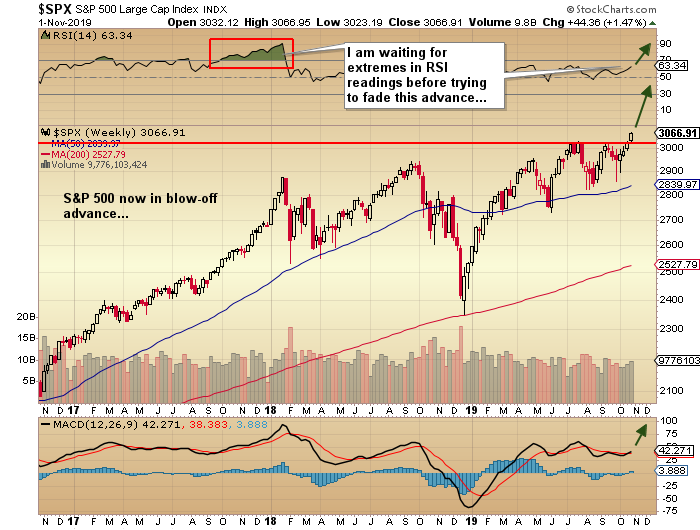
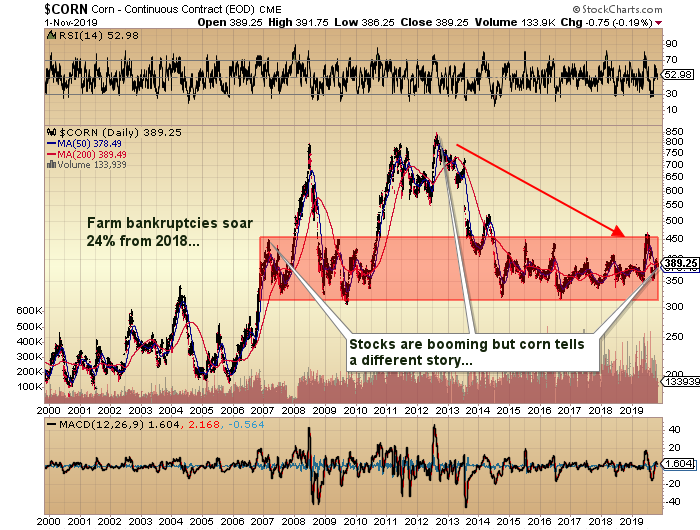
The S&P 500 has finally exploded from its sub-3,000 trading range from most of 2019 and is now clearly and undeniably in the “blow-off” stage as money managers exited the September-October period with FAR too much cash and far too few stocks on their books. The scramble to get “fully-invested” has now become a panic move as year-end bonuses are in danger of being vaporized if benchmarks aren’t met and you just know how important those year-end bonuses will be for campaign contributions and re-election campaigns. Expect a lot of Trump tweets and Kudlow interviews extolling the “GREAT ECONOMY” while cheerleading stocks to yet even greater heights and unfathomable risks. As you have read here countless times before, “One can never underestimate the replacement power of stocks within an inflationary spiral” and if you for one second don’t view $60 billion a month of POMO as “inflationary,” then I have an ice cube stand in Nunavut to sell you. As far as the U.S. economy is concerned, one glance at corn prices provides needed perspective on just how bifurcated wealth has become. Farm bankruptcies have soared 24% this year but you sure don’t read many tweets on THAT subject from the Donald.
It was great to see the email from Aftermath Silver President Ralph Rushton late last week confirming that the company had closed the $0.08 financing after over two months of regulatory wrangling with these remarks: “The Cachinal Project required a NI 43101 technical report which was a long drawn out process with multiple moving parts. Approvals took far longer than we anticipated, with a fair degree of frustration along the way, so naturally we’re extremely happy that we can now focus on marketing and advancing the projects.”
I am going to put together a feature article on Aftermath around mid-month but all one really needs to know is that Cachinal is located in Chile, and if it was not so busy being the world’s premier copper producer, it would probably rank higher than fifth in global silver production. I went through Aftermath’s most recent NI-43101 last evening and am delighted that exploration begins from a solid base of nearly 50 million ounces of silver (indicated and inferred) from both Cachinal and Challacollo. While currently considered a “historical resource,” more drilling and subsequent upgrades will allow for substantial re-rating of the stock and (IMHO) substantial price advance.
In a recent article I demonstrated how in-ground metal values were determined and provided a link to Cipher Research Ltd.’s $40/ounce benchmark for gold. Using the same methodology and applying the current gold-to-silver ratio of 83.47:1, $40/ounce for gold equates to $0.48/ounce for silver. Including the recent $2.5 million and $3 million financings in calculating market cap, there will be approximately 75 million shares o/s (excluding warrants). The implied valuation for the current historical resource should be around C$30 million or C$0.40 per share. From the current price of C$0.24 to C$0.40 implies a 66% lift. Therefore, AAG is both undervalued and beautifully-leveraged to three main drivers: 1. The silver price, 2. Increases in ounces through drilling, and 3. Upgrades in the quality of the resource. All of these three are codependent but very highly probable given the wide-open nature of the two projects and the region.
Needless to say, and in the interest of full disclosure, I own the shares by way of the $0.08 unit announced last week but added it to the GGM portfolio on July 13 at $0.10 per share via my Twitter post. That said, initiating a new position or adding to existing AAG holdings is not a bad idea even at current levels. One last thing: the next private placement to close will cause quite a stir and the key was in Ralph Rushton’s email that said: “Next week, we expect to close the second private placement, which is for $3 million at $0.20 cents with the majority going to a strategic investor.” I wonder just who might that “strategic investor” be?
Originally trained during the inflationary 1970s, Michael Ballanger is a graduate of Saint Louis University where he earned a Bachelor of Science in finance and a Bachelor of Art in marketing before completing post-graduate work at the Wharton School of Finance. With more than 30 years of experience as a junior mining and exploration specialist, as well as a solid background in corporate finance, Ballanger’s adherence to the concept of “Hard Assets” allows him to focus the practice on selecting opportunities in the global resource sector with emphasis on the precious metals exploration and development sector. Ballanger takes great pleasure in visiting mineral properties around the globe in the never-ending hunt for early-stage opportunities.
Disclosure: 1) Michael J. Ballanger: I, or members of my immediate household or family, own securities of the following companies mentioned in this article: Aftermath Silver and Goldcliff. My company has a financial relationship with the following companies referred to in this article: None. I determined which companies would be included in this article based on my research and understanding of the sector. Additional disclosures are below. 2) The following companies mentioned in this article are billboard sponsors of Streetwise Reports: None. Click here for important disclosures about sponsor fees. As of the date of this article, an affiliate of Streetwise Reports has a consulting relationship with Aftermath. Please click here for more information. 3) Statements and opinions expressed are the opinions of the author and not of Streetwise Reports or its officers. The author is wholly responsible for the validity of the statements. The author was not paid by Streetwise Reports for this article. Streetwise Reports was not paid by the author to publish or syndicate this article. Streetwise Reports requires contributing authors to disclose any shareholdings in, or economic relationships with, companies that they write about. Streetwise Reports relies upon the authors to accurately provide this information and Streetwise Reports has no means of verifying its accuracy. 4) This article does not constitute investment advice. Each reader is encouraged to consult with his or her individual financial professional and any action a reader takes as a result of information presented here is his or her own responsibility. By opening this page, each reader accepts and agrees to Streetwise Reports’ terms of use and full legal disclaimer. This article is not a solicitation for investment. Streetwise Reports does not render general or specific investment advice and the information on Streetwise Reports should not be considered a recommendation to buy or sell any security. Streetwise Reports does not endorse or recommend the business, products, services or securities of any company mentioned on Streetwise Reports. 5) From time to time, Streetwise Reports LLC and its directors, officers, employees or members of their families, as well as persons interviewed for articles and interviews on the site, may have a long or short position in securities mentioned. Directors, officers, employees or members of their immediate families are prohibited from making purchases and/or sales of those securities in the open market or otherwise from the time of the interview or the decision to write an article until three business days after the publication of the interview or article. The foregoing prohibition does not apply to articles that in substance only restate previously published company releases. As of the date of this article, officers and/or employees of Streetwise Reports LLC (including members of their household) own securities of Aftermath Silver and Goldcliff Resource, companies mentioned in this article.
Charts provided by the author.
Michael Ballanger Disclaimer: This letter makes no guarantee or warranty on the accuracy or completeness of the data provided. Nothing contained herein is intended or shall be deemed to be investment advice, implied or otherwise. This letter represents my views and replicates trades that I am making but nothing more than that. Always consult your registered advisor to assist you with your investments. I accept no liability for any loss arising from the use of the data contained on this letter. Options and junior mining stocks contain a high level of risk that may result in the loss of part or all invested capital and therefore are suitable for experienced and professional investors and traders only. One should be familiar with the risks involved in junior mining and options trading and we recommend consulting a financial adviser if you feel you do not understand the risks involved.
Charlotte, NC (November 6, 2019) – Seven outstanding students beat out over 100 of their high-school and college peers in making the best case for sound money through an international, gold-backed scholarship competition—and the winners walked away with almost $10,000 in scholarship awards for their exceptional, thought-provoking essays.
For the fourth-straight year, Money Metals Exchange, a national precious-metals dealer that was recently ranked “Best in the USA,” has teamed up with the Sound Money Defense League to offer the first gold-backed scholarship of the modern era.
These groups have set aside 100 ounces of physical gold to reward exemplary students who display a thorough understanding of economics, monetary policy, and sound money.
First place: Emma Worthington, Fort Hays State University Second place: Emily Arguelles, 12th grade, Homeschooled Third place: Spencer Call, University of Utah Fourth place: Marika Sullivan, Macalester College
Graduate Winners:
First place: Kristoffer Hansen, University of Angers Second place: Sydney Bright, University of Portland Third place: Ronald Pan, Azusa Pacific University
Upon the selection of these top seven students, the People’s Choice Award portion of the contest begins. The People’s Choice Award goes to the student whose essay attracts the most page views and interest on social media (shares, likes, retweets, etc., on Facebook and Twitter).
The following blue-ribbon panel of judges selected the finalists:
Jacob Hornberger, Future Freedom Foundation Dr. Karl-Friedrich Israel, Institute for Economic Policy, Leipzig University Andrew Moran, LibertyNation John Tamny, FreedomWorks
Since its creation in 2016, the Sound Money Scholarship has had hundreds of applicants representing more than 250 different high schools, colleges, institutes, and universities across more than 40 states, 5 countries, and 4 continents.
“Students everywhere are waking up to the ongoing and deliberate devaluation of the Federal Reserve Note (today referred to as the ‘dollar’) – an immoral, central-bank policy that punishes savers, wage-earners, and retirees the most,” said Stefan Gleason, president of Money Metals Exchange.
“Our scholarship gives students the opportunity to display their understanding of economics while lessening the burden of the significantly inflated costs associated with attending college,” said Jp Cortez, policy director of the Sound Money Defense League. “This year’s competition resulted in the largest turnout we’ve ever seen, and we expect that trend to continue.”