The wholesale selling prices in Germany fell by 2.3% in October 2019 from the corresponding month of the preceding year. Will the EURUSD decline?
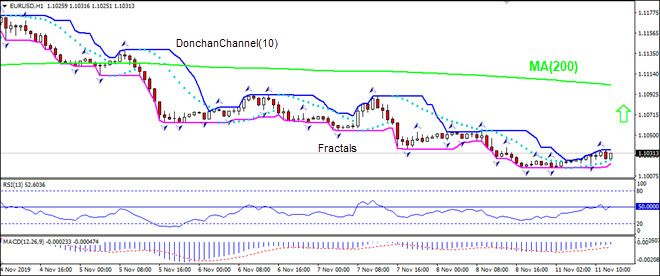
The price chart on 1-hour timeframe shows EURUSD: H1 is in uptrend. The price is rising toward the 200-period moving average MA(200) which is falling. The RSI oscillator is at about 50 level and has not reached the overbought zone.
The US dollar has kicked-off the week in a quiet fashion with the USD index hovering around the 98.10 level as of writing. The index is down slightly off last week’s highs though remains supported on the back of better US data seen last week. All eyes will be on the headline CPI reading due in the middle of this week. A strong result should see USD continue higher while any disappointment could see the correction deepen.
EUR Higher on USD Weakness
EURUSD starts the week in the green as weakness in USD allows the single currency to advance, for now. This week, the domestic data focus will be on a slew of German readings with ZEW Economic Sentiment and preliminary GDP readings due. Given the ongoing concern for the health of the Eurozone economy, any further German data weakness should see EUR lower again. EURUSD trades 1.1024 last.
UK Elections Race Intensifying
GBPUSD is benefiting from USD weakness also with price managing to hold above the 1.2782 level support for now. The latest opinion polls show the Conservative party opening up its lead on Labour heading into the December elections, weighing on GBP for now. This week, the key data focus will be Q3 GDP which holds the potential to confirm a technical recession in the UK if we see further negative reading.
SPX500 Pauses Near Highs
Risk assets have started the week on a softer footing. Trump was active over the weekend denying reports that he had agreed to roll-back on tariffs on Chinese goods in a bid to get a deal done. However, the president did say that talks are going well and that China is ready to make a deal. Traders are expecting the two sides to sign off on a deal at the APEC meetings in Chile this coming weekend. SPX500 trades 3080.43 last, just down off last week’s fresh all-time highs.
JPY & Gold Higher
Safe havens have seen better demand across the European morning on Monday. A combination of a weaker USD and softer equities prices have seen both JPY and gold higher against USD. USDJPY trades 108.96 last, still atop the 108.84 level for now. XAUUSD trades 1465.86 last, remaining within the falling wedge pattern for now after breaking down through the 1481.93 level last week.
Crude Under Pressure
Oil prices have been firmly lower at the start of the week reflecting disappointment in Trump’s confirmation that he has not agreed to roll-back tariffs on Chinese goods. With risk sentiment a little subdued at the start of the week, crude is trading lower at 56.30 though remains above the 55 mark for now.
USDCAC Quiet Amidst Cross-Flows
USDCAD has been a little lower today also, retreating from last week’s highs. For now, it seems that USD weakness is having more of an impact than lower oil prices. However, at around 1.3221, flows remain very quiet so far today.
AUD Holds Above Support
AUDUSD has been a little higher against the US dollar so far on Monday. Trading .6864 last, price is holding above the .6850 level for now following the rejection from the bearish trend line from 2018 highs. Unemployment rate data on Thursday will be the key domestic data focus, expected unchanged at 5.2%.
The pound will receive a welcome boost after Nigel Farage’s Brexit Party will not be pitted against the ruling Conservatives in almost 320 seats in next month’s election, affirms the boss of one of the world’s largest independent financial organizations.
The upbeat message from Nigel Green, founder and CEO of deVere Group comes as the Brexit Party’s leader Nigel Farage will stand aside in all 317 seats won by the Conservatives in the 2017 general election, fighting only seats held by other parties in the December 12 general election.
Mr Green notes: “Nigel Farage has given the Prime Minister a massive boost in the election as he stands down candidates from his Brexit Party.
“In turn, this will give a welcome boost to the Brexit-battered pound, which has consistently been something of a Brexit bellwether.”
He continues: “The move reduces the likelihood of another hung parliament, which would have led to more parliamentary paralysis and more crippling delays on Brexit.
“All of this would have generated yet more, intensified uncertainty – something financial markets loathe. This is why the pound has jumped on the news of the informal Johnson-Farage pact.
“Looking ahead, a Conservative majority would give the government the enhanced ability to move on with the Brexit process.
“Wealth, jobs and opportunity-generating businesses – both in the UK and internationally – have been crying out for certainty. There is the hope a majority government could lift the fog of Brexit that’s been hampering investment and confidence.
“Should a Conservative majority be returned next month, I believe that the pound will reach $1.35.”
Mr Green goes on to add: “The pound will also be given a boost as the agreement is a serious hammer blow for Jeremy Corbyn’s Labour party.
“His anti-business rhetoric, and high tax and low-profit policies would lead to considerable and sustained selling of the pound.”
Last week, the deVere CEO noted: “I believe we can realistically expect a Corbyn government would trigger an exodus of the country’s most successful and wealthiest individuals who contribute significantly both directly and indirectly to the British economy.”
Nigel Green concludes: “Sterling’s outlook will become increasingly bullish over the next few weeks if the Conservatives continue to do well in the polls in the run-up to the election.”
About:
deVere Group is one of the world’s largest independent advisors of specialist global financial solutions to international, local mass affluent, and high-net-worth clients. It has a network of more than 70 offices across the world, over 80,000 clients and $12bn under advisement
EURUSD has reached the downside target. Today, the pair may grow towards 1.1038 and then resume falling to reach 1.1027. After that, the instrument may start a new growth with the first target at 1.1058.
GBPUSD, “Great Britain Pound vs US Dollar”
GBPUSD has completed the ascending impulse; right no, it is correcting to reach 1.2781. Later, the market may resume trading upwards with the first target at 1.2820.
USDCHF, “US Dollar vs Swiss Franc”
USDCHF is trading downwards to reach 0.9933. After that, the instrument may start another growth towards 0.9955 and the form a new descending structure with the first target at 0.9888.
USDJPY, “US Dollar vs Japanese Yen”
USDJPY has finished another descending impulse along with the correction; right now, it is forming the second impulse to reach 108.68. Alter, the market may form one more ascending structure towards 109.06 and then trade downwards with the first target at 108.64.
AUDUSD, “Australian Dollar vs US Dollar”
AUDUSD is forming another correctional wave with the short-term target at 0.6846. After that, the instrument may start a new growth towards 0.6888 and then resume trading downwards to reach 0.6840.
USDRUB, “US Dollar vs Russian Ruble”
USDRUB is consolidating around 63.75. Possibly, today the pair may form one more ascending structure to reach 64.04 and then fall towards 63.81. Later, the market may resume trading upwards with the target at 64.31.
USDCAD, “US Dollar vs Canadian Dollar”
USDCAD has completed the ascending wave at 1.3233; right now, it is consolidating near the highs. Possibly, the pair may expand the range towards 1.3238 and then continue trading downwards with the target at 1.3170, at least.
XAUUSD, “Gold vs US Dollar”
Gold is moving downwards to reach 1454.08. Later, the market may start a new correction towards 1474.44 and then continue falling with the target at 1447.00.
BRENT
Brent is moving downwards. Possibly, today the pair may form the fifth wave of Flag pattern; the target is at 60.60. After that, the instrument may resume trading upwards with the first target at 62.10.
BTCUSD, “Bitcoin vs US Dollar”
BTCUSD is growing towards 9275.00. Later, the market may form a new descending structure to reach 8050.00, thus completing the correction. After that, the instrument may start a new growth towards 9300.00.
Attention! Forecasts presented in this section only reflect the author’s private opinion and should not be considered as guidance for trading. RoboForex LP bears no responsibility for trading results based on trading recommendations described in these analytical reviews.
This current market environment is very reminiscent of the 2006-08 market environment where price rotated into weakness on technicals and continued to establish new all-time price highs in the process – creating what we are calling a “zombie-land melt-up”. This very dangerous price action is indicative of money chasing a falling trend. Where technicals and fundamentals are suggesting that price is actually weakening quite substantial, yet the process of price exploration is continually biased towards the upside as investors continue to pile onto the back of the beast expecting a further melt-up.
Let’s take a look at what happened to the ES and Gold in 2006 and 2007. But, wait before you continue reading make sure to opt-in to our free market trend signals newsletter.
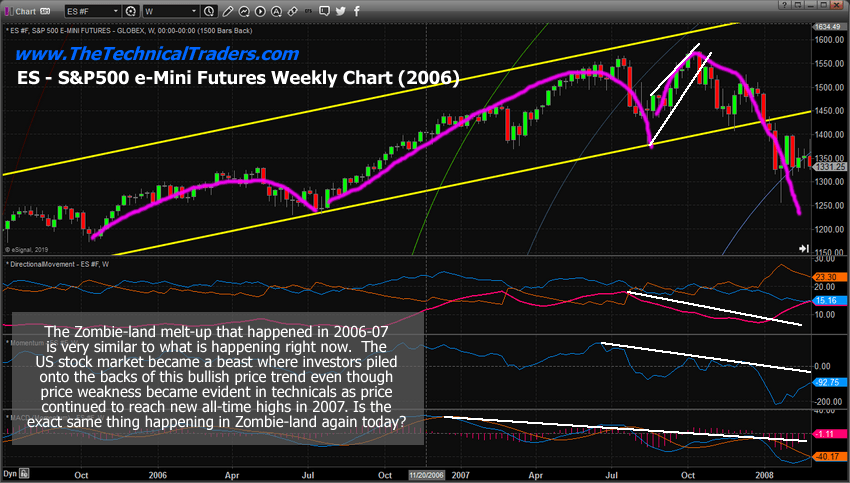
SP500 Weekly Index Chart in 2006-2007
First, we’ll start with the ES (S&P 500 E-mini futures contract). Pay attention to the MAGENTA arcs we’ve drawn on this chart that highlight the continued new highs reached throughout 2006 and 2007. Pay attention to the price rotation and volatility that started to happen near the absolute peak in July and October 2007 – just before the massive price collapse began. Notice how the technical indicators had been suggesting that price was weakening quite extensively since the beginning of 2007 and more aggressively after July 2007. Pay very close attention to the last peak on this chart and how a very deep price correction setup a new price high in a very tight FLAG formation just before the breakdown event.
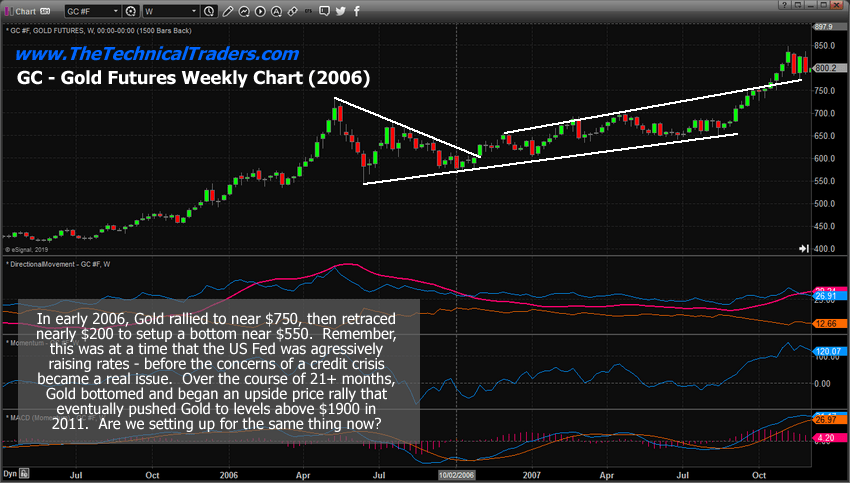
Price Of Gold Weekly Chart in 2006-2007
This Gold chart from the same time period highlights how Gold anticipated the market weakness by rallying up to a level near $750 in May 2016 – then retraced nearly $200 before forming a lengthy price bottom/base. Gold, acting as a safe-haven for investors, rallied almost 94% in the 24 months prior to this peak in 2006. It rallied another 256% (at the ultimate peak) from the low point established in June 2006. The process of this rally was an extended base/bottom in Gold between the base/bottom in 2006 and the renewed uptrend that started just before the end of 2007 (just before the markets started crashing).
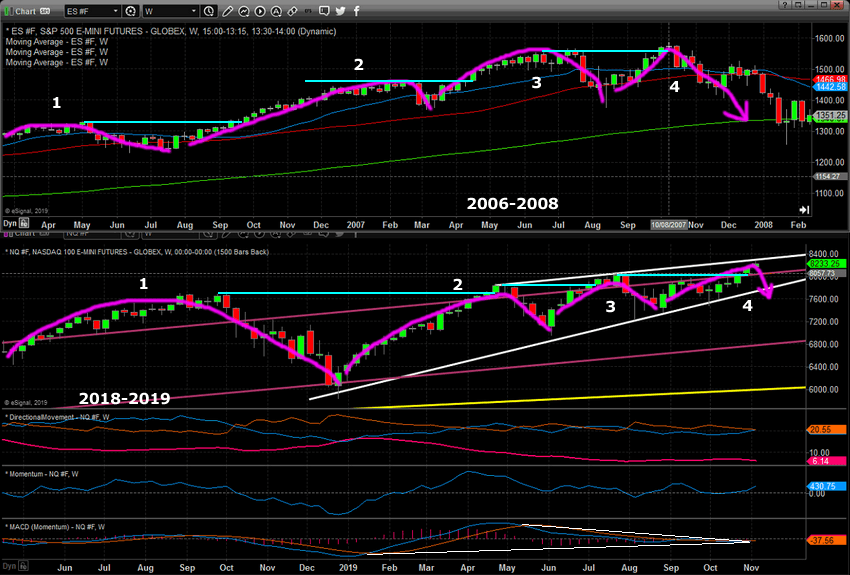
Compare SP500 Index 2006-07 to 2018-19
We believe the current uptrend in the US stock market is acting in a very similar price formation to what we’ve highlighted in the 2006-07 market “zombie-land melt-up”. We believe that investors are piling into the US stock market when price weakness is clearly being illustrated by the technical and fundamental data. We believe a capital shift has continued to pile money into the US stock market as foreign investors pile onto the backs of other investors seeking safety and security within a stronger US economy.
Concluding Thoughts:
We believe the current Zombie-land market is anticipating a price roll-over event (reversion) and that technical and fundamental data supports this analysis. We believe the credit/debt expansion of the past 8+ years has fueled a massive bubble that may result in a deep price correction if given the right circumstances and events. We believe this upside price move in the US markets, which are setting up near the exact same time-frame as the 2008 price collapse, maybe a very stern warning for traders and investors – BE PREPARED.
In Part II of this research post, we’ll highlight the similarities setting up in the current market “Zombie-land” and what happened in 2006~2008. The expansion of the credit market over the past 8+ years has been extensive throughout the globe. The biggest difference this time is that risk may come from foreign markets vs. from within the US.
Keep reading our research because our proprietary tools have been nailing all of these price targets and move many months in advance.
I urge you visit my ETF Wealth Building Newsletter and if you like what I offer, join me with the 1-year subscription to lock in the lowest rate possible and ride my coattails as I navigate these financial market and build wealth while others lose nearly everything they own during the next financial crisis. Join Now and Get a Free 1oz Silver Bar!
As a technical analysis and trader since 1997, I have been through a few bull/bear market cycles. I believe I have a good pulse on the market and timing key turning points for both short-term swing trading and long-term investment capital. The opportunities are massive/life-changing if handled properly.
As we can see in the daily chart, after finally breaking the sideways channel to the downside and retesting 61.8% fibo, the pair has updated the low. The next downside targets are 76.0% fibo at 1438.05 and the fractal low at 1400.49. The descending MACD indicator confirms further decline.
In the H1 chart, there is a convergence on MACD, which may indicate a short-term pullback. the targets of this possible correction may be 23.6%, 38.2%, and 50.0% fibo at 1470.28, 1479.00, and 1486.08 respectively.
USDCHF, “US Dollar vs Swiss Franc”
As we can see in the daily chart, after failing to break the fractal low, the pair started another ascending impulse, which has already broken the local high. In this case, USDCHF is expected to grow towards the high at 1.0028, break it, and then continue trading upwards to reach long-term 76.0% fibo at 1.0098. However, if the market fails to break the high, the instrument may resume moving to the downside and reach 61.8% and 76.0% fibo at 0.9800 and 0.9748 respectively.
In the H1 chart, there is a divergence on MACD, which may indicate a possible pullback. The downside correctional targets may be 23.6%, 38.2%, and 50.0% fibo at 0.9949, 0.9929, and 0.9914 respectively. The resistance is the high at 0.9979.
Attention! Forecasts presented in this section only reflect the author’s private opinion and should not be considered as guidance for trading. RoboForex LP bears no responsibility for trading results based on trading recommendations described in these analytical reviews.
President Trump tweeted on Friday that the United States did not agree on rolling back the tariffs on China.
The tweet rebuffed claims made by China earlier last week.
The positive news from the trade talks pushed equities to new highs. Traders ignored the tweet as Trump said that the talks were progressing smoothly. Despite a brief pullback, the markets settled higher by Friday’s close.
Germany Trade Surplus Rises Modestly in September
The trade balance figures from Germany saw the surplus rising to 19.2 billion euros for the month of September. The gains came as exports grew faster than expected including an increase in imports.
German exports rose 1.5% on the month, reversing the 0.9% decline in August. Imports were up 1.3% in September from 0.1% in August.
EURUSD on Track to Test Support
The currency pair maintained the bearish momentum. Price action is on track to post declines that will test the price level of 1.0005. Establishing support at this level which previously served as resistance could stall declines in the near term. As long as the support holds, the EURUSD will likely maintain a sideways range above the support area.
Sterling Continues to Slip on BoE Decision
The pound sterling continued to post declines into Friday’s close. This came as the Bank of England left interest rates unchanged. But, interestingly, there were two dissenting votes in favor of rising rates.
Many believe that the BoE could raise rates if the Brexit uncertainty eases. The UK will be heading to polls in just under a month’s time.
GBPUSD Could Extend Declines Further
The cable could push lower in the coming weeks. This comes after the BoE meeting managed to push the GBPUSD out of the range.
The downside breakout also confirms the topping pattern above 1.2865. The declines could now see the GBPUSD falling to levels near 1.2582 eventually.
Gold Ends Week on Bearish Note
The precious metal saw strong losses last week. The declines came even after Trump’s tweet which saw a moderation to the trade talk euphoria.
Gold prices now erase the gains made from the previous three weeks. The declines could continue into the near term. But the move is widely expected as gold prices stutter in their rally.
XAUUSD Breaks Below Support
The breakdown below the 1462 handle could mean that the precious metal will slip further. However, the Stochastics oscillator is currently posting a bullish divergence.
If we get to see an upside rebound, then XAUUSD will be correcting modestly higher. The price level near 1483.60 will be critical in the near term for XAUUSD to establish resistance.
Last week, the US dollar strengthened significantly against a basket of world currencies. The dollar index (#DX) closed in the green zone. At the moment, the greenback is moving away from local highs. The US currency is under pressure due to statements by US President Donald Trump that he does not intend to cancel tariffs for China so far. It should be recalled that according to reports by Chinese and American officials, the parties agreed on the mutual cancellation of the earlier imposed tariffs. However, after the statements by US President, it is not clear whether the parties can agree and conclude an agreement. According to Trump, no final decision has been made. Tomorrow, the President of the United States will speak at the Economic Club of New York and is likely to put a little more clarity.
Investors will also follow important economic data from the UK and the US this week. On Wednesday and Thursday, November 13-14, Fed Chairman Powell will speak. Financial market participants expect the head of the Fed to announce once again that no further monetary easing is planned.
The “black gold” prices are declining. At the moment, futures for the WTI crude oil are testing the $56.50 mark per barrel.
Market Indicators
On Friday, there was the bullish sentiment in the US stock markets: #SPY (+0.25%), #DIA (+0.01%), #QQQ (+0.40%).
The 10-year US government bonds yield has updated local highs. At the moment, the indicator is at the level of 1.93-1.94%.
The Economic News Feed for 11.11.2019:
– GDP data in the UK at 11:30 (GMT+2:00);
– Manufacturing production in the UK at 11:30 (GMT+2:00).
Early in another November week, the oil market is going down againб but it is evident that investors just can’t decide on a more promising direction on a global scale. Currently, Brent is trading at 61.81 USD.
The statistics published by Baker Hughes last Friday showed that the Oil Rig Count in the USA reached the lowest level over the previous 31 months: the indicator lost 8 units and now equals to 684. The total number of rigs lost 7 units, down to 817 overall. As a result, the actual reading is close to April of 2017. Since the beginning of 2019, the indicator has dropped 23%, but without influencing the total oil extraction as it has added 8% over the same period.
The latest numbers showed that the daily oil output in the USA stopped at 12.6M. The EIA Crude Oil Stocks Change is increasing (+8M barrels over a week by November 8th).
All fine and dandy, and the reason for oil stocks growth can be easily explained by seasonality, but market players are anxious as they continue following the trade conflict between the USA and China. Earlier, US President Donald Trump said that he wasn’t ready yet to consider the possibility of completely removing import tariffs on Chinese goods introduced in the past.
As we can see in the H4 chart, Brent is forming the fifth structure of Flag correctional pattern. Today, the pair may fall to break 61.83 and then continue trading downwards with the target at 60.60 to complete the correction. After that, the instrument may form a reversal pattern for one more ascending structure towards 64.40. However, the “correction” scenario may no longer be valid if the price grows to break 63.00. in this case, the market may resume trading inside the uptrend to reach 64.40б at least. From the technical point of view, this scenario is confirmed by MACD Oscillator: its signal line is moving downwards to reach 0. Breaking it may boost the downtrend.
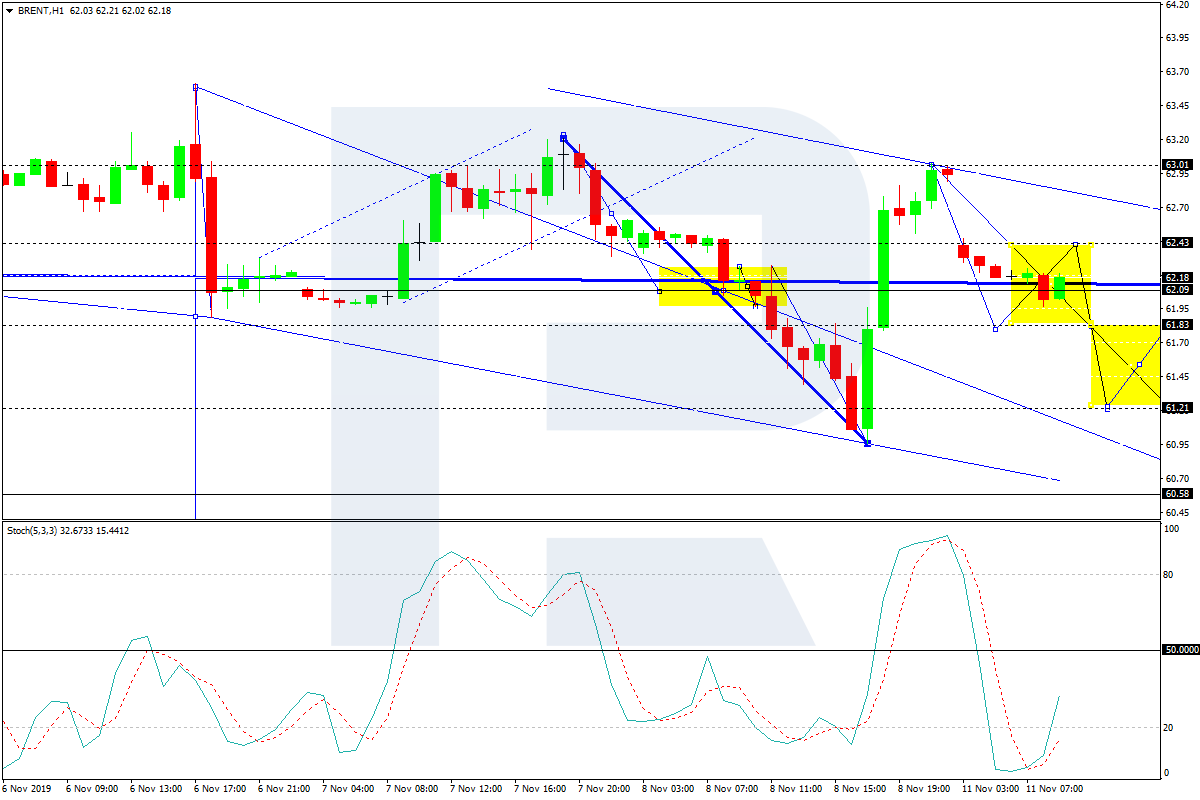
In the H1 chart, Brent is consolidating around 62.10. Possibly, today the pair may form a new descending structure towards 61.83 and then start another growth to reach 62.43. After that, the instrument may fall to reach 61.21, thus forming a wider consolidation range between 62.43 and 61.21. If later the pair breaks this range to the downside, the instrument may continue falling towards 60.60; if to the upside – cancel the correction. From the technical point of view, this scenario is confirmed by Stochastic Oscillator: its signal line is moving below 50. Practically, the indicator suggests that the instrument is moving in the middle of the fifth correctional structure. The indicator is expected to start another decline to enter the “oversold area” below 20.
Disclaimer
Any predictions contained herein are based on the authors’ particular opinion. This analysis shall not be treated as trading advice. RoboForex shall not be held liable for the results of the trades arising from relying upon trading recommendations and reviews contained herein.
Last week, the USD has grown significantly against its main competitors. The drop of EUR/USD quotes exceeded 150 points. At the moment, the trading instrument has stabilized. The local support and resistance levels are 1.10150 and 1.10400, respectively. Concerns over the conclusion of a trade deal between the US and China have resumed. On Friday, US President Donald Trump said he did not agree to abolish duties on Chinese imports. We recommend that you keep track of current information on this issue. In the near future, technical correction of the EUR/USD currency pair is not ruled out. Open positions from key levels.
The Economic News Feed for 11.11.2019 is calm.
Indicators signal the power of sellers: the price has fixed below 50 MA and 100 MA.
The MACD histogram is in the negative zone, but above the signal line, which gives a weak signal to sell EUR/USD.
The Stochastic Oscillator is in the overbought zone, the %K line crossed the %D line. There are no signals at the moment.
Trading recommendations
Support levels: 1.10150, 1.10000, 1.09600
Resistance levels: 1.10400, 1.10600, 1.10900
If the price consolidates below 1.10150, expect the quotes to fall toward 1.09800-1.09700.
Alternatively, the quotes could correct toward 1.10600-1.10800.
The GBP/USD currency pair
Technical indicators of the currency pair:
Prev Open: 1.28130
Open: 1.27937
% chg. over the last day: -0.33
Day’s range: 1.27841 – 1.28096
52 wk range: 1.1959 – 1.3385
The GBP/USD currency pair stabilized after a significant drop last week. At the moment, a unidirectional trend is not observed. Investors expect additional drivers. The key support and resistance levels are: 1.27700 and 1.28200, respectively. We recommend keeping track of up-to-date information regarding the Brexit process. This week a series of important statistics on the UK economy will be published, which may have a significant impact on the dynamics of the pound. Positions must be opened from key levels.
The Economic News Feed for 11.11.2019:
– GDP Report (UK) – 11:30 (GMT+2:00);
– Manufacturing Production Volume (UK) – 11:30 (GMT+2:00);
Indicators do not give accurate signals. The price approached 50 MA, which at the moment is a strong dynamic resistance.
The MACD histogram is in the negative zone, but above the signal line, which gives a weak signal to sell GBP/USD.
The Stochastic Oscillator is located near the overbought zone, the %K line is above the %D line, which indicates bullish sentiment.
Trading recommendations
Support levels: 1.27700, 1.27500
Resistance levels: 1.28200, 1.28600, 1.28900
If the price consolidates below 1.27700, expect a further drop toward 1.27500-1.27300.
Alternatively, the quotes could grow toward 1.28500-1.28700
The USD/CAD currency pair
Technical indicators of the currency pair:
Prev Open: 1.31734
Open: 1.32184
% chg. over the last day: +0.44
Day’s range: 1.32181 – 1.32343
52 wk range: 1.2727 – 1.3664
A bullish sentiment prevails on the USD/CAD currency pair. The trading instrument has set new local highs. Looney is currently consolidating. Investors expect additional drivers. The local support and resistance levels are 1.32100 and 1.32350, respectively. USD/CAD can grow further. Pay attention to the dynamics of oil quotes. Open positions from key levels.
The Economic News Feed for 11.11.2019 is calm.
The price fixed above 50 MA and 100 MA, which signals the strength of buyers.
The MACD histogram is in the positive zone but below the signal line, which gives a weak signal to buy USD/CAD.
The Stochastic Oscillator is in the neutral zone, the %K line is below the %D line, which points to a bearish sentiment.
Trading recommendations
Support levels: 1.32100, 1.31900, 1.31600
Resistance levels: 1.32350, 1.32600, 1.32800
If the price consolidates above 1.32350, expect further growth toward 1.32600-1.32800.
Alternatively, the quotes could descend toward 1.31900-1.31600.
The USD/JPY currency pair
Technical indicators of the currency pair:
Prev Open: 109.277
Open: 109.195
% chg. over the last day: -0.03
Day’s range: 108.915 – 109.254
52 wk range: 104.97 – 114.56
The USD/JPY currency pair went down. The trading tool has updated local lows. Uncertainty regarding the settlement of the trade conflict between Washington and Beijing has resumed again, which has caused an increase in demand for the safe haven currencies. At the moment, USD / JPY quotes are consolidating in the range of 108.850-109.150. The yen has the potential for further growth against the US dollar. We recommend paying attention to the dynamics of oil quotes. Positions must be opened from key levels.
The Economic News Feed for 11.11.2019 is calm.
Indicators do not give accurate signals, the price crossed 50 MA and 100 MA.
The MACD histogram has moved into the negative zone, which points to a bearish sentiment.
The Stochastic Oscillator is in the oversold zone, the %K line crossed the %D line. There are no signals at the moment.
Trading recommendations
Support levels: 108.850, 108.650, 108.500
Resistance levels: 109.150, 109.450, 109.700
If the price consolidates below 108.850, expect the quotes to fall toward 108.650-108.500.
Alternatively, the quotes could grow toward 109.400-109.600.