Market Optimism Keeps Gold Under Pressure

By Dmitriy Gurkovskiy, Chief Analyst at RoboForex

Early in a new November week, Gold is consolidating at 1465.60. Market players are on standby: there won’t be any serious dynamics in the instrument until media reports some more or less interesting news on the US-China trade agreement.

Gold, an excellent tool for hedging risks, is still under pressure due to market optimism and confidence that the deal will be reached sooner or later. After all, both parties need it. Mitigation of trading risks will surely reduce investors’ interest in Gold, which is usually considered a more reliable and stable asset.

However, it’s obvious that there are a lot of issues and problems in the negotiations. For example, the parties still haven’t arrived at a consensus on the transfer of intellectual property and technological solution rights. Another question that remains open is that China hasn’t yet decided on the amount of agricultural commodities to be bought from the USA. The latter, by the way, has only one tool left, import tariffs, and from time to time makes Chinese officials nervous with its aggressive rhetoric.

Still, Gold will remain in the range between 1455.00 and 1495.00 as long as market players have at least one chance that the parties may reach ed a deal.

Stay tuned to the RoboForex Analysis & Forecasts page for exclusive financial forecasts and professional expert analysis.

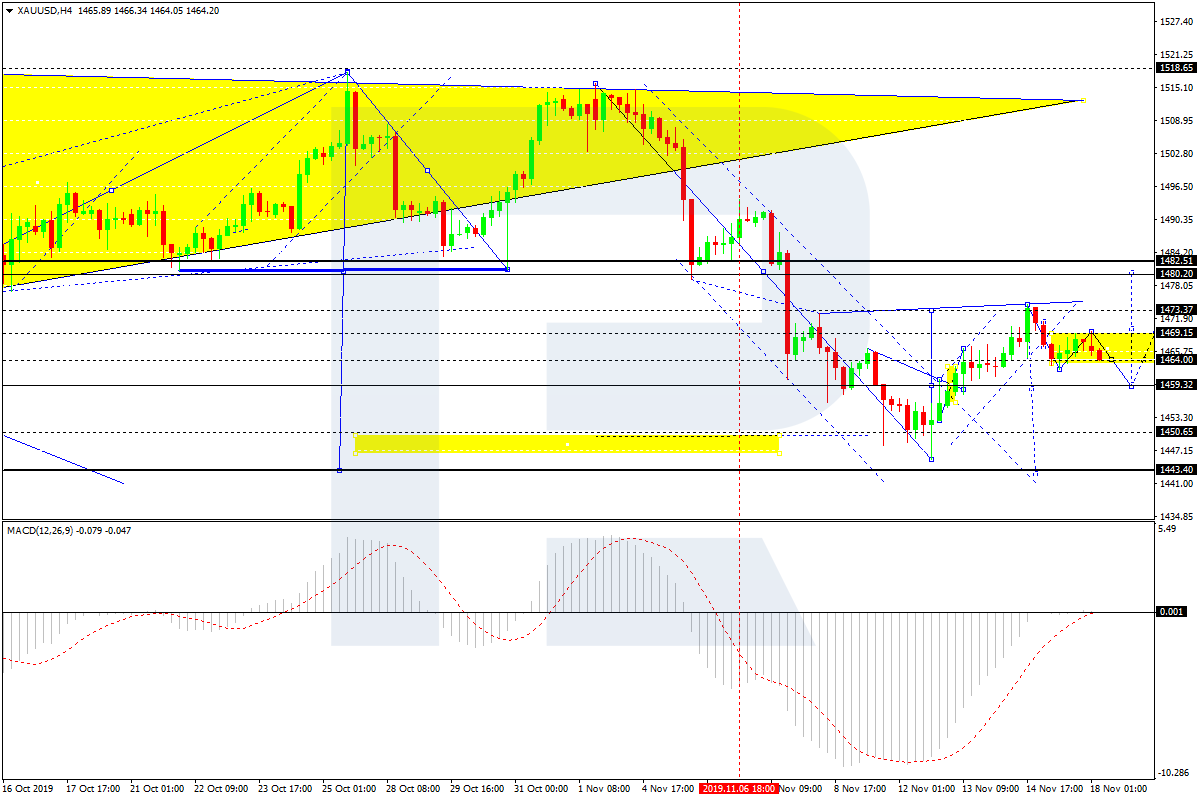
As we can see in the H4 chart, XAU/USD has finished the first rising impulse towards 1473.30; right now, it is trading to break the consolidation range to the downside. After breaking 1464.00 downwards, the instrument may continue the descending correction with the target at 1459.30. After completing the correction, the pair may form one more ascending structure towards 1480.50 and then start a new decline to reach 1440.50. From the technical point of view, this scenario is confirmed by MACD Oscillator: its signal line is moving sideways below 0, thus confirming a consolidation range in the price chart.

In the H1 chart, XAU/USD is consolidating above 1464.00; right now, it is trading to break it to the downside. After breaking the downside border, the price may continue falling to reach 1459.30. From the technical point of view, this scenario is confirmed by Stochastic Oscillator: its signal line has already broken 50 to the downside. At the moment, the indicator continues falling towards 20. Later, the instrument may complete this descending wave and the line is expected to reverse upwards.

Disclaimer

Any predictions contained herein are based on the authors’ particular opinion. This analysis shall not be treated as trading advice. RoboForex shall not be held liable for the results of the trades arising from relying upon trading recommendations and reviews contained herein.


VIX Warns Of Imminent Market Correction

By TheTechnicalTraders.com

The VIX is warning that a market peak may be setting up in the global markets and that investors should be cautious of the extremely low price in the VIX.  These extremely low prices in the VIX are typically followed by some type of increased volatility in the markets.

The US Federal Reserve continues to push an easy money policy and has recently begun acquiring more dept allowing a deeper move towards a Quantitative Easing stance.  This move, along with investor confidence in the US markets, has prompted early warning signs that the market has reached near extreme levels/peaks. You can get all of my trade ideas by opting into my free market trend signals newsletter.

Vix Value Drops Before Monthly Expiration

When the VIX falls to levels below 12~13, this typically very low level is usually associated with an extreme peak in price.  Throughout history, after the VIX has collapsed to these types of low price levels, the markets have a tendency to revert/correct in ranges that are typically in excess of 3.5% to 5.5%. In some cases, these corrections have been as large as 11% to 18% or more.

Current Continous VIX Price Chart

The current VIX level, near 12, is near the lowest historical levels of the past 12 months.  Every time the VIX has fallen to near these levels, a peak in price has set up within just a few days potentially.  Each time this setup has occurred, the price has rotated/corrected downward by at least 5.5%.  Is that about to happen again in the US markets?

Custom Market Cap Index

Our custom Market Cap Index is also suggesting a market peak has setup and that price may likely revert to lower levels. Historically, when the price reaches these extreme price ranges, a rotation/reversion price event takes place.  We believe a price reversion may be setting up in the US/Global markets that traders may not be prepared for.  The current rally in the US stock market suggests a broader market rotation may take place.  This suggests a deeper reversion event may be setting up.

Last week I talked about the 3-year record high outflows in the GLD gold bullion ETF and how it’s warning us that investors are not fearful of falling stock prices. This along with the vix, and our custom index paint a clear contrarian signal that a top is near!

Concluding Thoughts:

As we near the end of 2019, the current bullish price trend may come to a dramatic end as the VIX charts and our custom Index charts suggest the US/Global markets may have reached levels that support a price rotation/reversion event may be setting up.  Traders need to be prepared for the risks associated with such an event and plan for extended risks.

If you find this type of analysis interesting be sure to video my website to learn more about how you take full advantage of this analysis every week at www.TheTechnicalTraders.com

Chris Vermeulen TheTechnicalTraders.com


Record Gold ETF Outflow

By TheTechnicalTraders.com

If you want to earn 34%-50% a year return on your trading account with very few ETF trades then join me at the Wealth Building Newsletter today!

Chris Vermeulen

TheTechnicalTraders.com


Forex Technical Analysis & Forecast 18.11.2019 (EURUSD, GBPUSD, USDCHF, USDJPY, AUDUSD, USDRUB, USDCAD, GOLD, BRENT, BTCUSD)

Article By RoboForex.com

EURUSD, “Euro vs US Dollar”

EURUSD has reached the target at 1.1055; right now, it is moving upwards. Possible, the pair may reach 1.1068. Later, the market may start a new correction towards 1.1030 and then form one more ascending structure with the target at 1.1074.

EURUSD
Risk Warning: the result of previous trading operations do not guarantee the same results in the future

GBPUSD, “Great Britain Pound vs US Dollar”

GBPUSD is moving upwards. Possibly, the pair may reach 1.2948 and then form a new descending structure with the target at 1.2864.

GBPUSD
Risk Warning: the result of previous trading operations do not guarantee the same results in the future

USDCHF, “US Dollar vs Swiss Franc”

USDCHF is consolidating around 0.9893. If later the price breaks this range to the downside at 0.9886, the market may resume moving downwards to reach 0.9862; if to the upside at 0.9902 – start a new growth with the target at 0.9920.

USDCHF
Risk Warning: the result of previous trading operations do not guarantee the same results in the future

USDJPY, “US Dollar vs Japanese Yen”

After forming the consolidation range around 108.68, USDJPY has broken it upwards. Possible, the pair may grow to reach 109.14 and then form a new descending structure towards 108.28. After that, the instrument may break this level to the downside and then continue trading downwards with the short-term target at 106.60.

USDJPY
Risk Warning: the result of previous trading operations do not guarantee the same results in the future

AUDUSD, “Australian Dollar vs US Dollar”

AUDUSD is consolidating above 0.6810. Possibly, today the pair may form one more ascending structure with the short-term target at 0.6826. After that, the instrument may start a new decline towards 0.6804 and then resume growing to reach 0.6844.

AUDUSD
Risk Warning: the result of previous trading operations do not guarantee the same results in the future

USDRUB, “US Dollar vs Russian Ruble”

USDRUB is consolidating around 63.86. Today, the pair may break the channel upwards to reach the target at 64.14. Later, the market may resume trading downwards to reach 63.95 and then form one more ascending structure with the target at 64.54.

USDRUB
Risk Warning: the result of previous trading operations do not guarantee the same results in the future

USDCAD, “US Dollar vs Canadian Dollar”

USDCAD is moving downwards to reach 1.3213. After that, the instrument may start a new growth towards 1.3225 and then resume falling with the short-term target at 1.3199.

USDCAD
Risk Warning: the result of previous trading operations do not guarantee the same results in the future

XAUUSD, “Gold vs US Dollar”

Gold is consolidating above 1464.00. If later the pair breaks this level to the downside, the price may fall to break 1459.00 and then continue trading downwards with the target at 1450.60. However, if the market breaks 1469.30 to the upside, the instrument may continue the correction to reach 1480.50.

GOLD
Risk Warning: the result of previous trading operations do not guarantee the same results in the future

BRENT

After breaking 62.82 and reaching 63.80, Brent is falling back to 62.82. Later, the market may grow to break 63.80 to the upside and then continue trading inside the uptrend with the target 64.30.

BRENT
Risk Warning: the result of previous trading operations do not guarantee the same results in the future

BTCUSD, “Bitcoin vs US Dollar”

BTCUSD continues consolidating above 8425.00. Possibly, today the pair may fall to reach 8245.00 and then start another growth to return to 8425.00. Later, the market may resume falling with the target at 8050.00.

BITCOIN

Article By RoboForex.com

Attention!
Forecasts presented in this section only reflect the author’s private opinion and should not be considered as guidance for trading. RoboForex LP bears no responsibility for trading results based on trading recommendations described in these analytical reviews.

What happens To The Global Economy If Oil Collapses Below $40 – Part II

By TheTechnicalTraders.com

In the first part of this research article, we shared our ADL predictive modeling research from July 10th, 2019 where we suggested that Oil prices would begin to collapse to levels near, or below, $40 throughout November and December of 2019.  Our ADL modeling system suggests that oil prices may continue lower well into early 2020 where the price is expected to target $25 to $30 in February~April 2020.

We believe this type of global commodity price collapse, essentially collapse in oil revenues for many global nations could present a very real crisis in our future.  Most of the oil-producing nations rely on stable oil prices to supply much-needed revenues/income to support current and future operations and essential services. If oil prices collapse to levels below $40, this decrease would represent a -40%, or more, collapse in oil revenues for these nations.  If oil prices fall to levels below $30, this would represent a -55%, or more, decrease in expected revenues.

You can get my daily market analysis articles and trade ideas by opting into my free market trend signals newsletter.

We believe the ADL predictive modeling systems results, if accurate, represents a very real potential that the global capital markets and stock market may experience a major crisis event before the end of 2020.  This type of commodity collapse happened once before in history – nearly 10 years before the 1929 US stock market collapse and the slide in commodity prices continued in 1930 and beyond as an extended economic contraction pushed the US into an economic depression.

Producer Price Index for All Commodities from 1914 to 1933

Take a look at these charts for comparison.  The first is a chart of the Producer Price Index for All Commodities from 1914 to 1933. Pay close attention to how commodity prices collapsed in 1921, approximately 9 to 10 years before the US stock market peak (1929) and commodities continue to slide lower.  This collapse in commodity prices relates to the consumer, agriculture, and industrial demand after WWI and setup a shift within the capital markets more focused on stock market speculation. The period between 1923 and 1929 resulted in a complete shift in the capital markets where farms, agriculture, and manufacturing levels decreased while urban areas, cities, and the stock market flourished – until it ended in 1929. (Source: https://eh.net/encyclopedia)

Monthly Crude Oil chart

Now, take a look at this Monthly Crude Oil chart which highlights very similar types of price patterns over the span of about 10 years.  This strangely similar chart, in combination with the strangely similar set of circumstances related to farm, agriculture, and manufacturing as well as the shift of capital towards speculation in the US/Global stock market may be setting up another type of 1929 stock market peak event.

Assets in Money Market Accounts

The shift in the capital markets is very clearly seen in the following chart – the Assets in Money Market Accounts chart.  One can clearly see that after the credit crisis in 2008-09, investors were not willing to participate in the Money Markets at levels prior to 2008.  In fact, for the entire period of 2009 through 2017, global investors stayed away from Money Markets and only recently began pouring capital back into the markets near late 2017 – when confidence increased.

Yet, this chart also shows a very clear “shift” in capital engagement which is very similar to what happened in the late 1920s.  At a time when manufacturing, agriculture and farm foreclosures were haunting the markets, investors poured capital in the stock market and speculative investments because these instruments were ripe with opportunity. The rally in the US stock market in the late 1920s became an opportunity that no one could resist.  Is the same thing happening right now in the US stock market?  Has a capital shift taken place that has global investors bumbling their way into the US stock market while trying to avoid/ignore obvious risks in local markets, manufacturing, and the global economy?

We believe the evidence is very clear for any investor willing to pull off the “bubble goggles” and take a good hard look at where we really are in the economic cycle.  Unless something dramatic changes in relation to global economic growth, credit market expectations and consumer economic participation, it seems obvious that we are inching our way towards a global stock market peak just like we did in 1929.

Even if a trade deal between the US and China were to happen today and eliminate all trade tariffs, would this change anything or would this simply pour fuel onto the “capital shift” fire that is already taking place with speculation reaching frothy levels?

Skilled technical traders should pay very close attention to Oil Prices and global economic factors while this “zombie-land melt-up” continues.  We believe this is not a healthy rally in the US stock market currently and is more similar to what happened in the last 1920s than anything we’ve seen over the past 80+ years.

In Part III of this research article, we’ll highlight some of the recent economic news that helps to further identify the complexity that makes up the current global stock market  “zombie-land”.

If you want to earn 34%-50% a year return on your trading account with very few ETF trades then join me at the Wealth Building Newsletter today!

Chris Vermeulen – TheTechnicalTraders.com


Fibonacci Retracements Analysis 18.11.2019 (GOLD, USDCHF)

Article By RoboForex.com

XAUUSD, “Gold vs US Dollar”

As we can see in the H4 chart, XAUUSD is correcting after completing the descending wave; right now, it is testing the area between 50.0% and 61.8% fibo. The next downside target may be 76.0% fibo at 1438.05 and the fractal low at 1400.49. The descending MACD indicator confirms further decline.

GOLD_H4
Risk Warning: the result of previous trading operations do not guarantee the same results in the future

The H1 chart shows more detailed structure of the current correction after the convergence on MACD. By now, the correctional uptrend has already reached 38.2% fibo and may yet continue towards 50.0% and 61.8% fibo at 1480.80 and 1489.10 respectively. However, if the price breaks the low at 1445.60, the instrument may resume trading inside the downtrend.

GOLD_H1
Risk Warning: the result of previous trading operations do not guarantee the same results in the future

USDCHF, “US Dollar vs Swiss Franc”

As we can see in the H4 chart, USDCHF is still correcting between 23.6% and 50.0% fibo; right now, it is testing 38.2% fibo. Considering the current descending impulse, the main scenario implies further decline towards 61.8% fibo at 0.9801.

USDCHF_H4
Risk Warning: the result of previous trading operations do not guarantee the same results in the future

In the H1 chart, the pair is correcting after the convergence on MACD and has almost reached 38.2% fibo at 0.9912. The next upside target may be 50.0% fibo at 0.9924. The support is the low at 0.9870.

USDCHF_H1

Article By RoboForex.com

Attention!
Forecasts presented in this section only reflect the author’s private opinion and should not be considered as guidance for trading. RoboForex LP bears no responsibility for trading results based on trading recommendations described in these analytical reviews.

The US Dollar Is Declining. Investors Assess the Situation Concerning US-China Trade Negotiations

by JustForex

Last week, the US dollar closed with a decline against a basket of currency majors. The dollar index (#DX) moved away from local highs and closed in the red zone. The US has published some ambiguous economic releases. At the same time, Fed Chairman Jerome Powell said the US economy was stable and the official did not see a risk of recession. In the near future, the regulator plans to keep interest rates at current levels. Financial market participants continue to monitor the settlement of the trade conflict between Washington and Beijing.

White House economic adviser, Larry Kudlow, said China and the US were approaching an end to their trade war, which has been going on for 16 months. On Sunday, Xinhua, China’s news agency, reported that the parties had “constructive talks” via the phone, but they didn’t give any information about it.

The “black gold” prices have been growing. Currently, futures for the WTI crude oil are testing the $57.80 mark per barrel.

Market Indicators

On Friday, there was the bullish sentiment in the US stock markets: #SPY (+0.72%), #DIA (+0.61%), #QQQ (+0.73%).

The 10-year US government bonds yield has not changed. At the moment, the indicator is at the level of 1.84-1.85%.

The Economic News Feed for 18.11.2019:
  • Today, the publication of important economic news is not expected.

by JustForex

The Analytical Overview of the Main Currency Pairs on 2019.11.18

by JustForex

The EUR/USD currency pair

Technical indicators of the currency pair:
  • Prev Open: 1.10209
  • Open: 1.10527
  • % chg. over the last day: +0.26
  • Day’s range: 1.10484 – 1.10646
  • 52 wk range: 1.0884 – 1.1623

EUR/USD currency pair is in a bullish sentiment. The trading instrument has set new local highs. EUR/USD quotes found resistance at the level of 1.10650. 1.10400 is already a mirror support. Sentiment in the financial markets has improved amid optimistic news on the settlement of the trade conflict between Washington and Beijing. White House spokesman Larry Kudlow said the parties are close to making a deal. We recommend that you keep track of current information on this issue. EUR/USD can grow further. You should open positions from key levels.

The Economic News Feed for 18.11.2019 is calm.

EUR/USD

The price fixed above 50 MA and 100 MA, which signals the strength of buyers.

The MACD histogram is in the positive zone and continues to rise, indicating a further recovery of the EUR/USD currency pair.

Stochastic Oscillator has started to leave the overbought zone, the %K line is below the %D line, which indicates a bearish sentiment.

Trading recommendations
  • Support levels: 1.10400, 1.10150, 1.09900
  • Resistance levels: 1.10650, 1.10900, 1.11000

If the price consolidates above 1.10650, expect further correction to the round level of 1.11000.

Alternatively, the quotes could drop toward 1.10250-1.10000.

The GBP/USD currency pair

Technical indicators of the currency pair:
  • Prev Open: 1.28809
  • Open: 1.29214
  • % chg. over the last day: +0.14
  • Day’s range: 1.29095 – 1.29516
  • 52 wk range: 1.1959 – 1.3385

The GBP/USD currency pair is showing aggressive purchases. Sterling updated key extremes. At the moment, GBP/USD quotes are testing the resistance level of 1.29500. Mark 1.29150 is already a mirror support. A trading instrument has the potential for further growth. We recommend keeping track of up-to-date information regarding the Brexit process. Open positions from key levels.

The news background on the UK economy is calm.

GBP/USD

The price fixed above 50 MA and 100 MA, which signals the power of buyers.

The MACD histogram is in the positive zone and above the signal line, which gives a strong signal to buy GBP/USD.

The Stochastic Oscillator is in the neutral zone, the %K line crossed the %D line. There are no signals at the moment.

Trading recommendations
  • Support levels: 1.29150, 1.28850, 1.28600
  • Resistance levels: 1.29500, 1.30000

If the price consolidates above 1.29500, expect further growth toward 1.30000.

Alternatively, the quotes could descend toward 1.28900-1.28700.

The USD/CAD currency pair

Technical indicators of the currency pair:
  • Prev Open: 1.32478
  • Open: 1.32230
  • % chg. over the last day: -0.18
  • Day’s range: 1.32097 – 1.32249
  • 52 wk range: 1.2727 – 1.3664

The USD/CAD currency pair is dominated by bearish sentiment. At the moment, Looney is consolidating near key extremes. The trading tool is testing the support level of 1.32100. 1.32350 is the nearest resistance. USD / CAD quotes have the potential to further decline. The Canadian dollar is supported by the positive dynamics of oil quotes. We recommend opening positions from key levels.

The Economic News Feed for 18.11.2019 is calm.

USD/CAD

The price fixed below 50 MA and 100 MA, which signals the power of sellers.

The MACD histogram is in the negative zone and continues to decline, which gives a strong signal to sell USD/CAD.

The Stochastic Oscillator is in the neutral zone, the %K line crossed the %D line. There are no signals at the moment.

Trading recommendations
  • Support levels: 1.32100, 1.31900, 1.31600
  • Resistance levels: 1.32350, 1.32700

If the price consolidates below 1.32100, further correction of the USD/CAD currency pair is expected toward 1.31800-1.31600.

Alternatively, the quotes could grow toward 1.32600-1.32800.

The USD/JPY currency pair

Technical indicators of the currency pair:
  • Prev Open: 108.384
  • Open: 108.783
  • % chg. over the last day: +0.31
  • Day’s range: 108.669 – 108.949
  • 52 wk range: 104.97 – 114.56

The USD/JPY currency pair has moved up. The trading tool has updated local highs. At the moment, quotes are testing a mirror resistance level of 108.900. The 108.650 mark is the immediate support. Demand for safe haven currencies has weakened amid the prospects for resolving a trade conflict between the US and China. We do not exclude further growth of the USD/JPY quotes. We recommend that you pay attention to the dynamics of yield on US government bonds. Open positions from key levels.

The Economic News Feed for 18.11.2019 is calm.

USD/JPY

Indicators do not give accurate signals, the price crossed 50 MA and 100 MA.

The MACD histogram is in the positive zone and continues to rise, which gives a strong signal to buy USD/JPY.

The Stochastic Oscillator is in the neutral zone, the %K line is below the %D line, which indicates a bearish sentiment.

Trading recommendations
  • Support levels: 108.650, 108.400, 108.250
  • Resistance levels: 108.900, 109.150, 109.300

If the price consolidates above 108.900, expect the quotes to rise toward 109.150-109.300.

Alternatively, the quotes could descend toward 108.500-108.300.

by JustForex

DAX30 CFD still range-bound between 13,100 and 13,300 points, with a clear bullish touch

By Admiral Markets

Economic Event

Source: Economic Events November 18, 2019 – Admiral Markets’ Forex Calendar

The DAX30 CFD was range-bound again last week, and since we have a thin economic calendar this Monday, we have to see whether we get to see a serious attack of the DAX30 CFD to break out of its range.

The relevant levels can still be found around 13,100 points on the downside, and 13,300 points on the upside and, and this is where our focus will be.

While the short-term mode can be considered neutral, the longer time-frame picture can be seen bullish with a break out of the range above 13,300 points having an overall higher likelihood in our opinion.

Besides the technical side, the thin economic calendar in addition to market participants keep adding to their overall extended volatility short-position add up tour bullish bias.

Above 13,300 points, the first target can be found around 13,500 points, while in the event of a (surprise) breakout of the trading range on the downside, and a drop below 13,100 points, the next target can be found around 12,970 / 13,000 points:

DAX30 CFD-HOURLY

Source: Admiral Markets MT5 with MT5-SE Add-on DAX30 CFD Hourly chart (between October 24, 2019, to November 15, 2019). Accessed: November 15, 2019, at 10:00pm GMT

DAX30 CFD-DAILY

Source: Admiral Markets MT5 with MT5-SE Add-on DAX30 CFD Daily chart (between May 15, 2018, to November 15, 2019). Accessed: November 15, 2019 at 10:00pm GMT – Please note: Past performance is not a reliable indicator of future results, or future performance.

In 2014, the value of the DAX30 CFD increased by 2.65%, in 2015, it increased by 9.56%, in 2016, it increased by 6.87%, in 2017, it increased by 12.51%, in 2018, it fell by 18.26%, meaning that after five years, it was up by 10.5%.

Discover the world’s #1 multi-asset platform

Admiral Markets offers professional traders the ability to trade with a custom, upgraded version of MetaTrader 5, allowing you to experience trading at a significantly higher, more rewarding level. Experience benefits such as the addition of the Market Heat Map, so you can compare various currency pairs to see which ones might be lucrative investments, access real-time trading data, and so much more. Click the banner below to start your FREE download of MT5 Supreme Edition!

Download MetaTrader 5 and begin trading today!

Disclaimer: The given data provides additional information regarding all analysis, estimates, prognosis, forecasts or other similar assessments or information (hereinafter “Analysis”) published on the website of Admiral Markets. Before making any investment decisions please pay close attention to the following:

  1. This is a marketing communication. The analysis is published for informative purposes only and are in no way to be construed as investment advice or recommendation. It has not been prepared in accordance with legal requirements designed to promote the independence of investment research, and that it is not subject to any prohibition on dealing ahead of the dissemination of investment research.
  2. Any investment decision is made by each client alone whereas Admiral Markets shall not be responsible for any loss or damage arising from any such decision, whether or not based on the Analysis.
  3. Each of the Analysis is prepared by an independent analyst (Jens Klatt, Professional Trader and Analyst, hereinafter “Author”) based on the Author’s personal estimations.
  4. To ensure that the interests of the clients would be protected and objectivity of the Analysis would not be damaged Admiral Markets has established relevant internal procedures for prevention and management of conflicts of interest.
  5. Whilst every reasonable effort is taken to ensure that all sources of the Analysis are reliable and that all information is presented, as much as possible, in an understandable, timely, precise and complete manner, Admiral Markets does not guarantee the accuracy or completeness of any information contained within the Analysis. The presented figures refer that refer to any past performance is not a reliable indicator of future results.
  6. The contents of the Analysis should not be construed as an express or implied promise, guarantee or implication by Admiral Markets that the client shall profit from the strategies therein or that losses in connection therewith may or shall be limited.
  7. Any kind of previous or modeled performance of financial instruments indicated within the Publication should not be construed as an express or implied promise, guarantee or implication by Admiral Markets for any future performance. The value of the financial instrument may both increase and decrease and the preservation of the asset value is not guaranteed.
  8. The projections included in the Analysis may be subject to additional fees, taxes or other charges, depending on the subject of the Publication. The price list applicable to the services provided by Admiral Markets is publicly available from the website of Admiral Markets.
  9. Leveraged products (including contracts for difference) are speculative in nature and may result in losses or profit. Before you start trading, you should make sure that you understand all the risks.

By Admiral Markets

EURUSD: euro recovers on back of news from China

By Alpari.com

By the end of last week, almost all major currencies closed in the black. The highest growth against the US dollar was shown by the New Zealand dollar (+1.22%). The British pound increased by 0.98%, the Swiss franc – 0.79%, the Japanese yen – 0.43% and the euro – 0.23%. The Australian dollar fell (-0.56%). Major US stock indices closed at record highs.

Positivity in the market was caused by news out of China. US Economic Advisor Larry Kudlow said the US and China are close to a trade agreement. He called the ongoing negotiations “very constructive”.

US Secretary of Commerce Wilbur Ross said progress is being made in concluding the details of a future trade agreement. Both parties are keen on concluding an agreement at the end of the first phase of negotiations.

Day’s news (GMT +3):

14:00 Germany: German Buba Monthly Report.

18:00 USA: NAHB Housing Market Index (Nov).

21:00 USA: 3- and 6-Month Bill Auction.

currencies

Current situation:
On the 8H chart, after the breakdown of the trend line from 1.1175, the euro exchange rate has grown by 60 points, to 1.1064. The news regarding the productive negotiations between the US and China which broke over the weekend was clearly the catalyst.

Today is Monday – correction day. There is hardly any fresh news to report. At Asian auctions, the pound and the euro are trading up, while other currencies are down. To understand the general mood of market players, we will need to wait until the start of trading in Europe.

The increase was 38% of the fall from 1.1175 to 1.0989. The maximum of 1.1043 (11.11.19) was passed. Now kickbacks will be perceived for purchases. Support is based at the 1.1025 mark.

By Alpari.com