CATTLE Analysis: Beef production increased in the US

By IFCMarkets

Beef production increased in the US

US Department of Agriculture (USDA) announced an increase in beef production in October 2019. Will LCATTLE quotations fall?

US beef production increased by 11% in October compared to September 2019 and by 1% compared to October 2018. The USDA forecasts a 2.2% further growth in 2020 compared to the current year. Currently, it is difficult to say whether China will increase US beef purchases, as trade negotiations between the two countries are quite difficult. China demanded that the US authorities stop interfering in Hong Kong’s political crisis. Meanwhile, China is actively purchasing beef worldwide. In particular, China increased its imports from Brazil in January-October 2019 by 23.6% compared to the same period in 2018. The monthly “Cattle on Feed” report by the USDA will be released late Friday night. According to forecasts, the number of cattle in feedlots in October 2019 will increase by 11.4% compared to October 2018.

LCATTLE

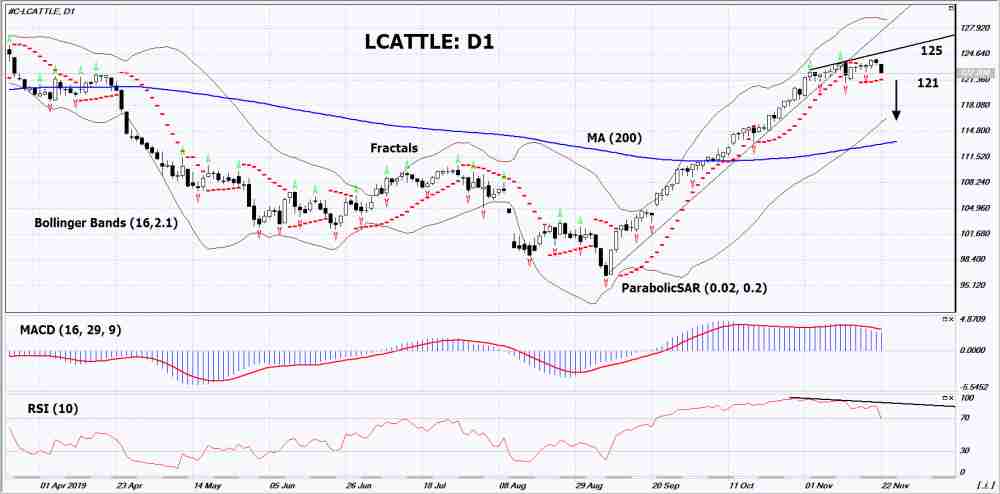
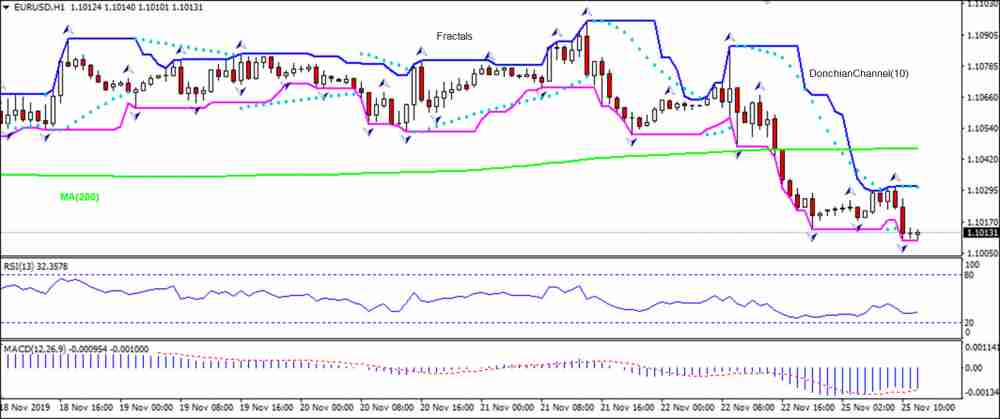
On the daily timeframe, LCATTLE: D1 has left the uptrend. A number of technical analysis indicators formed sell signals. A decrease in quotations is possible in case of an increase in the number of cattle in the US and problems in US-China trade negotiations.

  • The Parabolic indicator gives a bullish signal. It can be used as an additional support line, which should be breached down before opening a sell position.
  • The Bollinger bands have widened, which indicates high volatility. The upper Bollinger band is titled down.
  • The RSI indicator is above 50. It has formed a negative divergence.
  • The MACD indicator gives a bearish signal.

The bearish momentum may develop in case LCATTLE falls below the three fractal lows and the Parabolic signal at 121. This level may serve as an entry point. The initial stop loss may be placed above the last fractal high and the 8-month high at 125. After opening the pending order, we shall move the stop to the next fractal low following the Bollinger and Parabolic signals. Thus, we are changing the potential profit/loss to the breakeven point. More risk-averse traders may switch to the 4-hour chart after the trade and place there a stop loss moving it in the direction of the trade. If the price meets the stop level (125), without reaching the order (121), we recommend closing the position: the market sustains internal changes that were not taken into account.

Summary of technical analysis

PositionSell
Sell stopBelow 121
Stop lossAbove 125

Market Analysis provided by IFCMarkets

Consumer Discretionary Sector and Corporate Bonds On Verge of Sell-off

By TheTechnicalTraders.com

I have been warning of a peak in the markets and a continued capital shift in the global economy that continued to push the NASDAQ and DOW towards new all-time highs while the foundations of the global markets continued to weaken.

I authored dozens of research posts regarding this phenomenon over the past 90+ days.  Yet the clearest signs of this event may already be present in these Consumer Discretionary Sector and Corporate Bonds charts.

Consumers drive economic activity and corporate debt is often a measure of sustainable debt function within a functioning economy.  When consumers tighten their belts and exit the economy in some form and Corporate debt is viewed as “more toxic” than “opportunistic” – something has changed in the global economy where a portion of the active consumer engagement of that economy is waning or has already left the building.

One of the biggest reasons economic contractions happen is because consumers exit the marketplace as a form of protectionism.  Much like in 2008-09, when the credit crisis started hitting, many consumers were in shock and simply exited the marketplace completely.  They didn’t buy big-ticket items.  They didn’t go on trips.  They didn’t do much of anything other than try to pay their bills and to protect what they had.  I call this the “toilet paper and toothpaste mode”.  Consumers typically buy only what is needed at times like this and try to save as much as they can. You can get all of my trade ideas if you opt-in to my free trend signals alert list.

Consumer Discretionary Sector – Daily Chart

If the Consumer Discretionary sector breaks below the $118 level and continues lower, it would be a very clear sign that the lower price channel has been broken and that new downward pricing pressures are taking place in the global markets.  The bigger picture is that a breakdown in consumer confidence could take place – much like a self-fulfilling event.  When the consumer market begins to tighten, more fragile consumers (those without extra money to spend) begin to tighten their spending and begin to default on loans/credit cards.

As the event extends, more middle-ground consumers begin to change their tactics and risks become more evident to them.  Each time a consumer sector moves into a protectionist mode, it pushes other areas of the economy into a crisis mode/contraction.  Thus, the self-fulfilling process continues until a bottom is reached.

High Yield Corporate Bonds – Daily Chart

Corporate Bonds are another measure of economic engagement and debt function.  A breakdown in Corporate Bonds would become a major debt risk factor for the consumer market and for the global stock market.  As Corporate debt falls below the lower trend line level, consumers and lenders may begin to view Corporate Debt as more and riskier.  This creates a type of panic is the consumer sector has already begun to move towards a protectionist mode.

Corporate Debt failures would represent a massive risk factor for the global economy because it would break the overall confidence within the markets and push consumers over the edge in terms of economic activity and engagement.

Remember near the end of 2018 when the market collapsed after the US fed raised rates in early October 2018.  This type of breakdown was the same type of event.  What changed was the US Fed had to alter its longer-term stance in the markets and decrease rates in order for the markets to feel more comfortable.  Now, 12 months later, after the FED has lowered rates three times and softened forward expectations, what would a breakdown in consumer and corporate sectors really do to the markets?  What would the Fed use to counter a price contraction and consumer panic?

Pay very close attention to both of these sectors going forward.  We believe we are very close to the edge of a massive price breakdown event given our research.  If these charts break lower and breakthrough price support, the global markets could contract by at much as 15 to 22% over time – possibly further.

I urge you visit my Wealth Building Newsletter and if you like what I offer, join me with the 1 or 2-year subscription to lock in the lowest rate possible and ride my coattails as I navigate these financial market and build wealth while others lose nearly everything they own during the next financial crisis. Join Now and Get a Free 1oz Silver Round or Gold Bar!

I can tell you that huge moves are about to start unfolding not only in metals, or stocks but globally and some of these supercycles are going to last years. This quick and simple to understand guide on trading with technical analysis will allow you to follow the markets closely and trade with it. Never be caught on the wrong side of the market again and suffer big losses. PDF guide: Technical Trading Mastery

As a technical analysis and trader since 1997, I have been through a few bull/bear market cycles. I believe I have a good pulse on the market and timing key turning points for both short-term swing trading and long-term investment capital. The opportunities are massive/life-changing if handled properly.

Chris Vermeulen
TheTechnicalTraders.com

NOTICE: Our free research does not constitute a trade recommendation or solicitation for our readers to take any action regarding this research.  It is provided for educational purposes only.  Our research team produces these research articles to share information with our followers/readers in an effort to try to keep you well informed.  Visit our web site (TheTechnicalTraders.com) to learn how to take advantage of our members-only research and trading signals.


Forex Technical Analysis & Forecast 25.11.2019 (EURUSD, GBPUSD, USDCHF, USDJPY, AUDUSD, USDRUB, USDCAD, GOLD, BRENT, BTCUSD)

Article By RoboForex.com

EURUSD, “Euro vs US Dollar”

EURUSD has reached the short-term target of another descending impulse at 1.1015; right now, it is consolidating around 1.1020. Possibly, today the pair may extend the structure towards 1.1012 and then start a new correction to reach 1.1030, at least. After that, the instrument may resume trading downwards with the predicted target at 1.0933.

EURUSD
Risk Warning: the result of previous trading operations do not guarantee the same results in the future

GBPUSD, “Great Britain Pound vs US Dollar”

GBPUSD continues forming the second descending impulse. Today, the pair may reach 1.2783 and then start another correction towards 1.2855, at least. Later, the market may form a new descending structure with the target at 1.2750.

GBPUSD
Risk Warning: the result of previous trading operations do not guarantee the same results in the future

USDCHF, “US Dollar vs Swiss Franc”

USDCHF has reached the short-term upside target at 0.9975; right now, it is consolidating above 0.9968. possibly, the pair may break this level to the downside and start a new correction towards 0.955, at least. After that, the instrument may resume growing with the target at 0.9995.

USDCHF
Risk Warning: the result of previous trading operations do not guarantee the same results in the future

USDJPY, “US Dollar vs Japanese Yen”

USDJPY has broken 108.69 upwards. Possibly, the pair may choose an alternative scenario and continue the correction towards 108.93. According to the main scenario, the price is expected to continue trading inside the downtrend to reach 107.04.

USDJPY
Risk Warning: the result of previous trading operations do not guarantee the same results in the future

AUDUSD, “Australian Dollar vs US Dollar”

AUDUSD is consolidating around 0.6797 without any particular direction. The main scenario implies that the price may continue trading inside the downtrend with the target at 0.6773.

AUDUSD
Risk Warning: the result of previous trading operations do not guarantee the same results in the future

USDRUB, “US Dollar vs Russian Ruble”

USDRUB is consolidating around 63.73. Possibly, the pair may form one more ascending structure to reach 63.88. Later, the market may resume trading inside the downtrend with the target at 63.11.

USDRUB
Risk Warning: the result of previous trading operations do not guarantee the same results in the future

USDCAD, “US Dollar vs Canadian Dollar”

USDCAD has finished the ascending impulse towards 1.3297. Today, the pair may consolidate around this level. If later the price breaks this range to the downside at 1.3270, the market may resume falling towards 1.3220; if to the upside at 1.3303 – form one more ascending structure with the target at 1.3343.

USDCAD
Risk Warning: the result of previous trading operations do not guarantee the same results in the future

XAUUSD, “Gold vs US Dollar”

Gold has completed the descending impulse at 1459.60. Possibly, today the pair may consolidate around 1463.00. After that, the instrument may break 1459.50 and continue trading inside the downtrend with the target at 1444.00.

GOLD
Risk Warning: the result of previous trading operations do not guarantee the same results in the future

BRENT

Brent has finished the correction towards 63.00; right now, it is still trading upwards to reach 63.66. Later, the market may break this level and continue growing with the first target at 65.50.

BRENT
Risk Warning: the result of previous trading operations do not guarantee the same results in the future

BTCUSD, “Bitcoin vs US Dollar”

After failing to form a new ascending impulse from 7500.00, BTCUSD has broken 7350.00 to the downside to continue the downtrend with the target at 6400.00. Today, the pair may reach 6464.00 and then form one more ascending structure towards 6888.00. Later, the market may resume trading downwards to reach the above-mentioned target.

BITCOIN

Article By RoboForex.com

Attention!
Forecasts presented in this section only reflect the author’s private opinion and should not be considered as guidance for trading. RoboForex LP bears no responsibility for trading results based on trading recommendations described in these analytical reviews.

Murrey Math Lines 25.11.2019 (EURUSD, GBPUSD)

Article By RoboForex.com

EURUSD, “Euro vs. US Dollar”

In the H4 chart, EURUSD is trading below 3/8. In this case, the price is expected to continue trading downwards to reach the support at 0/8. However, this scenario may no longer be valid if the price breaks 2/8 to the upside. After that, the instrument may continue growing towards the resistance at 4/8.

EURUSD_H4
Risk Warning: the result of previous trading operations do not guarantee the same results in the future

As we can see in the M15 chart, the pair has broken the downside line of the VoltyChannel indicator and, as a result, may continue moving downwards.

EURUSD_M15
Risk Warning: the result of previous trading operations do not guarantee the same results in the future

GBPUSD, “Great Britain Pound vs US Dollar”

Last Friday, GBPUSD rebounded from 5/8. In this case, the price is expected to continue growing to reach the resistance at 7/8. However, this scenario may no longer be valid if the price breaks 5/8. After that, the instrument is expected to continue falling towards the support at 3/8.

GBPUSD_H4
Risk Warning: the result of previous trading operations do not guarantee the same results in the future

In the M15 chart, the pair may break the upside line of the VoltyChannel indicator and, as a result, continue trading upwards.

GBPUSD_M15

Article By RoboForex.com

Attention!
Forecasts presented in this section only reflect the author’s private opinion and should not be considered as guidance for trading. RoboForex LP bears no responsibility for trading results based on trading recommendations described in these analytical reviews.

EURUSD Analysis: Improving Ifo index bullish for EURUSD

By IFCMarkets

Improving Ifo index bullish for EURUSD

Germany’s Ifo institute reported its business climate index rose slightly in November. Will the EURUSD rise?

EURUSD falling below MA(200)

The price chart on 1-hour timeframe shows EURUSD: H1 is trading sideways. The price is falling below the 200-period moving average MA(200) which is level. And the RSI oscillator is below 50 level and has not reached the oversold zone. There is no trend yet formed, traders have to decide when it would be a best time to enter the market.

Market Analysis provided by IFCMarkets

The Analytical Overview of the Main Currency Pairs on 2019.11.25

by JustForex

The EUR/USD currency pair

Technical indicators of the currency pair:
  • Prev Open: 1.10585
  • Open: 1.10157
  • % chg. over the last day: -0.01
  • Day’s range: 1.10228 – 1.10279
  • 52 wk range: 1.0884 – 1.1623

At the end of last week, the EUR/USD currency pair went down. At the moment, the trading instrument is in lateral movement. The local support and resistance levels are 1.10150 and 1.10350, respectively. On Friday, EU published mixed reports. CB Chairman Christine Lagarde noted the general uncertainty in the global economy and encouraged Europe to develop a new set of measures, including budgetary incentives. The US dollar strengthened after comments by US President Trump that the trade deal with China is “very close.” We recommend opening positions from key levels.

Germany published the IFO business climate index at 11:00 (GMT+2:00).

EUR/USD

The price fixed below 50 MA and 100 MA, which signals the strength of sellers.

The MACD histogram is in the negative zone but above the signal line, which gives a weak signal to sell EUR/USD.

The Stochastic Oscillator is in the neutral zone, the %K line crosses the %D line. There are no signals at the moment.

Trading recommendations
  • Support levels: 1.10150, 1.09900
  • Resistance levels: 1.10350, 1.10550, 1.10800

If the price consolidates above 1.10350, expect the quotes to grow toward 1.10550-1.10700.

Alternatively, the quotes could drop toward 1.09900-1.09700.

The GBP/USD currency pair

Technical indicators of the currency pair:
  • Prev Open: 1.29055
  • Open: 1.28515
  • % chg. over the last day: +0.15
  • Day’s range: 1.28691 – 1.28659
  • 52 wk range: 1.1959 – 1.3385

On Friday, the GBP/USD currency pair dropped down because of weak economic reports from the UK. The business activity index in the manufacturing sector was 48.3 instead of 48.8. The business activity index in the services sector was 48.6 instead of 50.1. Economic performance is deteriorating due to uncertainty around Brexit. At the moment, GBP has recovered a significant part of the losses. The key support and resistance levels are 1.28400 and 1.28750. Open positions from key levels.

The Economic News Feed for 25.11.2019 is calm.

GBP/USD

Indicators point to the power of sellers: the price has fixed below 50 MA and 100 MA.

The MACD histogram is in the negative zone but above the signal line, which gives a weak signal to sell GBP/USD.

The Stochastic Oscillator has reached overbought zone, the %K line is above the %D line, which indicates bullish sentiment.

Trading recommendations
  • Support levels: 1.28400, 1.28150, 1.28000
  • Resistance levels: 1.28750, 1.29000, 1.29250

If the price consolidates above 1.28750, expect the quotes to rise toward 1.29000-1.29250.

Alternatively, the quotes could descend toward 1.28200-1.28000.

Registration

The USD/CAD currency pair

Technical indicators of the currency pair:
  • Prev Open: 1.32828
  • Open: 1.32954
  • % chg. over the last day: -0.17
  • Day’s range: 1.32698 – 1.32882
  • 52 wk range: 1.2727 – 1.3664

At the moment, USD/CAD quotes are moving sideways. There is no defined trend. The local support and resistance levels are 1.32750 and 1.33000, respectively. On Friday, Canada published a positive retail sales report. However, the USD was also strong, which led to the consolidation. Investors expect additional drivers. We recommend you to pay attention to the dynamics of prices of “black gold”. Open positions from key levels.

The Economic News Feed for 25.11.2019 is calm.

USD/CAD

Indicators do not give accurate signals: the price crossed 50 MA and 100 MA.

The MACD histogram has approached the 0 mark.

The Stochastic Oscillator is in the oversold zone, the %K line is below the %D line, which gives a weak signal to sell USD/JPY.

Trading recommendations
  • Support levels: 1.32750, 1.32550, 1.32300
  • Resistance levels: 1.33000, 1.33250

If the price consolidates below 1.32750, expect the quotes to descend toward 1.32500-1.34300.

Alternatively, the quotes could grow toward 1.33250-1.33400.

The USD/JPY currency pair

Technical indicators of the currency pair:
  • Prev Open: 108.625
  • Open: 108.660
  • % chg. over the last day: +0.06
  • Day’s range: 108.838 – 108.896
  • 52 wk range: 104.97 – 114.56

The USD/JPY currency pair has moved up. The trading tool has updated the local highs. Demand for the safe haven currencies weakened amid positive news on the settlement of the trade conflict between Washington and Beijing. At the moment, USD/JPY quotes are consolidating in the range of 108.700-108.900. We recommend you to pay attention to the dynamics of yield on US government bonds and open positions from key levels.

The Economic News Feed for 25.11.2019 is calm.

USD/JPY

Indicators point to the strength of buyers: the price has fixed above 50 MA and 100 MA.

The MACD histogram is in the positive zone and above the signal line, which gives a strong signal to buy USD/JPY.

The Stochastic Oscillator is near the overbought zone, the %K line crosses the %D line. There are no signals.

Trading recommendations
  • Support levels: 108.700, 108.450, 108.250
  • Resistance levels: 108.900, 109.050, 109.250

If the price consolidates above 108.900, expect the quotes to grow toward 109.150-109.250.

Alternatively, the quotes could descend toward 108.550-108.450.

by JustForex

Is Another Sharp PM Sector Down-Leg Imminent?

By The Gold Report

Source: Clive Maund for Streetwise Reports   11/22/2019

Technical analyst Clive Maund examines the data and answers the question.

The precious metals sector has been on the defensive since gold’s COTs reached extreme readings in August, and silver broke down from its parabolic uptrend in September. Many think that the sector correction has now run its course, but has it? That is the question that this update is intended to answer.

On gold’s latest six-month chart we can see the correction in force from the start of September and how it has unwound its earlier overbought condition and brought it back to a support level. Given the bullish alignment of moving averages, which shows the existence of a larger uptrend, many are concluding that all this will be sufficient to get it moving north again from here. However, there are several bearish factors in play, which suggest that instead we are likely to see another sharp drop before this corrective phase is done. The quite sharp drop early this month was on heavy volume, and the feeble rally of the past week or so looks like a countertrend rally—a bear flag—that will lead to another sharp down-leg very soon. This will break gold out of the channel shown and take the price to our downside objective in the $1,380–$1400 area.

Gold’s COTs are still decidedly bearish. The Large Specs haven’t given up—they need a good kicking so that they retreat back into their holes. When this happens the picture will look a lot healthier.

These COTs by themselves make another sharp drop soon highly likely. The latest COTs are shown just below the gold chart so that you can see for yourselves, and note that new COTs will be available in a couple of days.

The latest chart for GDX by itself actually looks quite positive, with the corrective downtrend back toward a rising 200-day moving average looking like a bullish falling wedge. It’s the gold and silver charts that spoil it, suggesting as they do that a nasty sharp down-leg is in the works, which will bust GDX out of this channel to the downside. Note, however, that stocks will sense the impending bottom in gold and will likely turn up before it, so precious metals (PM) stocks indices are unlikely to drop much further.

If gold looks like it’s going to drop, what about silver? On silver’s latest six-month chart we can see a similar pattern completing—a bear flag following a nasty, high-volume drop early in the month. This pattern suggests a high probability that silver will break down out the channel shown and head for the support level shown in the $15.30–$15.55 zone.

Originally posted on CliveMaund.com at 6.40am EST on 20 November 2019.

Clive Maund has been president of www.clivemaund.com, a successful resource sector website, since its inception in 2003. He has 30 years’ experience in technical analysis and has worked for banks, commodity brokers and stockbrokers in the City of London. He holds a Diploma in Technical Analysis from the UK Society of Technical Analysts.

Sign up for our FREE newsletter at: www.streetwisereports.com/get-news

Disclosure:
1) Statements and opinions expressed are the opinions of Clive Maund and not of Streetwise Reports or its officers. Clive Maund is wholly responsible for the validity of the statements. Streetwise Reports was not involved in the content preparation. Clive Maund was not paid by Streetwise Reports LLC for this article. Streetwise Reports was not paid by the author to publish or syndicate this article.
2) This article does not constitute investment advice. Each reader is encouraged to consult with his or her individual financial professional and any action a reader takes as a result of information presented here is his or her own responsibility. By opening this page, each reader accepts and agrees to Streetwise Reports’ terms of use and full legal disclaimer. This article is not a solicitation for investment. Streetwise Reports does not render general or specific investment advice and the information on Streetwise Reports should not be considered a recommendation to buy or sell any security. Streetwise Reports does not endorse or recommend the business, products, services or securities of any company mentioned on Streetwise Reports.
3) From time to time, Streetwise Reports LLC and its directors, officers, employees or members of their families, as well as persons interviewed for articles and interviews on the site, may have a long or short position in securities mentioned. Directors, officers, employees or members of their immediate families are prohibited from making purchases and/or sales of those securities in the open market or otherwise from the time of the interview or the decision to write an article until three business days after the publication of the interview or article. The foregoing prohibition does not apply to articles that in substance only restate previously published company releases.

Charts and graphics provided by the author.

CliveMaund.com Disclosure:
The above represents the opinion and analysis of Mr Maund, based on data available to him, at the time of writing. Mr. Maund’s opinions are his own, and are not a recommendation or an offer to buy or sell securities. Mr. Maund is an independent analyst who receives no compensation of any kind from any groups, individuals or corporations mentioned in his reports. As trading and investing in any financial markets may involve serious risk of loss, Mr. Maund recommends that you consult with a qualified investment advisor, one licensed by appropriate regulatory agencies in your legal jurisdiction and do your own due diligence and research when making any kind of a transaction with financial ramifications. Although a qualified and experienced stock market analyst, Clive Maund is not a Registered Securities Advisor. Therefore Mr. Maund’s opinions on the market and stocks can only be construed as a solicitation to buy and sell securities when they are subject to the prior approval and endorsement of a Registered Securities Advisor operating in accordance with the appropriate regulations in your area of jurisdiction.

The DAX30 CFD is still range-bound and choppy between 13,100 and 13,300

By Admiral Markets

Economic Event

Source: Economic Events November 25, 2019 – Admiral Markets’ Forex Calendar

With the thin Economic calendar being as we start the trading week, and the upcoming Thanksgiving holiday on Thursday (for modified Trading Hours please check our website), we don’t expect much volatility in Equity markets and thus in the German DAX30 CFD.

Still, we want to have a look at the technical side after the recent interesting price action over the last week: after the failed attempt to break above 13,300 points last Tuesday, but also below 13,100 points, we expect the DAX30 CFD to stay range-bound in the days to come.

With the latest rise in tensions in the trade dispute between the US and China again (e.g. that the mood in Beijing about a trade deal is rather pessimistic and the strategy from the Chinese now switching to “talk only” and wait due to the recent impeachment developments and uncertainty around the upcoming US election), our neutral picture with an expected choppy price action although has a slight bearish touch.

But even if we get to see a test of the psychological relevant region around 13,000 points, we consider the recent and very dovish stances from the ECB and FED and technically solid support region around 12,980/13,000 points as difficult and sustainably to break in the days to come.

On the upside a break above Friday’s highs around 13,250 points makes a test of the region around 13,300 points and above of the pre-weekly highs around 13,370 an option:

DAX30 CFD - Hourly chart

Source: Admiral Markets MT5 with MT5-SE Add-on DAX30 CFD Hourly chart (between November 5, 2019, to November 22, 2019). Accessed: November 22, 2019, at 10:00pm GMT – Please note: Past performance is not a reliable indicator of future results, or future performance.

DAX30 CFD - Daily chart

Source: Admiral Markets MT5 with MT5-SE Add-on DAX30 CFD Daily chart (between August 16, 2018, to November 22, 2019). Accessed: November 22, 2019, at 10:00pm GMT

In 2014, the value of the DAX30 CFD increased by 2.65%, in 2015, it increased by 9.56%, in 2016, it increased by 6.87%, in 2017, it increased by 12.51%, in 2018, it fell by 18.26%, meaning that after five years, it was up by 10.5%.

Discover the world’s #1 multi-asset platform

Admiral Markets offers professional traders the ability to trade with a custom, upgraded version of MetaTrader 5, allowing you to experience trading at a significantly higher, more rewarding level. Experience benefits such as the addition of the Market Heat Map, so you can compare various currency pairs to see which ones might be lucrative investments, access real-time trading data, and so much more. Click the banner below to start your FREE download of MT5 Supreme Edition!

Download MetaTrader 5 and begin trading today!

Disclaimer: The given data provides additional information regarding all analysis, estimates, prognosis, forecasts or other similar assessments or information (hereinafter “Analysis”) published on the website of Admiral Markets. Before making any investment decisions please pay close attention to the following:

  1. This is a marketing communication. The analysis is published for informative purposes only and are in no way to be construed as investment advice or recommendation. It has not been prepared in accordance with legal requirements designed to promote the independence of investment research, and that it is not subject to any prohibition on dealing ahead of the dissemination of investment research.
  2. Any investment decision is made by each client alone whereas Admiral Markets shall not be responsible for any loss or damage arising from any such decision, whether or not based on the Analysis.
  3. Each of the Analysis is prepared by an independent analyst (Jens Klatt, Professional Trader and Analyst, hereinafter “Author”) based on the Author’s personal estimations.
  4. To ensure that the interests of the clients would be protected and objectivity of the Analysis would not be damaged Admiral Markets has established relevant internal procedures for prevention and management of conflicts of interest.
  5. Whilst every reasonable effort is taken to ensure that all sources of the Analysis are reliable and that all information is presented, as much as possible, in an understandable, timely, precise and complete manner, Admiral Markets does not guarantee the accuracy or completeness of any information contained within the Analysis. The presented figures refer that refer to any past performance is not a reliable indicator of future results.
  6. The contents of the Analysis should not be construed as an express or implied promise, guarantee or implication by Admiral Markets that the client shall profit from the strategies therein or that losses in connection therewith may or shall be limited.
  7. Any kind of previous or modeled performance of financial instruments indicated within the Publication should not be construed as an express or implied promise, guarantee or implication by Admiral Markets for any future performance. The value of the financial instrument may both increase and decrease and the preservation of the asset value is not guaranteed.
  8. The projections included in the Analysis may be subject to additional fees, taxes or other charges, depending on the subject of the Publication. The price list applicable to the services provided by Admiral Markets is publicly available from the website of Admiral Markets.
  9. Leveraged products (including contracts for difference) are speculative in nature and may result in losses or profit. Before you start trading, you should make sure that you understand all the risks.

By Admiral Markets

The US Dollar Is in the Positive Zone Amid a Probable Resolution of the Trade Conflict Between the US and China

by JustForex

On Friday, the US dollar strengthened against a basket of currency majors. The dollar index (#DX) closed in the positive zone (+0.28%) on Friday. The potential for further growth is still high. US President D. Trump said that Beijing and Washington were close to concluding a phase one trade agreement. Donald Trump expects to move to the second stage of negotiations quickly after the completion of the “first phase.” In the second stage, the President wants to focus the US on the fact that China is stealing American intellectual property. However, Chinese officials are in no hurry to move on to the second stage before the U.S. presidential election in 2020. They prefer to wait a while and see if D. Trump remains for a second term.

The British pound weakened against the US currency. Weak economic statistics from the UK were published. The index of economic activity in the manufacturing sector counted to 48.3 instead of 48.8. Services PMI counted to 48.6 instead of 50.1. The slowdown in the UK economy in November strengthened due to uncertainty concerning Brexit.

The “black gold” prices fell slightly after growth the day before. At the moment, futures for the WTI crude oil are testing the $57.75 mark per barrel.

Market Indicators

On Friday, there was the bullish sentiment in the US stock market: #SPY (+0.22%), #DIA (+0.41%), #QQQ (+0.06%).

The 10-year US government bonds yield rose slightly. At the moment, the indicator is at the level of 1.77-1.78%.

The Economic News Feed for 25.11.2019:
  • – German IFO business climate index at 11:00 (GMT+2:00).

by JustForex

Pound Will Try to Reach Stability

By Dmitriy Gurkovskiy, Chief Analyst at RoboForex

On Monday, November 25th, the British Pound is consolidating against the USD after a quite unsuccessful trading session last Friday. The instrument is mostly trading at 1.2848.

At the end of last week, The United Kingdom published some macroeconomic reports, according to which the Services PMI went from 50.0 points in October to 48.6 points this month. The Manufacturing PMI decreased down to 48.3 points in November after being 49.6 points the month before. This is bad news: it means that the Brexit extension until January 31st, 2020 inspired neither manufacturers nor consumers and they had to become less active.

This, in its turn, indicates that in November the British GDP may lose that little support it still had. The fourth-quarter GDP will also suffer.

The Pound might have fallen much deeper if it wasn’t for optimism of the British Prime minister Boris Johnson. He plans to complete the UK’s exiting from the European Union and said he was ready to introduce relevant documents by December 25th, if his party wins the early elections of course.

In addition to that, Johnson is willing to postpone tax hikes and increase expenses on the health care sector. The electoral base should like, but there is no 100% guarantee that this move is going to work.

As we can see in the H4 chart, GBP/USD is forming the third descending wave with the first target at 1.2740. Today, the pair may consolidate around 1.2855; it has already defined the downside border. After breaking 1.2822, the instrument may reach the target of this wave at 1.2740 and then start another correction towards 1.2855. Later, the market may form a new descending structure to reach 1.2727; and that’s just a half of the third descending wave. From the technical point of view, this scenario is confirmed by MACD Oscillator: its signal line has broken 0 to the downside, thus indicating a further decline.

In the H1 chart, GBP/USD is consolidating in the center of the range. Possibly, today the pair may rebound from 1.2855 and fall towards 1.2822. After breaking this level, the instrument may continue trading downwards to reach 1.2788 and then form one more ascending structure to return to Later, the market may resume falling with the target at 1.2740. From the technical point of view, this scenario is confirmed by Stochastic Oscillator: its signal line has broken 50 to the downside and may continue falling towards the “oversold area”.

Disclaimer

Any predictions contained herein are based on the authors’ particular opinion. This analysis shall not be treated as trading advice. RoboForex shall not be held liable for the results of the trades arising from relying upon trading recommendations and reviews contained herein.