Precious Metals Quietly Booked Solid Gains in 2019; U.S. Public Sat Out

By Money Metals News Service

Welcome to this week’s Market Wrap Podcast, I’m Mike Gleason.

Coming up we’ll hear a fascinating and informative interview Money Metals president Stefan Gleason gave for the Sustainable Money podcast. Stefan shares some of the history behind sound money, when and where the wheels came off our monetary system, some disturbing developments in the war on cash movement and also goes through some dos and don’ts when it comes to purchasing gold and silver. You will not want to miss this revealing interview, coming up after this week’s market update.

On this final Weekly Market Wrap Podcast of 2019, we’ll look back at the year that was in precious metals markets… and look ahead to how things might shape up for 2020.

The year ahead could be a pivotal one for investors. Obviously, the election will dominate the headlines and could move markets dramatically as it draws nearer. A string of billionaires from Ray Dalio to Paul Tudor Jones to Stanley Druckenmiller to Leon Cooperman have warned that if President Donald Trump loses to a far-left Democrat, the stock market could crash.

For now, stocks are floating on optimism and a rising sea of liquidity created by the Federal Reserve. Its balance sheet will continue to expand into next spring and possibly beyond as repo market bailouts and “not QE” Treasury bill buying continues.

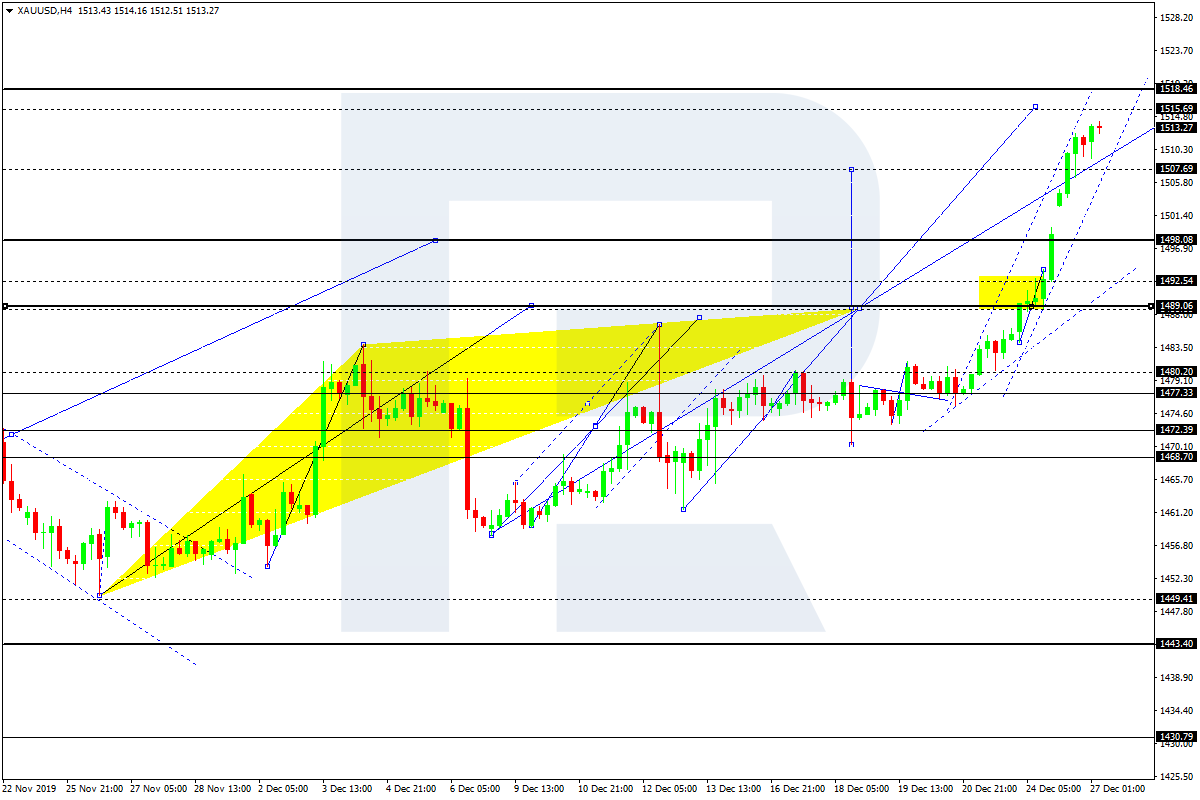
Stocks are making new highs once again thanks to a Santa Claus rally, but precious metals are outperforming in a big way. We had suggested last week that gold and silver markets were winding up for a major breakout, and that’s exactly what metals investors got for Christmas. It certainly beats a lump of coal!

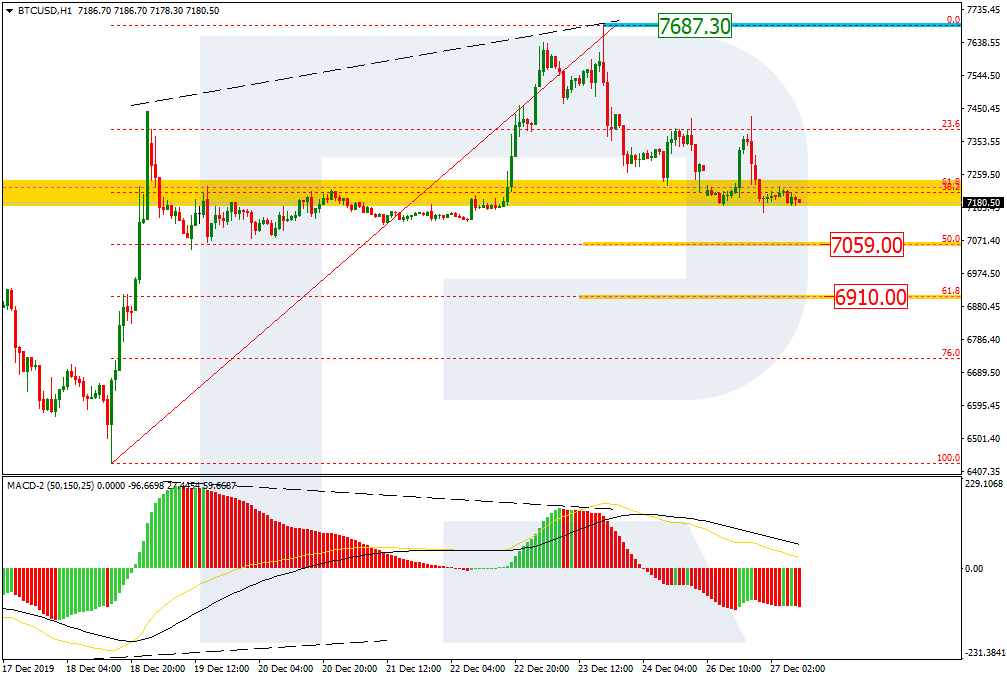
Gold prices are up 2.3% since last Friday’s close to trade at $1,514 per ounce. Silver is surging 4.1% on the week to bring spot prices to $18.00.

The platinum group metals are also joining in on the action, with platinum staging a 3.8% weekly advance to trade at $950 and palladium looking higher by 2.7% this week to come in at $1,908 per ounce as of this Friday morning recording.

The precious metals mining stocks are confirming the breakout in gold and silver by racing higher. The HUI gold miners index closed Thursday at a new high for the year on the heels of a 9% price spike this week – and that’s with trading being limited by the Christmas holiday.

The new upside momentum in mining and metals bodes well for January, which is normally a strong month for the sector. We could see some new multi-year highs for gold and silver get registered quickly in the early trading of 2020.

All the metals will finish 2019 with double digit gains. The yellow metal is on track for its best annual performance since 2010.

Gold and silver, however, will likely not be able to finish December at new high points for the year. Gold’s 2019 high occurred in early September just above $1,560 an ounce. Silver’s apex occurred around the same time when it hit $19.75.

The metals are putting in a strong year in spite of the fact that investment demand for bullion frankly remains weak overall. This year’s rally has been driven by other factors including trade wars, central bank buying, and growth in exchange-traded funds. Some wealthy smart money buyers are also accumulating precious metals ahead of the public.

The fact that we have not even reached the public participation phase of this precious metals bull market is actually encouraging from a contrarian perspective. It means a lot more people can be drawn in from the sidelines as prices rise.

While we’d much rather see the public buy at lows, very few ever will. Unfortunately, the mainstream investor typically won’t pay attention to precious metals until after they’ve made a major move up. There is also something to be said for the so-called “fear trade.” The fear mechanism innate to human psychology drives safe-haven demand for hard assets when stocks and other financial assets are melting down.

Neither the stock market nor the bond market nor even the U.S. dollar have induced much fear this year. Perhaps that will change in 2020.

Regardless of that, the supply and demand fundamentals for the metals are looking favorable for continued gains in 2020. Silver in particular will be pressured by rising industrial demand if the global economy expands and especially if favorable trade deals are reached.

On the supply side, the silver market faces potentially another year of declining mine output. The World Silver Survey shows production falling at an annual rate of 2% with no sign of a reversal on the immediate horizon.

Mines have been depleting their silver reserves and haven’t had the incentive to develop new projects given low spot prices.

That path of least resistance in 2020 appears to be for metals prices to continue to move higher. And in the event of a political, geopolitical, or a financial black swan, they could spike much, much higher.

Well now, without further delay, let’s get right to this week’s interview Money Metals president Stefan Gleason did with Alan James on Sustainable Money.

Stefan Gleason

Alan James: Hello everyone and welcome to another edition of Sustainable Community Summit. The title of our program today is Gold and Silver Buying Made Easy. Stefan Gleason is president of Money Metals Exchange. That’s a national precious metals investment company and news service with over a million readers, seventy-five thousand paid subscribers and one hundred, twenty million in annual sales.

Previously, Gleason served as vice president of the National Right to Work Legal Defense Foundation in Springfield, Virginia. As the first strategic litigation organization in the individual rights and free enterprise movement, the foundation has led the national legal battle to block to expansion of union special privileges. Gleason has frequently appeared on national television shows and networks such as Fox News channel’s O’Reilly Factor and Special Report with Brit Hume. CNBC’s Closing Bell, Christian Broadcasting Network, CNN and CSPAN’s Washington Journal. Gleason’s commentary has appeared in Wall Street Journal, Newsweek, TheStreet.com, Seeking Alpha and National Review among thousands of other national state and local newspapers, wire services and internet sites.

He’s a seasoned business leader, investor, political strategist and grassroots activist. That’s quite a resume there Mr. Gleason. Stefan Gleason, welcome to the program.

Stefan Gleason: Thank you, thank you, well you know the key theme there is that I love freedom and I’m very concerned about big government and so my entire career has been spent in the work of trying to you know loosen the shackles of big government and also help people take steps to protect themselves from it and that’s why what I’m doing today in the last seven years since we founded Money Metals Exchange of helping people diversify their money outside of the financial system and get some real wealth in the form of gold and silver. And that’s why that’s been such satisfying work because it is a big part of individual liberty and freedom.

Alan James: It would be fair to say I think that we’re talking about insurance today aren’t we?

Stefan Gleason: Well and that exactly is one of the main characteristics of precious metals. Precious metals are insurance. It’s financial insurance and you know everybody should own insurance. They have insurance on their house, they probably have insurance on your car, should have insurance against financial turmoil and inflation and market crashes. And gold and silver are excellent forms of insurance and unfortunately very few people own it still.

Alan James: What are precious metals and why should someone own precious metals? Now we’ve touched on that but go into some more detail.

Stefan Gleason: Sure. Well of course as I mentioned already insurance is one of the aspects, one of the qualities of precious metals. It’s a form of financial insurance but really most fundamentally gold and silver, in particular, are money and they have been chosen as money by the free market for thousands of years. Ever since we’ve moved beyond sort of a basic barter economy, gold and silver which have certain qualities we can discuss in a moment, have been chosen as a medium of exchange and as money in trade and that’s because it’s got a number of unique characteristics.

First of all, it’s rare. Gold and silver are hard to get. Of course, there’s platinum and palladium as well, which are even more rare but gold and silver are very rare metals. They take real work to obtain, to get out of the ground, to mint and refine and there are not many gold and silver discoveries being made of any substance, certainly not the size of years ago. So, gold and silver are rare commodities. And they also have of course beauty. They’re desired. They’ve been viewed as wealth and viewed as money for thousands of years so they have tremendous history going for them. They have quality, unlike say a diamond, where if you cut up a diamond it becomes worth less than if it’s in tact in a larger unit. Gold and silver are divisible. You know you can cut it in half, cut in a quarter, it doesn’t diminish it’s value except by the proportion that you’ve reduced it.

So, it’s divisible. It’s fungible. Every ounce of gold is exactly the same and maybe in a different form but it’s still the same element. None is really better than any other when it comes to pure gold. Gold is gold, silver is silver. It’s also compact, it’s portable and all of these things have made it very good money. And it’s been a way of storing purchasing power and moving beyond a pure barter type economy where say you know you have eggs and you need butter, you know you need to find the guy who has the butter who wants the eggs and that’s not very efficient. So you can move to something like gold and silver as a medium of exchange and it creates a much more efficient economy and allows people to you know specialize and store that purchasing power that they’ve developed over time.

So for a variety of reasons, gold and silver have been selected as money and insurance, it’s a store of value and it’s a form of money that cannot be devalued or debased in the same way because of the work and effort that it takes to create it. So that’s one of the many you know aspects of gold and silver that have caused it to be for thousands of years used as money.

Alan James: Stefan, I have four highly educated kids and I want to use them as an example here to lead into a question. None of them really knew what fiat currency was when I asked them the other day, I think that’s not uncommon by the way, would you explain to us what fiat currency is and the history of fiat currency?

Stefan Gleason: Sure. Well, it goes back hundreds of years but basically fiat essentially means government decree. So fiat currency is currency that derives its value through force, through compulsion, through government decree. So fiat currency is really what we have today. It’s not backed by anything other than a promise to pay of the federal government and your ability to persuade someone else to part with things of value in exchange for these Federal Reserve Notes that we call money. It was an evolution. It goes back several hundred years with the silversmiths and the goldsmiths who had secure locations, their shops or whatever to you know they were involved in the trade of jewelry and gold and silver and so people would you know store their metals there and they would be issued receipts, warehouse receipts or storage receipts and they would carry those around and people realized that “well I can exchange this receipt, I can pay somebody. I don’t have to carry around the gold and hand it to somebody. I can just give them this receipt and they can go and you know collect the funds because the goldsmith will give them the gold if they show up with the receipt.”

Well, you know this is kind of the beginning of modern central banking. It started with gold backing and the idea that this money that you carry, this currency or paper money that you carry around is redeemable and can be turned in. Well, then a lot of abuses developed. The people that issued these receipts just realized that not everybody shows up on the same day trying to get their gold so maybe we can issue more receipts for this money than or for this gold or silver than there may be gold or silver in the vault. And that’s kind of where we got into fractional reserve banking, which is essentially our system today. Except that it’s gone further and the entire link with gold and silver has been broken. And that started really, there were episodes of this in the seventeen and eighteen hundreds, starting with the continental dollar which was not a backed currency and there was a huge inflation right before, right after the founding of the country, before the Constitution was enacted during the Articles of Confederation.

And then also prior to the freedom from the British crown, so there were many episodes of paper money that did not go well and the founders of country initially set up a system that was supposed to prevent against central bank abuse, of printing of money that was not redeemable and they set up a gold standard and that’s how the country operated for most of the first hundred and fifty years of its existence.

Alan James: And then it changed.

Stefan Gleason:Yeah, the Federal Reserve Act. There was an experiment with that right after the Civil War where they went off the gold standard and then they printed a whole bunch of money that was not backed and then they tried to go back and they didn’t increase the price of gold so there was a deflation. Everybody stopped spending and going right into gold because gold was underpriced because there was so much extra currency. But it basically went off the rails in 1913 with the Federal Reserve Act, the Federal Reserve system that was created where, essentially, they put the power of currency printing into the hands of private banking interests. The Federal Reserve is basically a privately owned banking cartel that is owned by banks that has the power, has been granted the power by Congress or at least default has taken the power to issue our money and they are called Federal Reserve notes. They are no longer backed by anything since 1933 when FDR confiscated gold during the Great Depression.

He banned the private ownership of gold in the United States, which is an extraordinary thing. Most people don’t even realize it that for about forty years, it was illegal to own more than five ounces of gold in the United States unless it was in the form of jewelry or rare coins. And they did that because at the time they still had to have gold in the treasury to issue new fiat money or paper money against it. And so they seized the gold or at least forced people to turn it in and then they devalued the dollar by over fifty percent.

And it was a long path since then. In 1973, Nixon or 1971 I should say, Nixon broke the last link to gold by saying that our dollar was no longer redeemable in gold, even if central banks across the world wanted to come and turn in their dollars and get gold, which is the promise we made after World War II at the Bretton Woods Treaty or Agreement, where the dollar was going to be as good as gold, everybody could use the dollar, use it as a reserve currency. Just show up in New York with your dollars and we will give you our gold. Well a lot of countries started taking us up on that in the 1960’s and early 70’s when they saw us going through a lot of inflation and big government spending with the great society and so forth and they wanted their gold and gold was flowing out of the treasury and that’s when Nixon broke the last link to gold between Federal Reserve note and gold.

And since then we’ve been on a completely fiat, completely floating non-backed currency system and that’s also a point when debt exploded, government debt exploded and went like a hockey stick to astronomical levels. Federal, state and private debt has all gone through the roof since then. And a lot of the reason for that is that we no longer have the discipline that gold and silver bring to a monetary system.

Alan James: And we know from experience that most fiat currencies have failed over the last several hundred years so I’ll let our audience add one and one there and come up with their own conclusion.

Alright, in your estimation Stefan, which precious metals are the best to invest in and why invest in them?

Stefan Gleason: Well let’s start with the why. You know we talked about the devaluation of the dollar but just to emphasize that, since we went off that gold redeemability in the early 70’s, we’ve had over a ninety percent decline in the purchasing power of the Federal Reserve note. Since the Federal Reserve was created over a hundred years ago, it’s more like a ninety-seven percent decline in the value of Federal Reserve note or the dollars as they call it. And that’s an astronomical amount of inflation and so that means that if you’re saving your money in dollars, particularly at the interest rates you’re seeing today, you’re losing purchasing power every moment. So one of the big reasons to own precious metals is to hedge against inflation that is built into the system, it’s pretty much a planned activity that is being used to sort of cushion the overarching amount of debt that we have.

And that’s just a policy, we have a policy of serial inflation in the United States thanks to Federal Reserve system and the Wall Street bankers. On top of that you now have the war on cash, so not only do you have low or zero percent interest rates as the value of holding dollars declines and the dollar itself declines, but now we’re seeing a situation where you have banks, especially in Europe and that’s being talked seriously about here in the United States, of going to negative interest rates on dollars or on currency. So the idea that you would give the bank money, you would pay the bank interest to borrow your money instead of the other way around.

So you have a war on cash, in conjunction with that, they’re talking about even banning cash because if it pays negative two percent to own cash in the bank, a lot of people will take out the cash, stuff it under the mattress and get a higher yield at zero percent. So in conjunction with a policy of negative interest rates, which is being seriously discussed and in fact, is actually occurring in some areas of the world you’re actually having a discussion, a serious discussion about banning physical cash. So all of these things combined with financial instability, market crashes, are very good reasons to be owning some real money outside of the banking system in the form of gold and silver.

So, in terms of which ones to invest in, I would suggest and we can get into more detail on this but I would suggest start with silver and then move to gold as you already started to own silver.

Alan James: Radio and television is just bombarded with commercials from various companies selling precious metals and that is a good lead in to this question. What’s the biggest mistake that people make when investing in precious metals?

Stefan Gleason: Yeah, well this is really a disturbing aspect and it was one of the reasons I founded the company, actually the main reason, seven years ago. And that is that unfortunately we talked about very few people currently own gold and silver but there is you know increasingly discussion on television, radio, people starting to think about gold and silver, a lot of advertising for gold and silver and it’s hard for people to make that first step into owning it because some people think it’s maybe unpatriotic not to own dollars. “Aren’t you betting against the U.S.? We love our country.”

So people are reluctant and it’s a psychological thing. So, fortunately people are seriously taking steps, not enough, but it’ll get there but there are people and fortunately they’re the most ubiquitous, particularly on television who then take those people who have finally made the decision fortunately to diversify their cash into gold and silver. And then at the last second, they do a bait and switch and they try to get you to buy rare or so called collectible or numismatic or commemorative or proof coins. And these things are not what you should be buying.

Basically that’s artwork. That’s like buying artwork. There’s a very subjective value, above and beyond the actual melt value of the metal and you need to avoid any kind of rare or collectible or numismatic or commemorative or even proof coin unless you can buy it at the actual or very close to the actual melt value of precious metals, of the gold or silver that’s contained in it. Everything else is very subjective and we have people who lose thirty or forty percent pretty much the day they buy it because if they try to sell it back the same day they take a huge haircut and unfortunately that’s one of the things that’s happening but it is the biggest mistake that people are making is that they are being suckered into these schemes to buy so called rare coins.

Alan James: Okay so let me give you an example. Let’s say that someone is ready to buy some gold and silver, and I do believe those numbers are increasing and this person knows that they should be avoiding any type of numismatic or proof coins. Now what denominations, sizes, or weights, I want some specifics here, what denominations, sizes, weights of those precious metals are best to own and hold on to?

Stefan Gleason: Well I’d say the first principal that we espouse when it comes to choosing what to buy is we encourage people to buy the things that have the lowest premium above the actual melt value of the metal. You want to buy as many gold or silver ounces as you can for your money. So in keeping with that idea, generally that means that first stay away from the rare and proof coins because those are hugely marked up above the spot price. But the next step would be well about Silver Eagle bullion coins versus silver rounds versus silver bars, things like that.

The things that are the cheapest, vis-a-vis the spot price of the metal, which is totally transparent, around the clock, seven days a week, you know how much an ounce of silver is worth on the global market. You know how much an ounce of gold is worth. The things that are closest to that tend to be the silver rounds and silver bars and the gold bars. Start with smaller increments, particularly if you don’t have much to start with, to put into precious metals. Don’t buy a 100 ounce bar because that means you have to make one right decision on when to sell it and you can’t sell part of it, you couldn’t easily barter with it so you probably want to buy smaller increments to begin with and again, I think you should favor silver over gold, at least initially.

Probably one ounce and even smaller such as a fractional, tenth ounce or half ounce silver round. There’s also the Pre-1965 dimes, quarters and half dollars which are 90% silver and they’re basically priced based on their metal content with a small premium. Those are very popular because they’re a small increment. If there’s a real crisis and you actually have to use your precious metals as money in transactions, you know you’ve got some small units that you can use. So I would say start with the small, one ounce and smaller sizes in both gold and silver and probably favor silver rounds and bars and gold bars over the coins. But as long as you stay away from rare coins and commemorative coins, you pretty much can’t go wrong because you’re not getting ripped off. You’re getting an ounce of gold or silver relatively close the actual market price.

Alan James: To put into real life what you’re saying, let’s just say that our fiat currency failed and you needed to go somewhere to buy some vegetables, you don’t want to have to give them an ounce of gold or a one ounce gold coin for some veggies because the values are very disproportionate but if you have some smaller silver rounds, then it’s easy to trade, correct?

Stefan Gleason: Yeah, exactly. And there are tenth ounce gold rounds, there’s even twentieth of an ounce gold coins out there and then there’s half ounce and quarter ounce and tenth ounce silver. So, at the current prices, a tenth ounce of silver is worth a little over two dollars with the premium that comes with that so that’s a small amount but it’s you could probably, you’d probably need something like that if you’re going to buy a head of lettuce or whatever. So, you want to always have at least some of the small stuff. Once you get beyond that, then you can start looking at the bars, more gold perhaps but start with the smaller stuff, start with silver and start with one ounce and fractional sizes.

Alan James: Is there any reason why an investor might consider a foreign origin coin or foreign bullion for that matter versus American bullion or coin?

Stefan Gleason: Especially with regard to the gold, and even the silver coins, a lot of foreign coins actually are a better value than the Gold Eagle or Silver Eagle, you can get gold Krugerrands, which is South African gold coin. You can get Canadian Maple Leafs, both gold or silver in that and you can get Australian Kangaroos and some of these other coins out there that are lower premiums per ounce than say a U.S. Gold Eagle. So, in keeping with the idea that you probably want to get, favor the things that have the lower premiums, buying foreign gold coins are just fine.

Now some people prefer the higher recongnizability of a U.S. minted coin. Technically, although it’s kind of academic, it has a face value that’s you know that’s in dollars. Of course, you would never spend it for that so like the 1-oz Gold Eagle is worth about $1,300, but it’s got a $50 face value on it. So, people do like the credibility of the U.S. mint being stamped on it but at the end of the day, gold is gold and silver is silver and as long as you’ve got something that’s authentic then it really doesn’t matter.

Alan James: Is there an industry “best place” to acquire it from type of list that a would be investor might consider comparing?

Stefan Gleason: Okay well there are certainly a lot of options out there on the internet. If you search on “buy silver” you’ll see us and a few other competitors come up. Pretty much the ones that you find when you search, are the ones that are selling the bullion as opposed to the rare coins. So that’s good. At least the rare coin bait and switch people are not dominating when it comes to internet searches. Maybe they haven’t figure out that model yet, but the bottom line is you know you want to look for people that have good prices but you don’t want that to be the only deciding factor because there are some other factors that you need to look out for and we can get into that.

Alan James: Is there a place that’s always at or below the best price of anyone else?

Stefan Gleason: Well there was one. A couple of years ago there was a company called Tulving and Company, which then went out of business because they had made some big mistakes and they were always undercutting people and they were a badly managed business and they went bankrupt and over twenty million dollars’ worth of gold and silver was not delivered to people.

Alan James: And I think that’s one of the things people are concerned about so I’m glad we’re talking about this.

Stefan Gleason: Well you know here’s the thing you need to be doing. First, you need to probably look around and get on a few email lists. Money Metals Exchange has a tremendous amount of content. We spend a lot of effort trying to educate and keep people informed. And I think that distinguishes us from a lot of our competitors because we’re also a publisher and we do a lot of education. But, there are other good companies of course out there and I think the thing is that you want to look at what do they say? What are they talking about on their website? Is there pricing transparent? I mentioned the Tulving situation, sure they had great prices but that doesn’t do you any good if you don’t get delivery.

So the thing that’s more important than pricing is finding a dealer who’s not going to rip you off and that you’re actually going to get what you ordered and you’re going to get it quickly. And the way that I recommend people approach that is start small and just observe. Find a dealer, hopefully Money Metals Exchange or somebody like us and make an order and see how good the communication is, see how they meet their commitments or don’t. Make sure the pricing is what you agreed to, make sure delivery is quick. In most cases, there’s really no justification for delivery delay other than waiting for your check to clear, which you know there has to be a certain amount of clearing time for check. But the bottom line is you want to start small and then see how people do. If you don’t already have a relationship, you don’t want to go all in at once for a variety of reasons at first.

Not that there are many rip offs out there. I don’t want to create that impression. It is quite rare still but it can happen. But that’s not the only reason that you want to start small. Another is that you don’t want to put all your money into the market at once. Unless you don’t own any at all, you don’t necessarily need to buy it right now. If you don’t own anything at all, you should just buy, buy some but don’t put all your money in. Do it over a few months. Do it in increments and one of the benefits of that is that you get dollar cost averaging as you enter the markets, you don’t have to pick it exactly right. Another is of course you get the opportunity to see how the dealer performs and hopefully they exceed or at least meet their expectations. And get to know the people, look them up on BBB. See what kind of complaints there are.

There are some review sites out there. There’s one called bullion.directory which has reviewed literally like five hundred dealers in the United States and they’ve looked at their websites, they’ve talked to their people, there are some reviews from customers on many of the company profiles, including ours. We were honored by them and selected a year ago as Precious Metals Dealer of the Year in the United States. We were proud to win that. There was somebody who won it again last year and now we’re in the top five for this year so we’re right up there at the top but there’s a lot of good dealers out there and you just need to be careful and make sure that people are meeting their commitments and are transparent.

Alan James: Is there anything more important that you can think of than choosing the right product and getting that right product for a low price?

Stefan Gleason: Yeah, well and that’s the main thing I emphasized a moment ago was delivery. Getting delivery. It doesn’t matter if you saved five cents per ounce on your order if you don’t get it.

Mike Gleason: You’ve just heard the first half of Stefan’s informative interview, we hope you enjoyed it. We’ll play the conclusion of his conversation with Alan James during a future podcast.

Well that will do it for this week. Be sure to check back here next Friday for our next Weekly Market Wrap Podcast. Until then, this has been Mike Gleason with Money Metals Exchange. Thanks for listening and have a great weekend everybody.


The Money Metals News Service provides market news and crisp commentary for investors following the precious metals markets.

Seychelles keeps loosened stance on modest inflation

By CentralBankNews.info
The Central Bank of Seychelles (CBS) will maintain a loosened monetary policy stance in the first quarter of 2020 citing a “modest” inflation outlook despite double-digit growth in average monthly earnings that boosts domestic demand and a rise in credit to the private sector.
But the central bank said on Dec. 27 external inflationary pressures are moderate due to weak growth in global commodity prices as compared with 2018 and there was even a decline in some forecasted prices since the previous policy decision in September.
In addition, the Seychelles rupee has remained stable against the U.S. dollar and the annual growth in tourism earnings has slowed from last year so CBS concluded inflationary pressures are not expected to reach levels that would threaten its objective of price stability.
On Sept. 23 CBS loosened its policy stance for the fourth quarter of 2019 by cutting its monetary policy rate by 50 basis points to 5.0 percent to support economic activity given the expectations of “modest inflationary pressures in the short to medium term.”
Inflation in the Seychelles, a group of 115 islands in the western Indian Ocean, rose to 1.7 percent from 1.2 percent in October for a 12-month average of 1.9 percent.
Tourism is a major contributor to the country’s economy and as of Dec. 15 year-to-date visitor arrivals were up 5.6 percent and year-end tourism earnings are seen higher than in 2018.
But growth in 2019 tourism is still seen below the forecast of 6.0 percent, with 2020 growth projected of 4.2 percent.
A 5 percent government pay rise in April and a 10 percent rise in minimum wages has helped underpin demand and provisional date for November indicate private sector growth of 19 percent from November 2018, and double-digit private sector credit growth is forecast for 2020.
Employment earnings have also grown an annual 15 percent in the second quarter of 2019 and if such growth levels were to be sustained, this could lead to additional demand pressures via the exchange rate and credit channels, and thus have inflationary effects, CBS said, adding:
“Nevertheless, early indicators suggest slowdowns in the income growth and credit to households, thereby limiting the probability of inflationary effects in the short tun.”
In January CBS revised its monetary policy framework and began targeting interest rates, steering them through open market operations, from a quantitative target of reserve money as part of its move to modernize monetary policy.
As part of this change, CBS launched a Monetary Policy Rate (MPR), setting it at 5.50 percent for the first quarter of 2019. MPR will also lie at the centre of an interest rate corridor.

The Central Bank of Seychelles issued the following statement:

“Monetary Policy Rate is maintained at 5.0 per cent for Q1 2020

The Board of the Central Bank of Seychelles (CBS) has decided to maintain its loosened Monetary Policy stance for the first quarter of 2020, given the modest inflation outlook in the short to medium term.

On the external front, moderate inflationary pressures are expected on account of weak growth in global commodity prices relative to 2018 and noted declines in forecasted prices since the previous Monetary Policy decision. In addition, the Seychelles rupee (SCR) has remained relatively stable against the US dollar.

On the domestic front, the annual growth in tourism earnings have slowed down compared to the same period last year. In addition, published statistics on employee income, officially referred to as average gross monthly earnings, show a double-digit growth compared to 2018. This supports conditions for an increase in demand pressures, as reflected in the sustained rise in credit to the private sector. Despite these developments, inflationary pressures are not expected to reach levels that will threaten the Bank’s primary objective of promoting domestic price stability.

The decision to maintain the loosened monetary policy stance for the first quarter of 2020 was taken at the Monetary Policy meeting held on Monday December 23, 2019. Consistent with this decision, the CBS Board has kept the Monetary Policy Rate (MPR) at 5.0 per cent. The interest rate on the Standing Deposit Facility (SDF) and the Standing Credit Facility (SCF) will also remain unchanged at 2.0 per cent and 8.0 per cent, respectively.

Slowdown in external inflationary pressures
Global commodity prices, particularly food, is expected to rise albeit at a lower level compared to the previous quarter. With regards to oil prices, forecasts range from a slight rise to a slight decline in prices for 2020 relative to 2019, primarily due to weak global demand. Recent decisions to cut production levels by the Organisation of Petroleum Exporting Countries (OPEC) is expected to be offset by non-OPEC members increasing or maintaining current levels of production. However, developments in the international oil markets remain prone to supply shocks.

Slowdown in the tourism sector and revised earnings estimate
The tourism industry remains a key contributor to the country’s economic performance. As at December 15, 2019, the year-to-date growth in visitor arrivals stood at 5.6 per cent with end of year tourism earnings expected to be higher than in 2018. However, when considering that the end-November 2019 arrivals classified under “Holiday” increased by a moderate 2.6 per cent, coupled with an underperformance in select markets and a weaker euro globally, the annual increase in tourism earnings has slowed down. As such, the growth in tourism earnings for 2019 is expected to be below the previous forecast of 6.0 per cent, with a projected growth of 4.2 per cent in 2020.

Double-digit growth in credit to the private sector
Provisional statistics for November 2019 indicate a growth of 19 per cent in credit allocated to the private sector in comparison to November 2018. This was primarily due to increases in credit disbursed in the categories of ‘tourism’‘mortgages’ and ‘individuals & households.’ Growth in the latter two categories are linked to a period of sustained growth in employee income, which has improved access to credit by individuals and households. A moderation is expected in employee income growth, which would support conditions for a slowdown in the growth of household debt. However, double digit private sector credit growth is forecasted for 2020, in part due to sustained demand from other market segments. With regards to interest rates development, as at December 19, 2019, the average on the 7-day Deposit Auction Arrangement (DAA) was 5.14 per cent, while the yield on the 91-day Treasury Bills was 5.22 per cent, compared to 4.89 per cent at the end of the second quarter of 2019.

Recent Rise of income growth is forecasted to moderate
In comparison to the second quarter of 2018, employee income, also referred to as employment earnings, has grown by 15 per cent in the second quarter of 2019. If current growth levels are sustained, this could lead to additional demand pressures via the exchange rate and credit channels. Therefore, such growth levels will likely have inflationary effects and potentially, impact overall labour productivity. Nevertheless, early indicators suggest slowdowns in the income growth and credit to households, thereby limiting the probability of inflationary effects in the short run.

Modest increase in the inflation rate expected in the short run
Inflationary pressures have remained subdued for 2019. In November 2019, year-on-year headline inflation stood at 1.7 per cent, with the 12-month average rate at 1.9 per cent. Despite a recent slowdown in the growth of tourism earnings and potential second round effects of a rise in employee income, this is not expected to lead to excessive inflationary pressures in the short to medium run.

The MPR will remain at 5.0 per cent. As such, the interest rate on the SDF will be kept unchanged at 2.0 per cent, and that on the SCF will remain at 8.0 per cent. The Minimum Reserve Requirement (MRR) remains unchanged at 13 per cent of applicable deposit liabilities.

The CBS remains vigilant and stands ready to adjust its policies as needed to promote price stability.”

    www.CentralBankNews.info


Exploration Firm Returns ‘More Positive Assay Results’ at Quebec Project

By The Gold Report

Source: Streetwise Reports   12/24/2019

The latest findings are reviewed in an Echelon Wealth Partners report.

In a Dec. 16 research note, Echelon Wealth Partners analyst Ryan Walker reported that Osisko Mining Inc.’s (OSK:TSX) recent drill results showed the “Lynx zone growls.” The Lynx deposit is part of Osisko’s Windfall Lake gold project in Quebec.

Walker reviewed the new results, which are from one surface and six wedge holes at Lynx.

He highlighted that one of the wedge holes, OSK-W-19-1731-W2, returned the highest-grade metal factor (grade times length) ever encountered at Windfall. It showed 1,475 grams per ton (1,475 g/t) gold uncut over 4.6 meters (4.6m), from 882.7m downhole, including 8,030 g/t gold uncut over 0.7m from 886.3m downhole. Because the zone remains open downplunge, Osisko plans to drill more there.

(That particular hole is about 50m up-plunge of previously reported hole OSK-W-19-2069-W2 that showed 8m of 161 g/t gold.)

Walker provided numerous additional intercepts from this same batch of recent holes. Among them were 2.5m of 37.5 g/t and 1m at 237 g/t from OSK-W-19-1181-W12 and 2.5m of 22.3 g/t from OSK-W-19-2068-W3. Grades are uncut, and true widths are an estimated 55–80% of reported core intervals.

Results from previous recent bulk sampling in Lynx zone 311 showed “an impressive 89% positive grade bias with a 5,716 ton sample averaging 17.8 g/t Au,” indicated Walker.

Considering the results from bulk sampling and drilling together, he wrote, “We contend that combined, the latest results demonstrate the potential for the application of a possibly too aggressive top cutting factor and for higher-grade blow-outs during any eventual production at Windfall.”

Echelon has a Speculative Buy rating and a CA$3.80 per share target price on Osisko Mining. The company’s current share price is about CA$3.59.

Sign up for our FREE newsletter at: www.streetwisereports.com/get-news

Disclosure:
1) Doresa Banning compiled this article for Streetwise Reports LLC and provides services to Streetwise Reports as an independent contractor. She or members of her household own securities of the following companies mentioned in the article: None. She or members of her household are paid by the following companies mentioned in this article: None.
2) The following companies mentioned in this article are billboard sponsors of Streetwise Reports: None. Click here for important disclosures about sponsor fees.
3) Comments and opinions expressed are those of the specific experts and not of Streetwise Reports or its officers. The information provided above is for informational purposes only and is not a recommendation to buy or sell any security.
4) The article does not constitute investment advice. Each reader is encouraged to consult with his or her individual financial professional and any action a reader takes as a result of information presented here is his or her own responsibility. By opening this page, each reader accepts and agrees to Streetwise Reports’ terms of use and full legal disclaimer. This article is not a solicitation for investment. Streetwise Reports does not render general or specific investment advice and the information on Streetwise Reports should not be considered a recommendation to buy or sell any security. Streetwise Reports does not endorse or recommend the business, products, services or securities of any company mentioned on Streetwise Reports.
5) From time to time, Streetwise Reports LLC and its directors, officers, employees or members of their families, as well as persons interviewed for articles and interviews on the site, may have a long or short position in securities mentioned. Directors, officers, employees or members of their immediate families are prohibited from making purchases and/or sales of those securities in the open market or otherwise from the time of the interview or the decision to write an article until three business days after the publication of the interview or article. The foregoing prohibition does not apply to articles that in substance only restate previously published company releases.

Disclosures from Echelon Wealth Partners, Osisko Mining Inc, December 16, 2019

Echelon Wealth Partners compensates its Research Analysts from a variety of sources. The Research Department is a cost centre and is funded by the business activities of Echelon Wealth Partners including, Institutional Equity Sales and Trading, Retail Sales and Corporate and Investment Banking.

I, Ryan Walker, hereby certify that the views expressed in this report accurately reflect my personal views about the subject securities or issuers. I also certify that I have not, am not, and will not receive, directly or indirectly, compensation in exchange for expressing the specific recommendations or views in this report.

Important Disclosures:
Is this an issuer related or industry related publication? Issuer.

Does the Analyst or any member of the Analyst’s household have a financial interest in the securities of the subject issuer? No

The name of any partner, director, officer, employee or agent of the Dealer Member who is an officer, director or employee of the issuer, or who serves in any advisory capacity to the issuer. No

Does Echelon Wealth Partners Inc. or the Analyst have any actual material conflicts of interest with the issuer? No

Does Echelon Wealth Partners Inc. and/or one or more entities affiliated with Echelon Wealth Partners Inc. beneficially own common shares (or any other class of common equity securities) of this issuer which constitutes more than 1% of the presently issued and outstanding shares of the issuer? No

During the last 12 months, has Echelon Wealth Partners Inc. provided financial advice to and/or, either on its own or as a syndicate member, participated in a public offering, or private placement of securities of this issuer? Yes

During the last 12 months, has Echelon Wealth Partners Inc. received compensation for having provided investment banking or related services to this Issuer? Yes. Advisor on spinout of non-core assets to Chantrell Ventures Corp.

Has the Analyst had an onsite visit with the Issuer within the last 12 months? No

Has the Analyst or any Partner, Director or Officer been compensated for travel expenses incurred as a result of an onsite visit with the Issuer within the last 12 months? No

Has the Analyst received any compensation from the subject company in the past 12 months? No

Is Echelon Wealth Partners Inc. a market maker in the issuer’s securities at the date of this report? No

( Companies Mentioned: OSK:TSX,
)

Analyst: Acquisition Accretive for Oklahoma Energy Company

The Energy Report

Source: Streetwise Reports   12/24/2019

The favorable metrics of the transaction are discussed in a Raymond James report.

In a Dec. 16 research report, Raymond James analyst John Freeman reported that WPX Energy Inc.’s (WPX:NYSE) stock price jumped 9% on news of its acquisition of Felix Energy and with good reason, as the transaction is accretive to the hydrocarbon explorer. As such, Raymond James increased its target price on WPX to $17 per share from $15 and reiterated its Strong Buy rating.

Freeman reviewed the transaction specifics, noting that what WPX paid for Felix was below consensus’ expectation. The total consideration of $2.5 billion consisted of $900 million in cash and $1.6 billion worth of WPX shares. Through the deal, WPX gains “premier acreage,” about 1,500 undeveloped locations over 58,500 net acres in eastern, oilier Winkler, Ward and Loving counties in the Delaware Basin.

“Assuming $30,000 per flowing barrel for the expected production at close [early Q2/20], the transaction price implies a per acreage valuation of about $12,000,” the analyst explained. “On a 2020 enterprise value:EBITDA basis, WPX Energy paid about 3.5x, comparing favorably with consensus pre-deal for WPX at about 5x.”

While WPX will fund part of the acquisition by issuing about $900 million in senior notes, the transaction ultimately should be leverage neutral due to the expected, resulting boost in revenue.

Freeman also highlighted that WPX Energy’s management and Raymond James agree that the transaction immediately increases cash flow per share (CFPS), earnings per share (EPS), free cash flow per share, return on capital employed, and cash margins, assuming a $50 oil price and no operating efficiencies. In reality, ample synergies are expected from the merged companies.

Raymond James expects WPX to generate, in 2020, about $200 million in free cash flow (FCF) assuming a $50 West Texas Intermediate (WTI) oil price, and about $500 million at $60 WTI, on a pro forma basis. “At strip oil pricing, our model has the operator generating about $350 million in FCF!” added Freeman.

With part of the FCF, Freeman pointed out, management plans to initiate a post-closing dividend, aiming for about $0.10 per share on an annual basis to start. It also intends to conduct favorable buybacks and reduce leverage to 1x by year-end 2021.

Sign up for our FREE newsletter at: www.streetwisereports.com/get-news

Disclosure:
1) Doresa Banning compiled this article for Streetwise Reports LLC and provides services to Streetwise Reports as an independent contractor. She or members of her household own securities of the following companies mentioned in the article: None. She or members of her household are paid by the following companies mentioned in this article: None.
2) The following companies mentioned in this article are billboard sponsors of Streetwise Reports: None. Click here for important disclosures about sponsor fees.
3) Comments and opinions expressed are those of the specific experts and not of Streetwise Reports or its officers. The information provided above is for informational purposes only and is not a recommendation to buy or sell any security.
4) The article does not constitute investment advice. Each reader is encouraged to consult with his or her individual financial professional and any action a reader takes as a result of information presented here is his or her own responsibility. By opening this page, each reader accepts and agrees to Streetwise Reports’ terms of use and full legal disclaimer. This article is not a solicitation for investment. Streetwise Reports does not render general or specific investment advice and the information on Streetwise Reports should not be considered a recommendation to buy or sell any security. Streetwise Reports does not endorse or recommend the business, products, services or securities of any company mentioned on Streetwise Reports.
5) From time to time, Streetwise Reports LLC and its directors, officers, employees or members of their families, as well as persons interviewed for articles and interviews on the site, may have a long or short position in securities mentioned. Directors, officers, employees or members of their immediate families are prohibited from making purchases and/or sales of those securities in the open market or otherwise from the time of the interview or the decision to write an article until three business days after the publication of the interview or article. The foregoing prohibition does not apply to articles that in substance only restate previously published company releases.

Disclosures from Raymond James, WPX Energy Inc., December 16, 2019

ANALYST INFORMATION

Analysts Holdings and Compensation: Equity analysts and their staffs at Raymond James are compensated based on a salary and bonus system. Several factors enter into the bonus determination, including quality and performance of research product, the analyst’s success in rating stocks versus an industry index, and support effectiveness to trading and the retail and institutional sales forces. Other factors may include but are not limited to: overall ratings from internal (other than investment banking) or external parties and the general productivity and revenue generated in covered stocks.

The analyst John Freeman, primarily responsible for the preparation of this research report, attests to the following: (1) that the views and opinions rendered in this research report reflect his or her personal views about the subject companies or issuers and (2) that no part of the research analyst’s compensation was, is, or will be directly or indirectly related to the specific recommendations or views in this research report. In addition, said analyst(s) has not received compensation from any subject company in the last 12 months.

RAYMOND JAMES RELATIONSHIP DISCLOSURES
Certain affiliates of the RJ Group expect to receive or intend to seek compensation for investment banking services from all companies under research coverage within the next three months.

Raymond James & Associates, Inc. makes a market in the shares of WPX Energy, Inc.

Additional Risk and Disclosure information, as well as more information on the Raymond James rating system and suitability categories, is available here.

( Companies Mentioned: WPX:NYSE,
)

Northern Star Resources, Tesla, LNG & Goodyear Tire lead Weekly Top Gainers/Losers

By IFCMarkets

Top Gainers – The World Market

1. Northern Star Resources Ltd – an Australian gold mining company.

2. Tesla Motors Inc. – an American manufacturer of electric vehicles and space technology.

market sentiment ratio long short positions

 Top Losers – The World Market

1. Liquefied Natural Gas Limited – an Australian liquefied natural gas terminal.

2. Goodyear Tire & Rubber Company – an American tire manufacturing company.

market sentiment ratio long short positions

 Top Gainers – Foreign Exchange Market (Forex)

1. NZDUSD, NZDCAD – an increase in these charts means the strengthening of the New Zealand dollar against the US and Canadian dollars.

2. NZDCHF, AUDCHF – an increase in these charts indicates the weakening of the Swiss franc against the New Zealand and Australian dollars.

market sentiment ratio long short positions

 Top Losers – Foreign Exchange Market (Forex)

1. GBPNZD, GBPAUD – a decrease in these charts means the weakening of the British pound against the New Zealand and Australian dollars.

2. EURZAR, EURNZD – a decrease in these charts indicates the weakening of theeuro against the South African rand and the New Zealand dollar.

market sentiment ratio long short positions

Market Analysis provided by IFCMarkets

Note:
This overview has an informative and tutorial character and is published for free. All the data, included in the overview, are received from public sources, recognized as more or less reliable. Moreover, there is no guarantee that the indicated information is full and precise. Overviews are not updated. The whole information in each overview, including opinion, indicators, charts and anything else, is provided only for familiarization purposes and is not financial advice or а recommendation. The whole text and its any part, as well as the charts cannot be considered as an offer to make a deal with any asset. IFC Markets and its employees under any circumstances are not liable for any action taken by someone else during or after reading the overview.

Soybeans Analysis: Higher Chinese imports bullish for soybean price

By IFCMarkets

Higher Chinese imports bullish for soybean price

China has increased US soybeans purchases recently. Will the soybean prices continue rising?

China has increased purchases of United States soybeans last month. China bought 2.56 million tons of US soybeans in November, compared to no purchases at all a year ago and 1.147 million tons in October. Purchases of Chinese buyers increased in last couples of months after Beijing issued tariff-free quotas in a goodwill gesture to Washington. And purchases from Brazil fell 24% from 5.07 million tons in November last year. Higher export demand is bullish for soybean prices. At the same time smaller Chinese pig herds after African swine fever disease decimated China’s massive pig herd is a downside risk, However Chinses officials report country’s pig herd has started to recover in recent months.

SOYBEAN rising above MA(200) 12/27/2019 Technical Analysis IFC Markets chart

On the daily timeframe the SOYB: D1 is rising above the 200-day moving average MA(200), which is rising too.

  • The Parabolic indicator gives a buy signal.
  • The Donchian channel indicates uptrend: it is narrowing up.
  • The MACD indicator gives a bullish signal: it is above the signal line and the gap is widening.
  • The Stochastic oscillator has breached into overbought zone, this is bearish.

We believe the bullish momentum will continue after the price breaches above the upper boundary of Donchian channel at 947.3. This level can be used as an entry point for placing a pending order to buy. The stop loss can be placed below the last Parabolic signal at 924.2. After placing the order, the stop loss is to be moved every day to the next fractal low, following Parabolic signals. Thus, we are changing the expected profit/loss ratio to the breakeven point. If the price meets the stop loss level (924.2) without reaching the order (947.3), we recommend cancelling the order: the market has undergone internal changes which were not taken into account.

Technical Analysis Summary

OrderBuy
Buy stopAbove 947.3
Stop lossBelow 924.2

Market Analysis provided by IFCMarkets

Forex Technical Analysis & Forecast 27.12.2019 (EURUSD, GBPUSD, USDCHF, USDJPY, AUDUSD, USDRUB, USDCAD, GOLD, BRENT, BTCUSD)

Article By RoboForex.com

EURUSD, “Euro vs US Dollar”

EURUSD has formed an upside continuation pattern around 1.1100; right now, it is growing to reach 1.1121. After that, the instrument may start a new correction towards 1.1109 and then form one more ascending structure with the short-term target at 1.1133.

EURUSD
Risk Warning: the result of previous trading operations do not guarantee the same results in the future

GBPUSD, “Great Britain Pound vs US Dollar”

GBPUSD has formed the consolidation range around 1.2985; right now, it is moving upwards. Possibly, the pair may reach 1.3050 and then start a new correction towards 1.3017. Later, the market may resume trading upwards with the target at 1.3067.

GBPUSD
Risk Warning: the result of previous trading operations do not guarantee the same results in the future

USDCHF, “US Dollar vs Swiss Franc”

USDCHF has formed the consolidation range around 0.9807; right now, it is moving downwards. Possibly, the pair may break 0.9797 and then continue falling towards 0.9783.

USDCHF
Risk Warning: the result of previous trading operations do not guarantee the same results in the future

USDJPY, “US Dollar vs Japanese Yen”

USDJPY has reached 109.60; right now, it is falling. Possibly, today the pair may break 109.45 to the downside and then continue moving downwards with the target at 109.14.

USDJPY
Risk Warning: the result of previous trading operations do not guarantee the same results in the future

AUDUSD, “Australian Dollar vs US Dollar”

AUDUSD is still moving upwards. Possibly, the pair may reach 0.6957 and then start a new correction towards 0.6930. Later, the market may form one more ascending structure with the target at 0.6979.

AUDUSD
Risk Warning: the result of previous trading operations do not guarantee the same results in the future

USDRUB, “US Dollar vs Russian Ruble”

USDRUB has returned to 62.25; right now, it is consolidating below it. Today, the pair may break the range to the downside and reach 62.00. Later, the market may start another growth towards 62.38 and then resume trading inside the downtrend with the target at 61.47.

USDRUB
Risk Warning: the result of previous trading operations do not guarantee the same results in the future

USDCAD, “US Dollar vs Canadian Dollar”

USDCAD has broken 1.3131 downwards; right now, it is still falling to reach 1.3072. Later, the market may start a new correction towards 1.3118 and then resume trading downwards with the target at 1.3050.

USDCAD
Risk Warning: the result of previous trading operations do not guarantee the same results in the future

XAUUSD, “Gold vs US Dollar”

Gold has been able to fix above 1507.70; right now, it is still trading upwards to reach 1515.70. After that, the instrument may start a new correction to return to 1507.70 and then extend this ascending wave towards 1518.45.

GOLD
Risk Warning: the result of previous trading operations do not guarantee the same results in the future

BRENT

After reaching 67.28 and forming an upside continuation pattern, Brent is still moving upwards. Possibly, today the pair may reach 67.77 and then start a new correction towards 67.28. After that, the market may resume trading upwards with the target at 68.04.

BRENT
Risk Warning: the result of previous trading operations do not guarantee the same results in the future

BTCUSD, “Bitcoin vs US Dollar”

BTCUSD has rebounded from 7350.00 downwards; right now, it is still falling to reach 7000.00. Later, the market may resume trading inside the uptrend to return to 7350.00.

BITCOIN

Article By RoboForex.com

Attention!
Forecasts presented in this section only reflect the author’s private opinion and should not be considered as guidance for trading. RoboForex LP bears no responsibility for trading results based on trading recommendations described in these analytical reviews.

Fibonacci Retracements Analysis 27.12.2019 (BITCOIN, ETHEREUM)

Article By RoboForex.com

BTCUSD, “Bitcoin vs US Dollar”

As we can see in the H4 chart, the convergence made the pair reverse and start a new rising correction, which has already reached 23.6% fibo and may yet continue towards 38.2% and 50.05% fibo at 7995.00 and 8480.00 respectively. However, if the price breaks the local low at 6430.30, BTCUSD may continue falling to reach mid-term 76.0% fibo at 5700.00. The key mid-term downside target is still the low at 3121.90.

BTCUSD_H4
Risk Warning: the result of previous trading operations do not guarantee the same results in the future

In the H1 chart, the pair is correcting after the divergence on MACD. The price has already reached 38.2% fibo; right now, it is trading close to this level. The next descending impulse may fall to reach 50.0% and 61.8% fibo at 7059.00 and 6910.00 respectively. The resistance is the high at 7687.30.

BTCUSD_H1
Risk Warning: the result of previous trading operations do not guarantee the same results in the future

ETHUSD, “Ethereum vs. US Dollar”

As we can see in the daily chart, the downtrend continues to reach a psychologically-crucial level of 100.00. At the same time, there is a convergence on MACD, which may indicate a new pullback towards the resistance (61.8% fibo at 189.00).

ETHUSD_D1
Risk Warning: the result of previous trading operations do not guarantee the same results in the future

The H4 chart shows a short-term growth towards 23.6% fibo at 135.68 after the convergence. In case it breaks this level, the current rising movement may continue to reach 38.2% and 50.0% fibo at 147.70 and 157.57 respectively. However, if the pair breaks the low, it may test the support at 100.00.

ETHEREUM_H4

Article By RoboForex.com

Attention!
Forecasts presented in this section only reflect the author’s private opinion and should not be considered as guidance for trading. RoboForex LP bears no responsibility for trading results based on trading recommendations described in these analytical reviews.

Microbot Shares Soar on Claims It Has Created the World’s First Fully Disposable Endovascular Robotic System

By The Life Science Report

Source: Streetwise Reports   12/24/2019

Shares of Microbot Medical traded 70% higher after the company reported that in January 2020 it will unveil the world’s first fully disposable robotic system for endovascular procedures. The firm claims that its breakthrough technology features compact design, remote operation capabilities and an integrated “One & Done” tool to democratize endovascular procedures.

Medical device company Microbot Medical Inc. (MBOT:NASDAQ), which specializes in the research, design, development and commercialization of transformational micro-robotic medical technologies, yesterday announced the revealing of LIBERTYTM, what it calls “the world’s first fully disposable robotic system for use in neurovascular, cardiovascular and peripheral vascular procedures.”

According to the report, “the LIBERTY robotic system features a unique compact design with the capability to be operated remotely, reduce radiation exposure and physical strain to the physician, as well as the potential to eliminate the use of multiple consumables through its “One & Done” capabilities.”

Microbot’s CEO, President and Chairman Harel Gadot commented, “LIBERTY is set to revolutionize the way surgical robotics are being used in endovascular procedures, by eliminating the need for capital equipment, reducing radiation exposure and aiming to streamline the use of disposables during these complex procedures…In addition, with LIBERTY’s remote operation as well as its “One & Done” capabilities, we believe it has the potential to be the first system to democratize endovascular interventional procedures.”

Dr. Eyal Morag, an ABR certified interventional radiologist and chairman of radiology and nuclear medicine at Assuta Ashdod Medical Center in Israel, added, “I believe LIBERTY will be welcomed by the interventional community due to its clinical and technical benefits in various subspecialties, such as neurovascular, cardiovascular and peripheral vascular interventions…The system set up is easy and straightforward, and it offers intuitive remote operation capabilities. These features are designed to reduce radiation exposure and eliminate physical strain on the physicians. Lastly, I believe it will democratize vascular procedures by shortening the physician’s learning curve.”

The company advised that Dr. Morag will be performing a live demonstration highlighting the unique capabilities of LIBERTY during Microbot’s LIBERTY unveiling and demonstration event at 7:00 a.m. (PT) on Monday, January 13, 2020. The firm noted that the full presentation of the unveiling and demonstration will be made available in the ‘Investors’ section of the company’s website at www.microbotmedical.com.

Microbot Medical was founded in 2010 and is based in Hingham, Mass. The firm indicated that it was established in order to increase accessibility and improve clinical outcomes for patients through the use of micro-robotic technologies. The company describes its business as “a pre-clinical medical device company that specializes in transformational micro-robotic technologies, focused primarily on both natural and artificial lumens within the human body.” The firm states that its current proprietary technological platforms provide the foundation for the development of a multi-generation pipeline portfolio.

Microbot Medical started the day with a market capitalization of about $43.6 million with approximately 4.31 million shares outstanding. MBOT shares opened higher today at $11.79 (+$1.78, +17.78%) over Monday’s closing price of $10.01. MBOT shares reached a new 52-week intraday high price of $20.01 this morning. Since the open, the stock has traded between $11.79 and $20.15 per share on very high volume and is presently trading at $17.25 (+$7.14, +70.62%).

Sign up for our FREE newsletter at: www.streetwisereports.com/get-news

Disclosure:
1) Stephen Hytha compiled this article for Streetwise Reports LLC and provides services to Streetwise Reports as an independent contractor. He or members of his household own securities of the following companies mentioned in the article: None. He or members of his household are paid by the following companies mentioned in this article: None.
2) The following companies mentioned in this article are billboard sponsors of Streetwise Reports: None. Click here for important disclosures about sponsor fees.
3) Comments and opinions expressed are those of the specific experts and not of Streetwise Reports or its officers. The information provided above is for informational purposes only and is not a recommendation to buy or sell any security.
4) The article does not constitute investment advice. Each reader is encouraged to consult with his or her individual financial professional and any action a reader takes as a result of information presented here is his or her own responsibility. By opening this page, each reader accepts and agrees to Streetwise Reports’ terms of use and full legal disclaimer. This article is not a solicitation for investment. Streetwise Reports does not render general or specific investment advice and the information on Streetwise Reports should not be considered a recommendation to buy or sell any security. Streetwise Reports does not endorse or recommend the business, products, services or securities of any company mentioned on Streetwise Reports.
5) From time to time, Streetwise Reports LLC and its directors, officers, employees or members of their families, as well as persons interviewed for articles and interviews on the site, may have a long or short position in securities mentioned. Directors, officers, employees or members of their immediate families are prohibited from making purchases and/or sales of those securities in the open market or otherwise from the time of the interview or the decision to write an article until three business days after the publication of the interview or article. The foregoing prohibition does not apply to articles that in substance only restate previously published company releases.
6) This article does not constitute medical advice. Officers, employees and contributors to Streetwise Reports are not licensed medical professionals. Readers should always contact their healthcare professionals for medical advice.

( Companies Mentioned: MBOT:NASDAQ,
)

The Analytical Overview of the Main Currency Pairs on 2019.12.27

by JustForex

The EUR/USD currency pair

Technical indicators of the currency pair:
  • Prev Open: 1.10908
  • Open: 1.10961
  • % chg. over the last day: +0.09
  • Day’s range: 1.10942 – 1.11222
  • 52 wk range: 1.0879 – 1.1572

Yesterday, the USD weakened against the basket of world currencies. This movement is largely due to technical factors. EUR / USD quotes updated local highs. At the moment, the trading instrument is testing the resistance level of 1.11200. 1.10950 is already a mirror support. The EUR has a potential for further recovery. We recommend opening positions from key levels.

The Economic News Feed for 27.12.2019 is calm.

EUR/USD

The price has fixed above 100 MA, which signals the strength of buyers.

The MACD histogram is in the positive zone and continues to rise, indicating a bullish sentiment.

The Stochastic Oscillator is in the overbought zone, the %K line crossed the %D line. There are no signals at the moment.

Trading recommendations
  • Support levels: 1.10950, 1.10750, 1.10650
  • Resistance levels: 1.11200, 1.11400, 1.11550

If the price consolidates above 1.11200, expect further growth toward 1.11400-1.11600.

Alternatively, the quotes could descend toward 1.10750-1.10600.

The GBP/USD currency pair

Technical indicators of the currency pair:
  • Prev Open: 1.29523
  • Open: 1.29909
  • % chg. over the last day: +0.31
  • Day’s range: 1.29682 – 1.30143
  • 52 wk range: 1.1959 – 1.3516

An ambiguous technical pattern has developed on the GBP/USD currency pair. The trading instrument is consolidating. The local support and resistance levels are 1.29500 and 1.30150, respectively. In the near future, correction of the GPB/USD quotes after a prolonged fall is not ruled out. Market participants expect up-to-date information on Brexit. Open positions from key levels.

The publication of important economic reports from the UK is not planned.

GBP/USD

Indicators do not give accurate signals: the price crossed 50 MA and 100 MA.

The MACD histogram is close to the 0.

The Stochastic Oscillator is close to the overbought zone, the %K line crossed the %D line. There are no signals at the moment.

Trading recommendations
  • Support levels: 1.29500, 1.29000, 1.28500
  • Resistance levels: 1.30150, 1.30650, 1.31350

If the price consolidates above 1.30150, expect the quotes to recover toward 1.30650-1.31000.

Alternatively, the quotes could descend toward 1.29200-1.28800.

The USD/CAD currency pair

Technical indicators of the currency pair:
  • Prev Open: 1.31567
  • Open: 1.31122
  • % chg. over the last day: -0.40
  • Day’s range: 1.31021 – 1.31205
  • 52 wk range: 1.3014 – 1.3664

The USD/CAD currency pair went down. During yesterday’s and today’s trading, the drop in quotations exceeded 50 points. The trading instrument reached a round level of 1.31000. 1.31200 acts as local resistance. Demand for the Canadian dollar is supported by the positive dynamics of oil prices. We do not exclude the further strengthening of CAD. We recommend opening positions from key levels.

The Economic News Feed for 27.12.2019 is calm.

USD/CAD

Indicators signal the power of sellers: the price has fixed below 50 MA and 100 MA.

The MACD histogram is in the negative zone, but above the signal line, which gives a weak signal to sell USD/CAD.

The Stochastic Oscillator is in the oversold zone, the %K line crossed the %D line. There are no signals at the moment.

Trading recommendations
  • Support levels: 1.31000, 1.30700
  • Resistance levels: 1.31200, 1.31400, 1.31600

If the price consolidates below the round level of 1.31000, expect the quotes to fall toward 1.30700-1.30500.

Alternatively, the quotes could grow toward 1.31400-1.31600.

The USD/JPY currency pair

Technical indicators of the currency pair:
  • Prev Open: 109.358
  • Open: 109.546
  • % chg. over the last day: +0.16
  • Day’s range: 109.432 – 109.584
  • 52 wk range: 104.45 – 113.53

The USD/JPY currency pair is in lateral movement. The technical picture is ambiguous. Participants in financial markets expect additional drivers. At the moment, the following local support and resistance levels can be distinguished: 109.400 and 109.550, respectively. We recommend that you pay attention to the dynamics of yield on US government bonds. Open positions from key levels.

Series of mixed economic reports from Japan were published during the Asian trading session.

USD/JPY

Indicators do not give accurate signals: the price crossed 50 MA and 100 MA.

The MACD histogram is close to the 0 mark.

The Stochastic Oscillator is in the neutral zone, the %K line is above the %D line, which indicates a bullish sentiment.

Trading recommendations
  • Support levels: 109.400, 109.300, 109.200
  • Resistance levels: 109.550, 109.650, 109.900

If the price consolidates above 109.550, expect the quotes to grow toward 109.700-109.900.

Alternatively, the quotes could drop toward 109.300-109.200.

by JustForex