By Orbex
Gold
The yellow metal ended the week lower ultimately as the US dollar managed to rebound on stronger than expected data late in the week.
Gold had initially been higher on the week as the USD came under pressure following weaker than expected CPI readings for December.
However, on Thursday, both Retail Sales and the Philly Fed Manufacturing index surprised to the upside. Retail sales printed 0.7% MoM, far above the expected 0.3% reading. The Philly Fed read printed a solid 17 against an expected 3.7.
The data fuelled a sharp reversal in USD sentiment, which saw a diminished demand for gold. This, in turn, eroded the yellow metal’s weekly gains.
Gold demand was also weighed on over the week by the rise in equities prices. The markets cheered the signing of the US/China trade deal, with the SPX500 trading into fresh, record highs.
The support from the deal will not be permanent, however. To keep equities bid, traders will need to see solid steps in the second phase of negotiations.
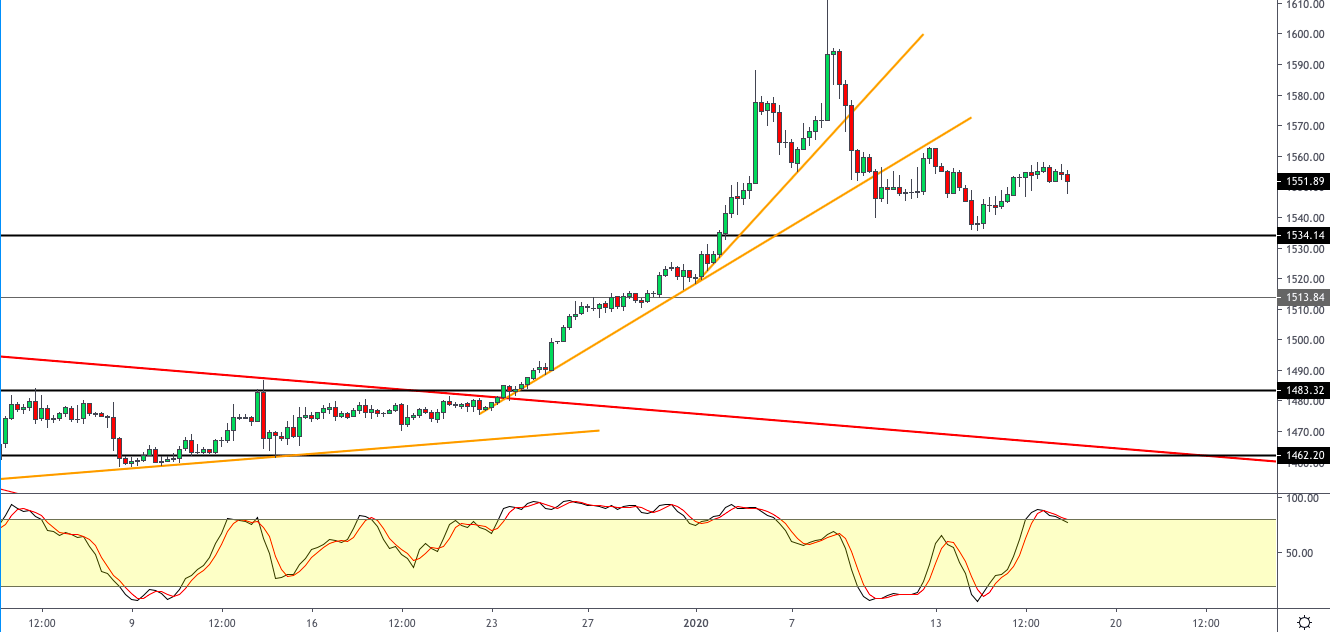
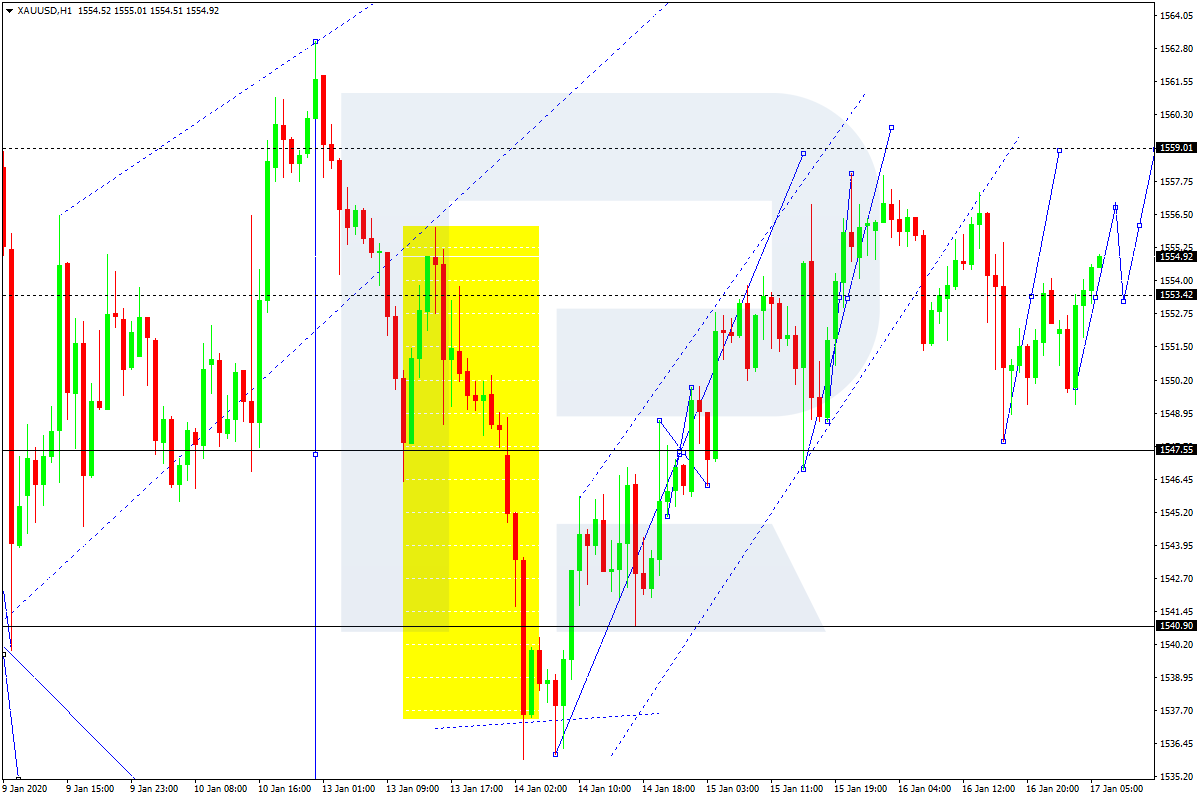
Technical Perspective
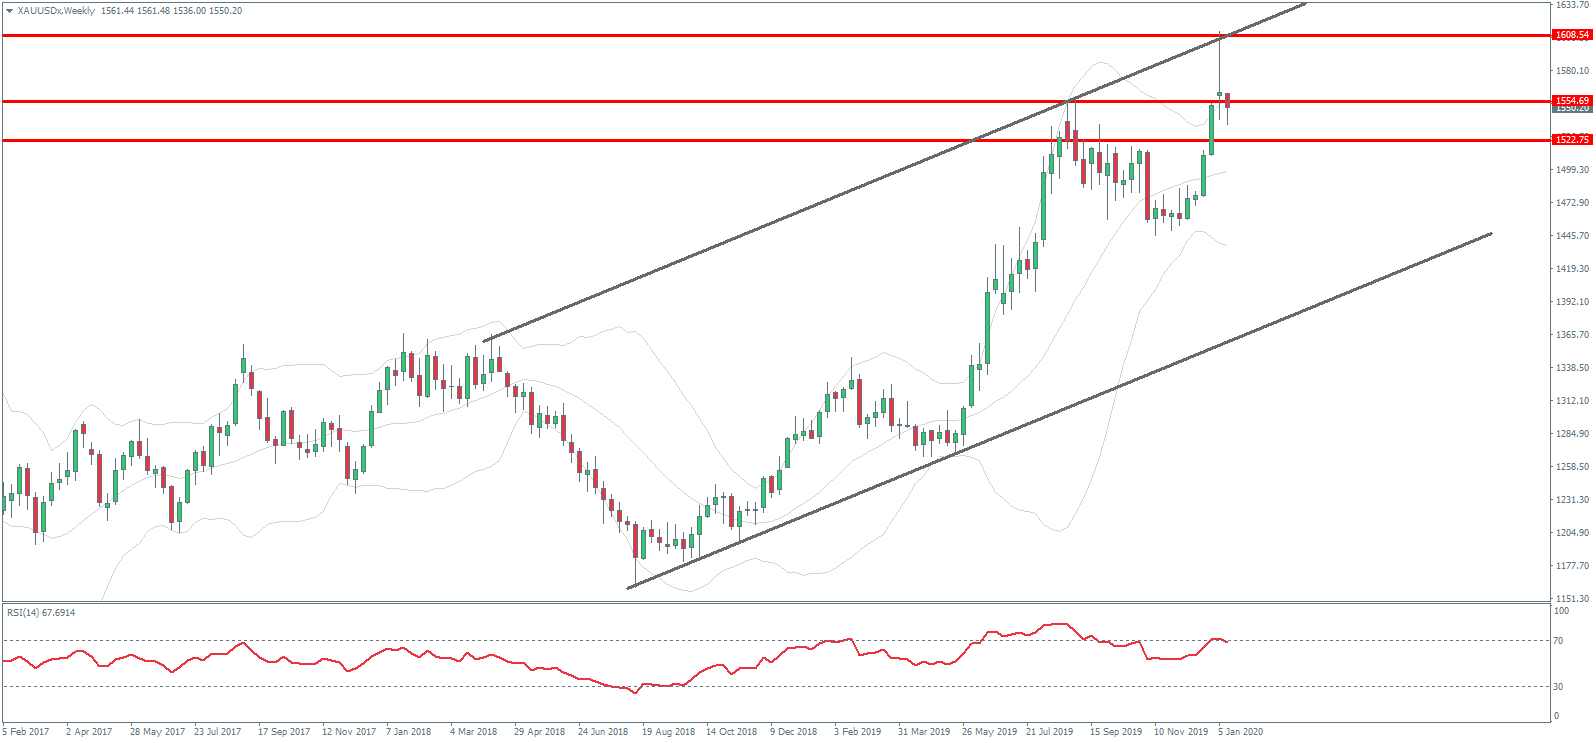
Gold prices are still fighting it out around the 1554.69 2019 highs. The rejection from 1608.54 has not yet seen proper follow-through and if price can hold above the broken 2019 highs, focus will be on a further push higher within the broad bullish channel which has framed price action over the last year. Only a break back below the 1522.75 level will alter this view.
Silver
Silver prices tracked the moves in gold and moved lower over the week as the boost to risk appetite from the signing of the US/China trade deal, as well as a resurgent USD, weighed on silver.
Its been a volatile few weeks for metals, which had initially been far higher on the year in response to the breakout of fresh hostilities between the US and Iran.
However, with that situation cooled down, for now, metals have seen reduced safe-haven demand as focus turns back to the relentless rise in equities.
Technical Perspective
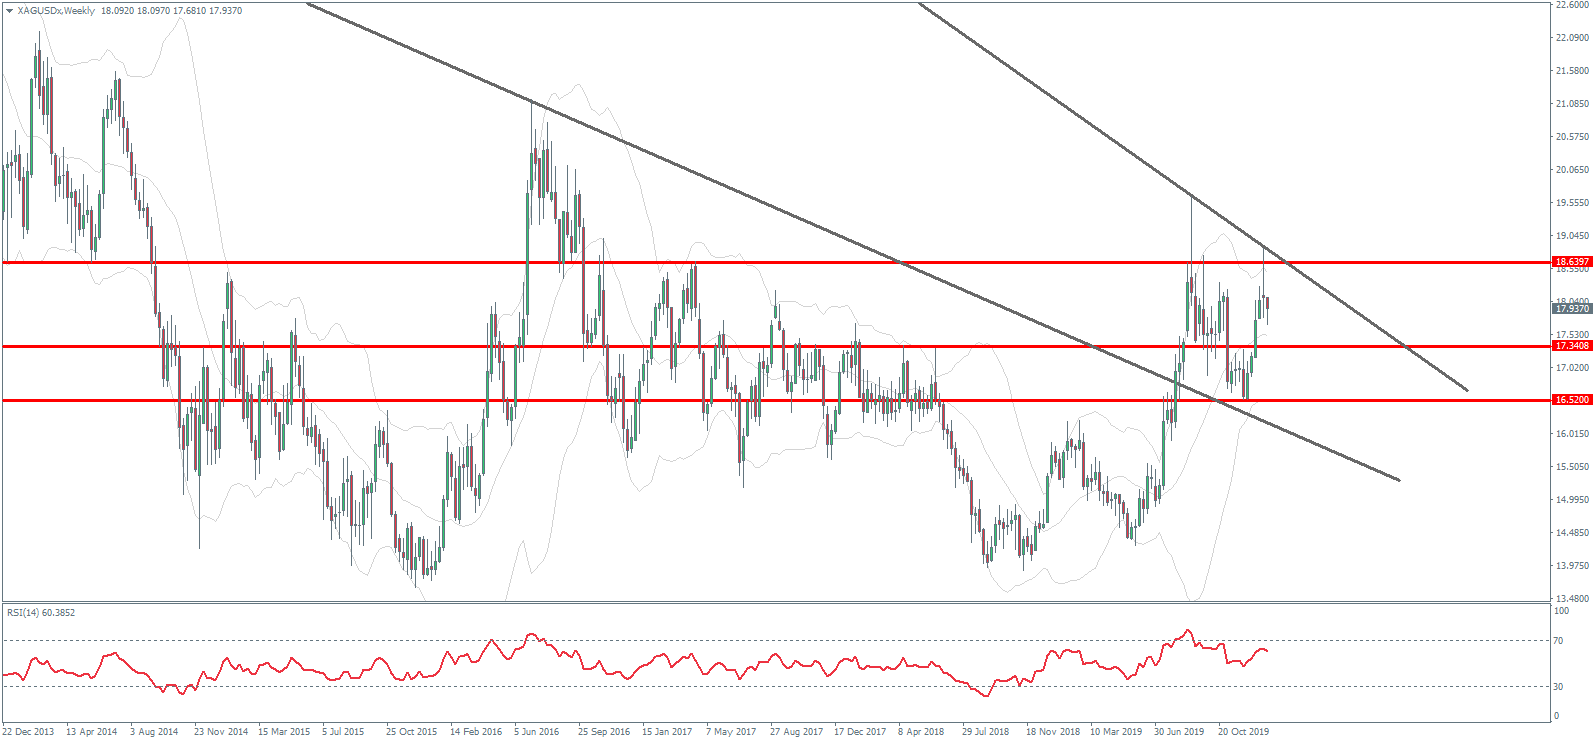
It continues to be a tale of two trend lines in silver. The breakout above the first bearish trend line was then capped by two tests of the longer-term bearish trend line.
However, price is still holding above the 17.3408 level and while above here, a further test of the 18.6397 level is still viable. To the downside, a break of 17.3408 would pave the way for a test of the 16.52 level next.
By Orbex