The AUDJPY is in a rising channel above the 200-day moving average line. Some indicators have formed buy signals. The bullish momentum may continue in case AUDJPY exceeds the last fractal high and the upper Bollinger band at 76.9. This level may serve as an entry point. The initial stop loss may be placed below the last fractal low, the lower Bollinger band and the Parabolic signal at 73.7. After opening the pending order, we shall move the stop to the next fractal low following the Bollinger and Parabolic signals. Thus, we are changing the potential profit/loss to the breakeven point. More risk-averse traders may switch to the 4-hour chart after the trade and place there a stop loss moving it in the direction of the trade. If the price meets the stop level (73.7) without reaching the order (76.9), we recommend closing the position: the market sustains internal changes that were not taken into account.
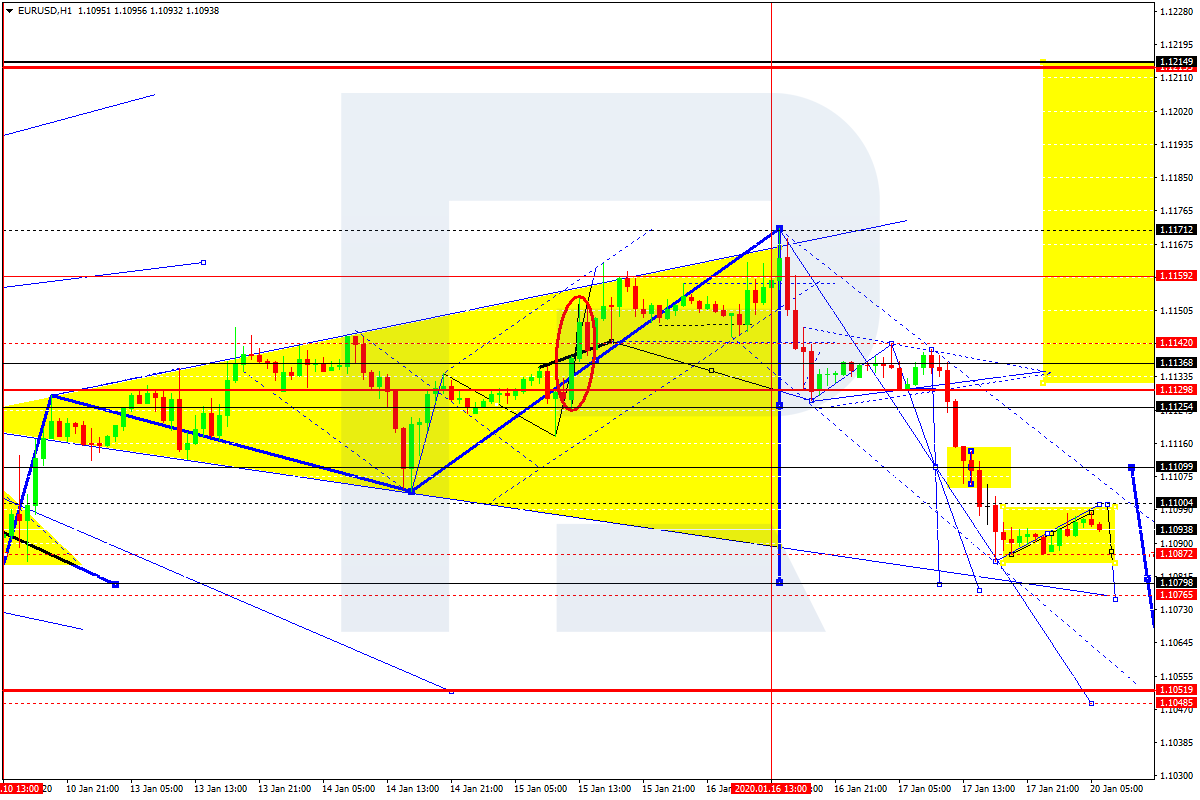
After reaching 1.1110 and forming a downside continuation pattern without any corrections, EURUSD has broken 1.1109 downwards to continue its decline. Possibly, today the pair may correct towards 1.1104 at least and then form a new descending structure with the target at 1.1080.
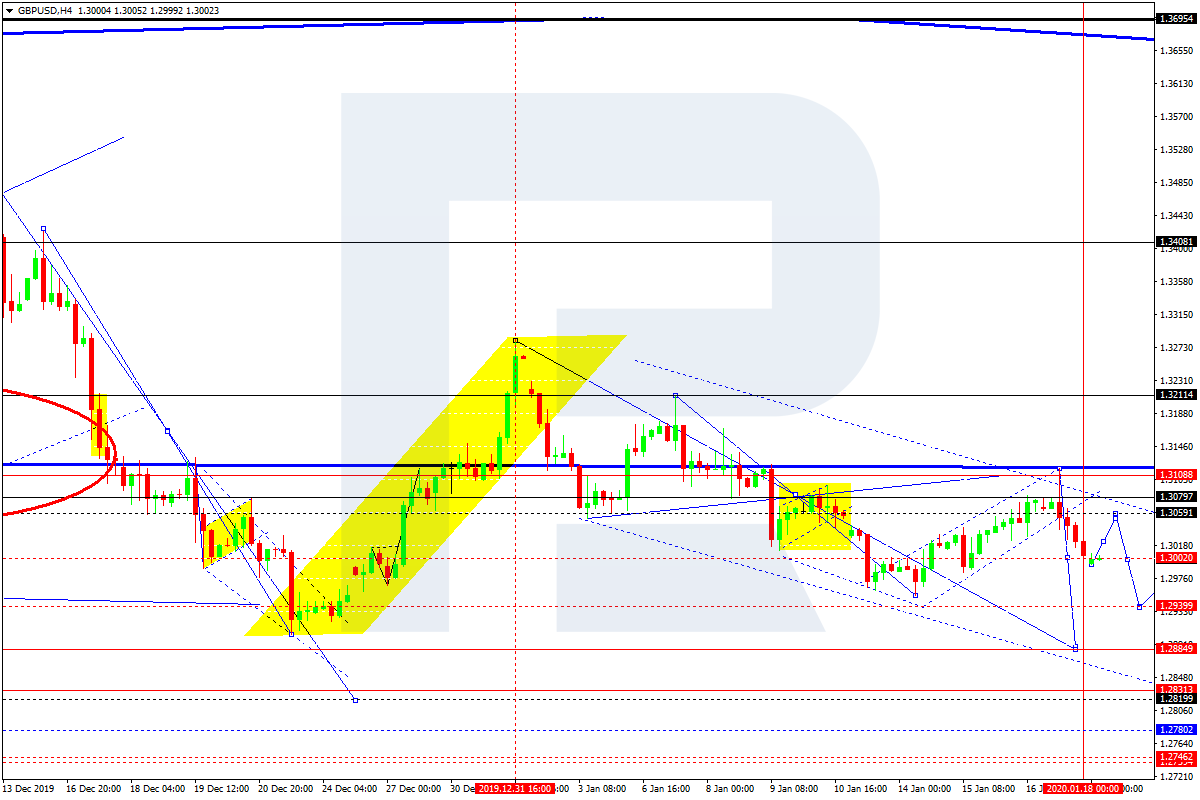
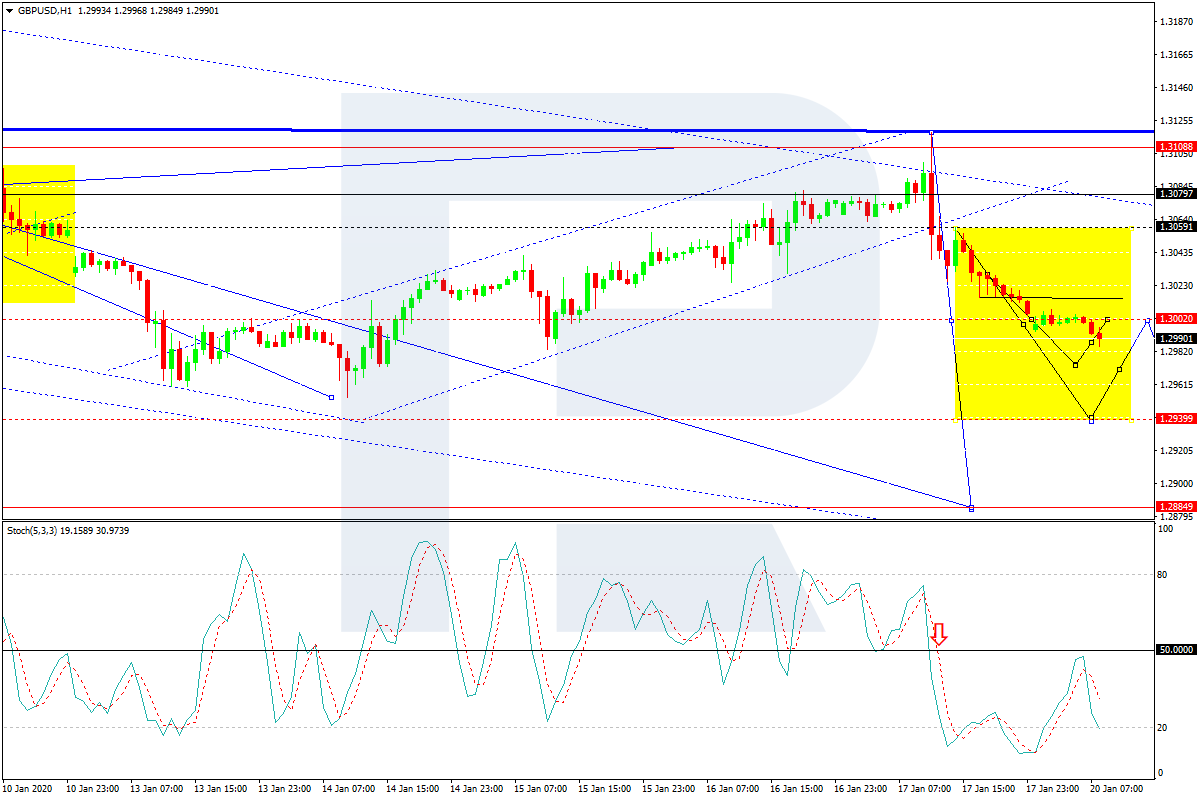
GBPUSD, “Great Britain Pound vs US Dollar”
GBPUSD has reached 1.3000; right now, it is consolidating around this level. Possibly, the pair may correct to reach 1.3050 and then continue trading inside the downtrend reach the target at 1.2940.
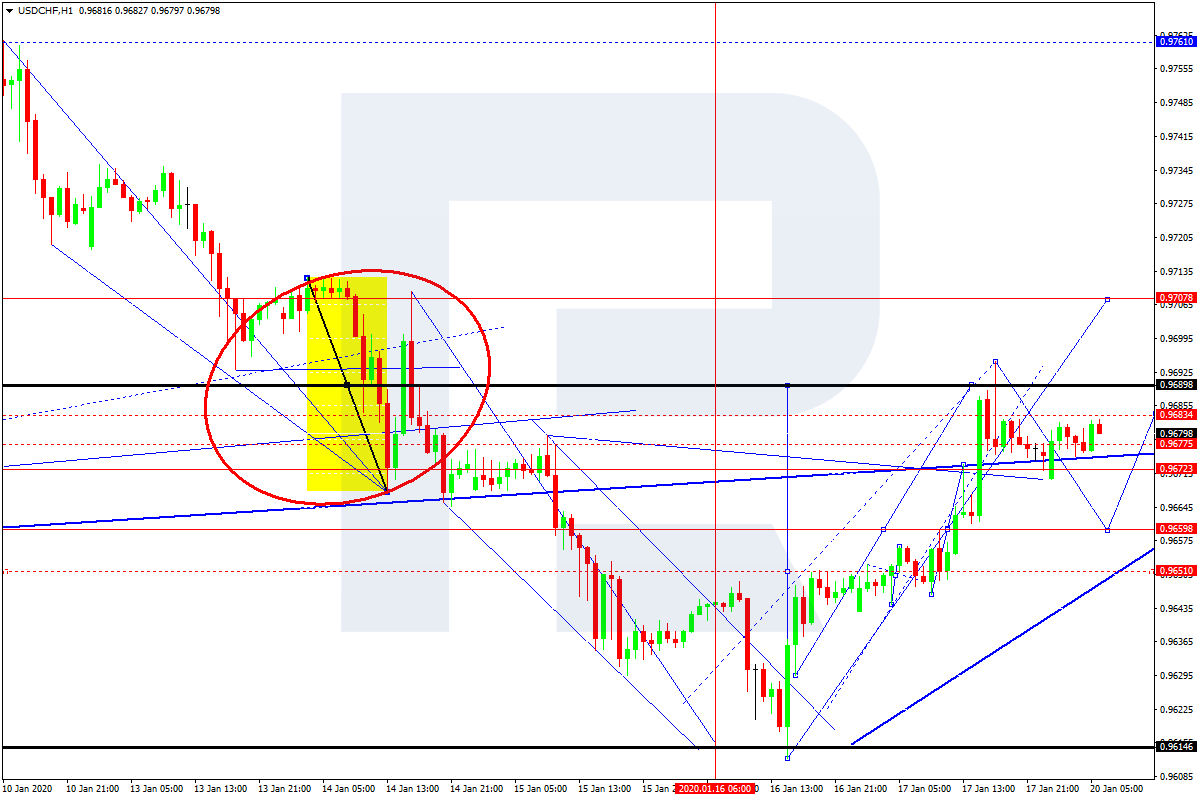
USDCHF, “US Dollar vs Swiss Franc”
USDCHF has reached the short-term upside target at 0.9690. Today, the pair may correct towards 0.9660 and then start a new growth with the target at 0.9707.
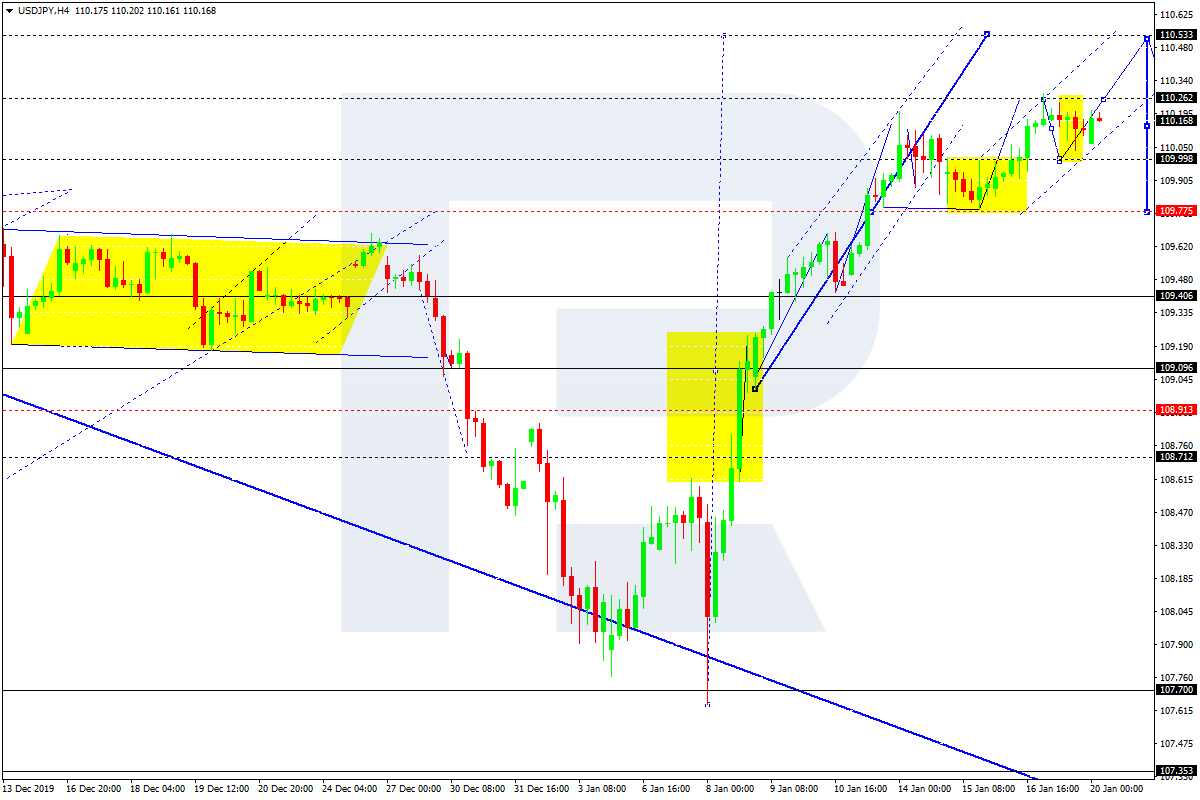
USDJPY, “US Dollar vs Japanese Yen”
USDJPY is still consolidating around 109.99. According to the main scenario, the price is expected to form one more ascending structure towards 110.53 and then resume falling with the target at 109.77.
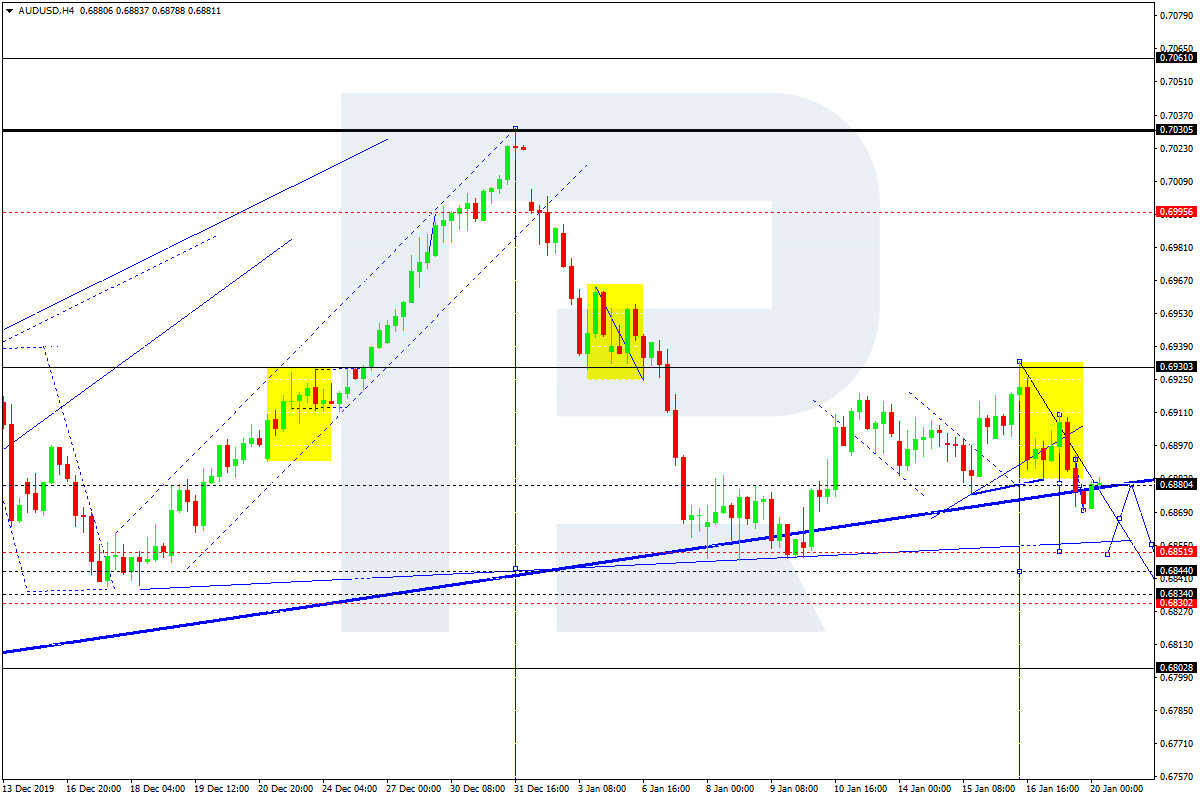
AUDUSD, “Australian Dollar vs US Dollar”
AUDUSD is falling towards 0.6852. After that, the instrument may resume moving upwards to reach 0.6888 and then start another decline with the target at 0.6834.
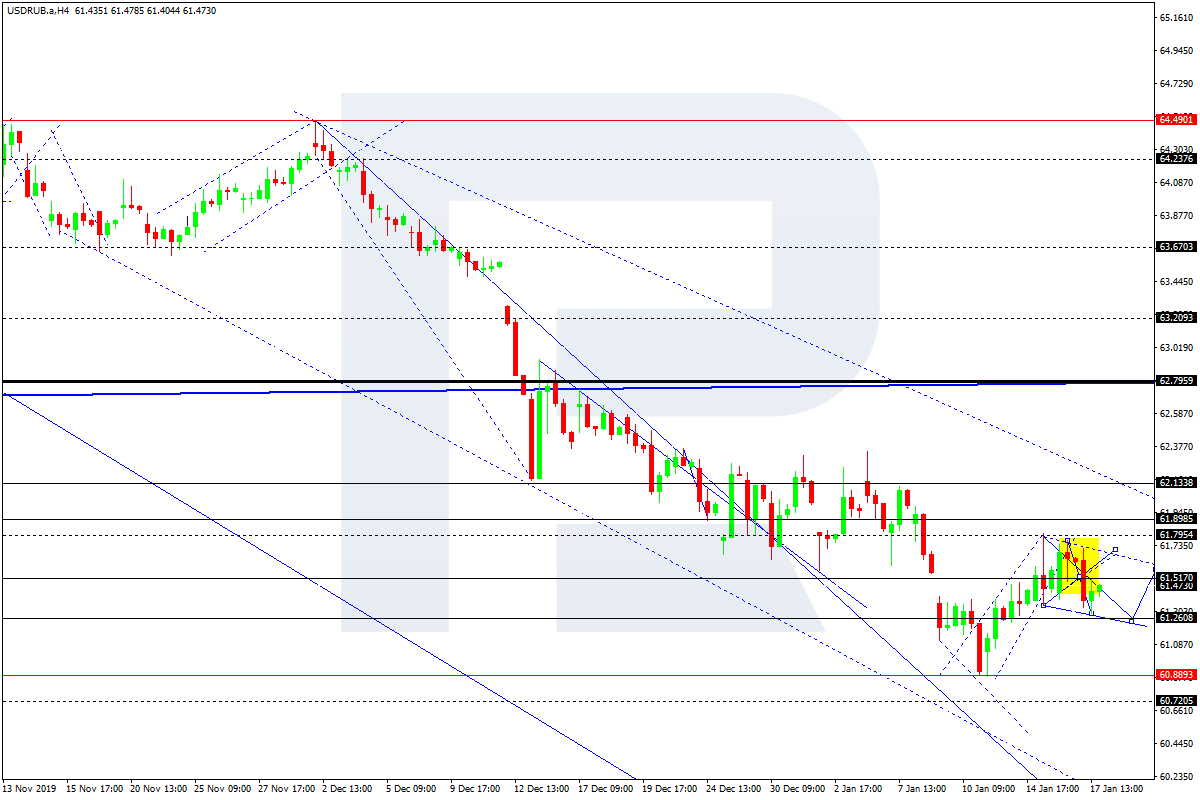
USDRUB, “US Dollar vs Russian Ruble”
USDRUB continues consolidating around 61.50. Possibly, the pair may break it upwards to reach 61.90. Later, the market may resume trading inside the downtrend with the target at 60.80.
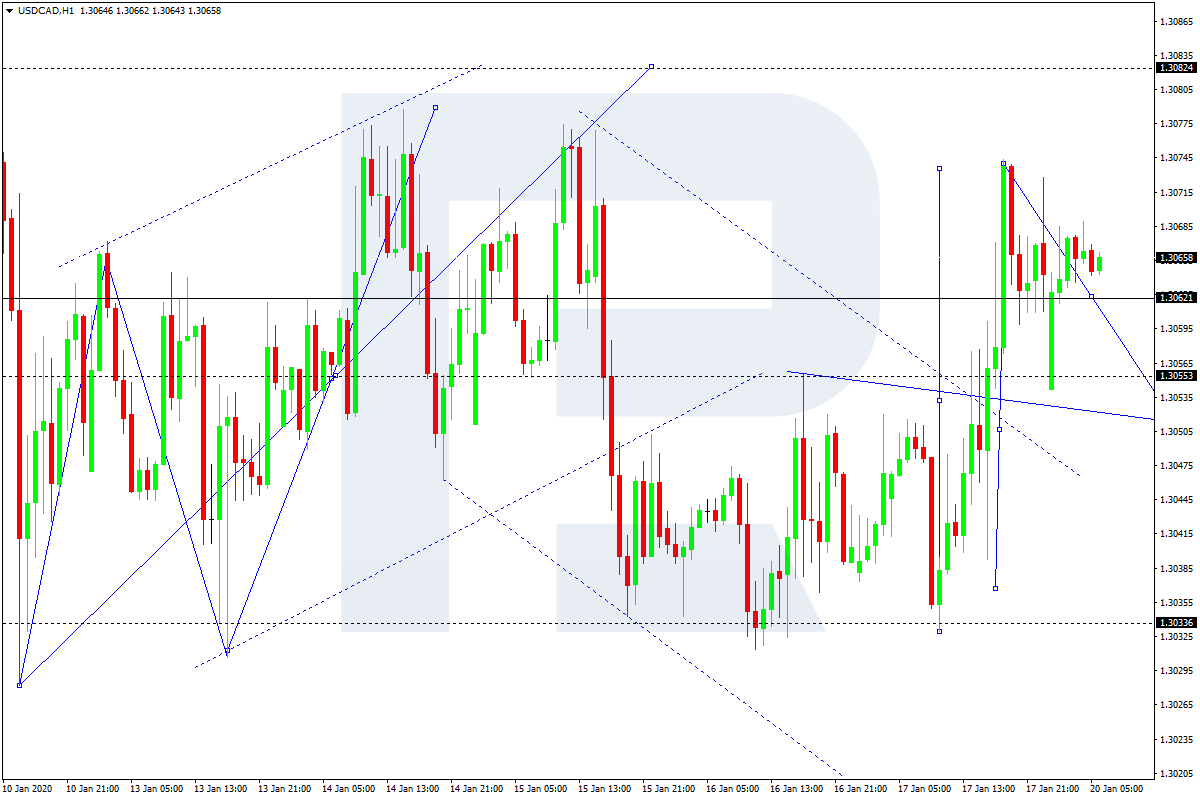
USDCAD, “US Dollar vs Canadian Dollar”
USDCAD is consolidating around 1.3062. Possibly, the pair may form a new descending structure towards 1.3050 and then resume growing with the target at 1.3082.
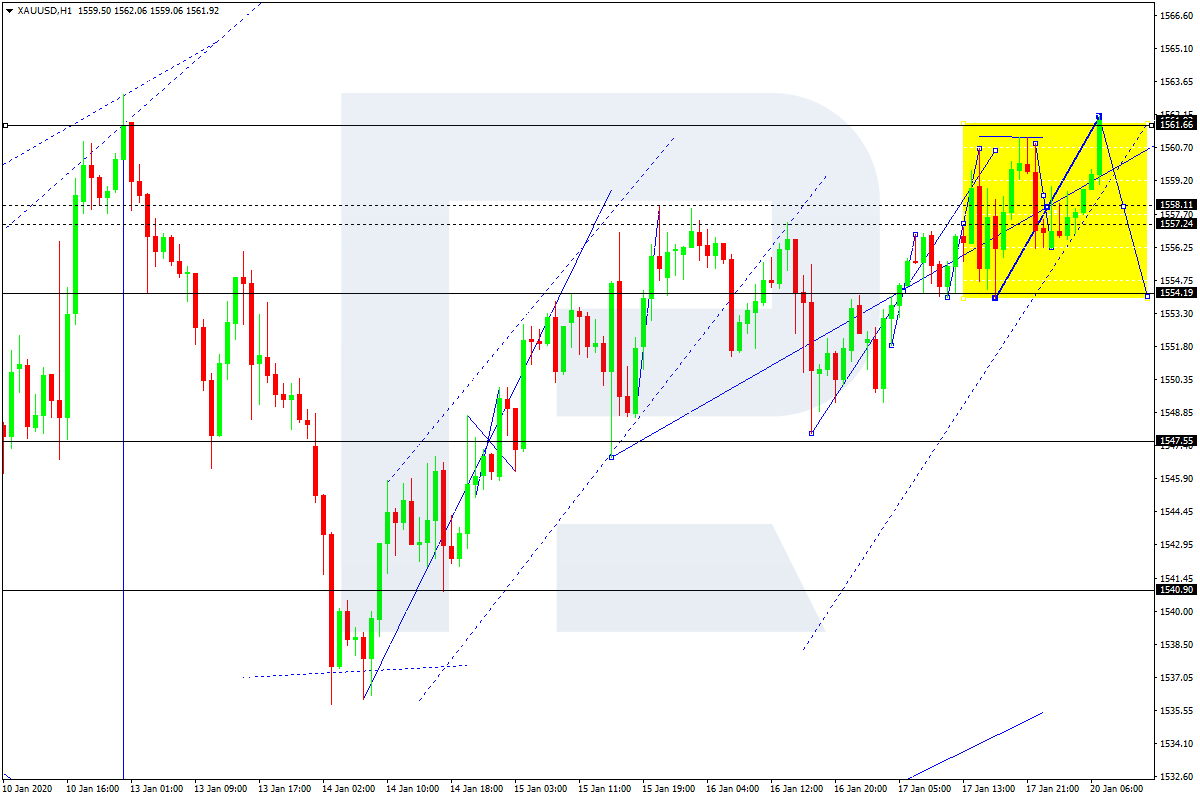
XAUUSD, “Gold vs US Dollar”
Gold is moving upwards. Today, the pair may reach 1566.66 and then start a new correction with the first target at 1554.20.
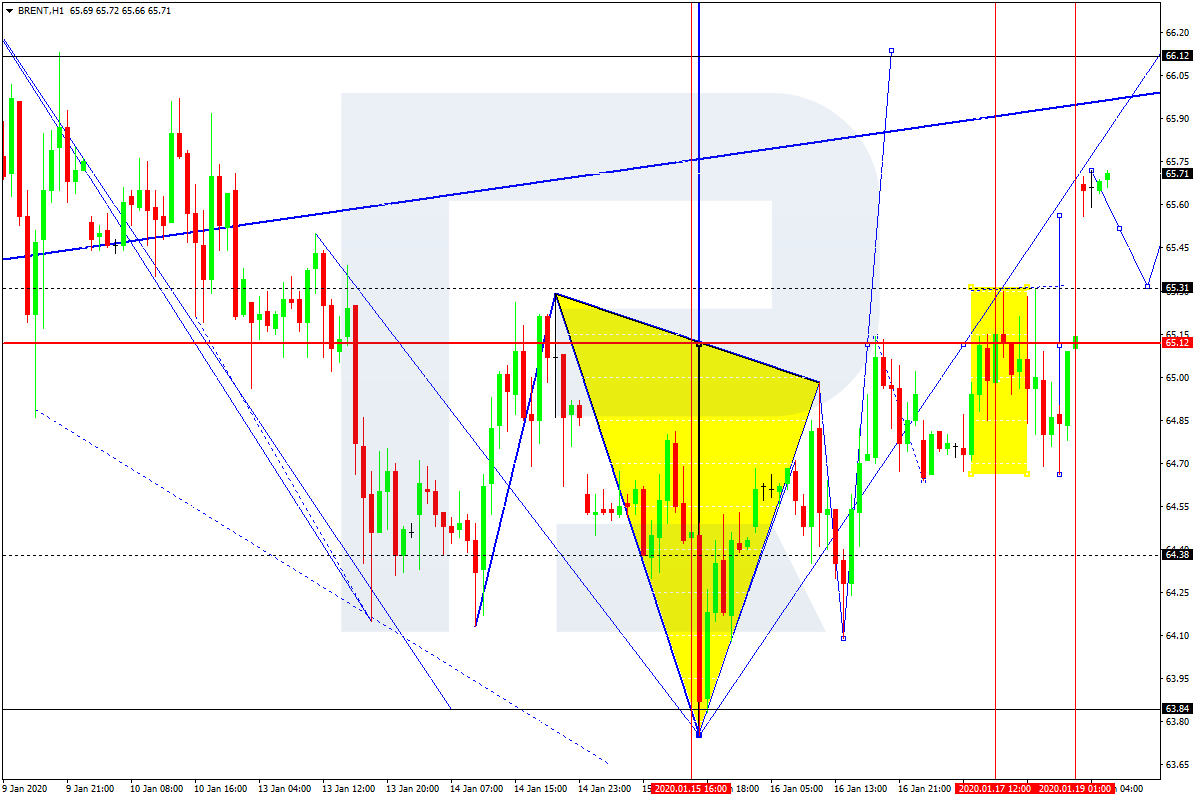
BRENT
Brent is forming the third ascending structure to reach 65.12. Later, the market may start another correction towards 65.30 and then resume trading inside the uptrend with the first target at 66.50.
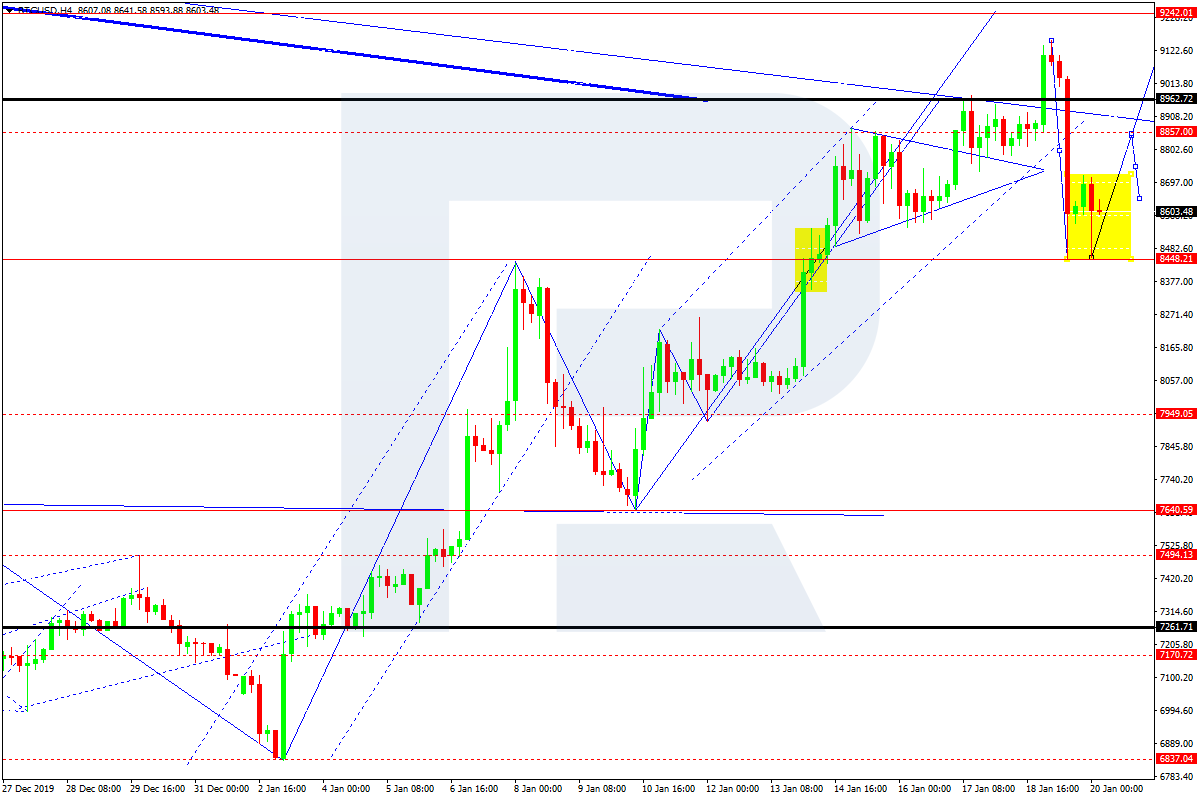
BTCUSD, “Bitcoin vs US Dollar”
BTCUSD has tested 8500.00 from above. Possibly, today the pair may form one more ascending structure towards 9240.00 and then start a new correction with the target at 7700.00.
Attention! Forecasts presented in this section only reflect the author’s private opinion and should not be considered as guidance for trading. RoboForex LP bears no responsibility for trading results based on trading recommendations described in these analytical reviews.
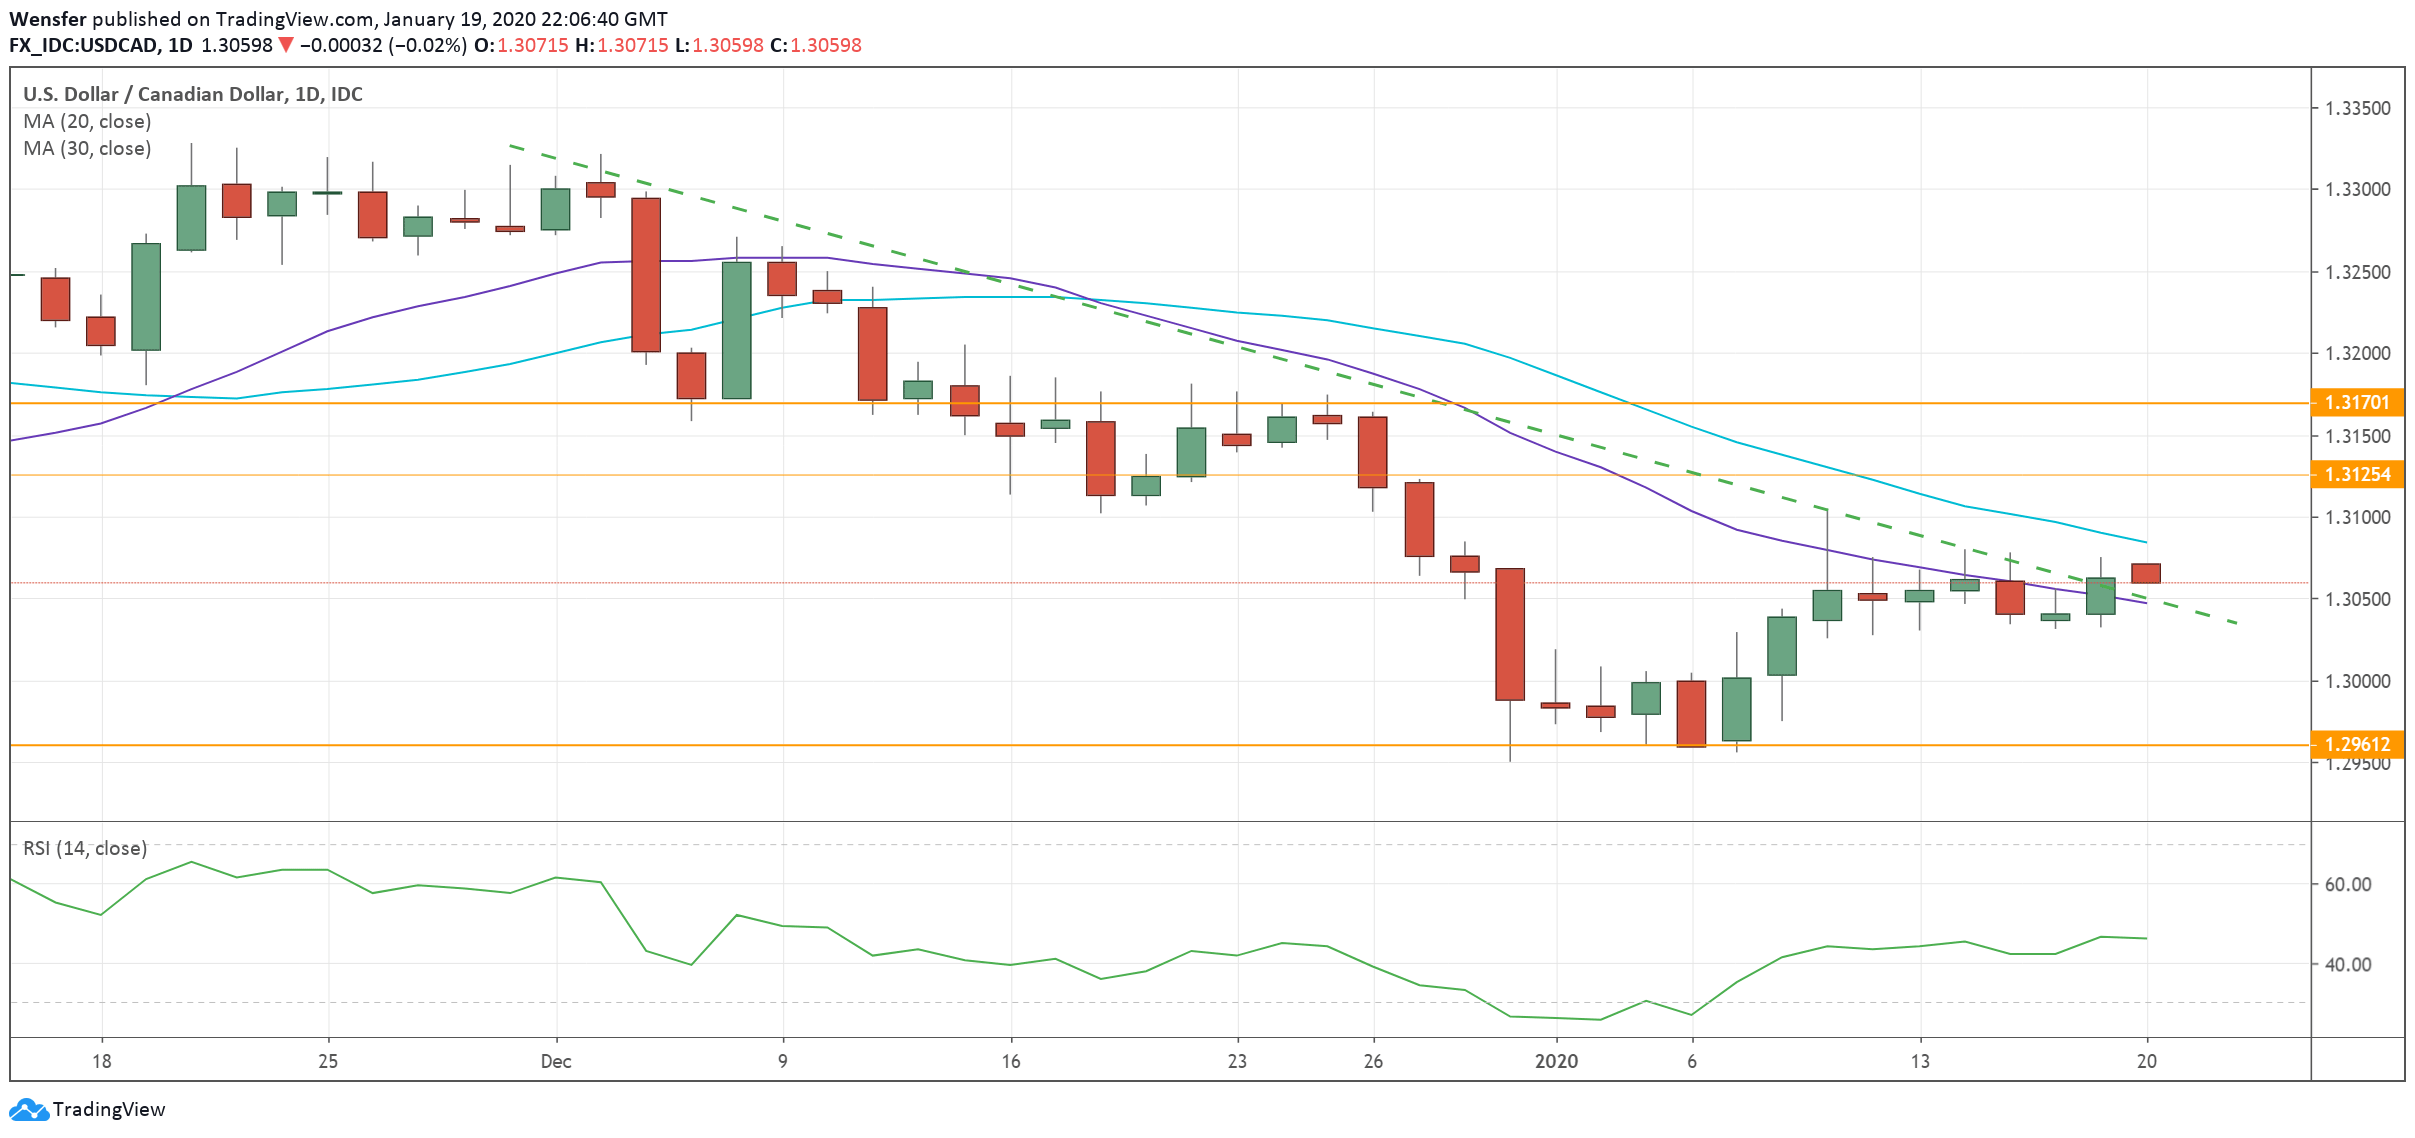
Wednesday will see heightened volatility in the Canadian dollar. The consumer price index (CPI) will indicate whether inflation has picked up, an upbeat number would boost the loonie at the greenback’s expense. Later on, the Bank of Canada is due to announce its interest rate decision. Resilience in the housing market and improved business sentiment could lead the BoC to issue a positive outlook. A rally in the Canadian dollar would resume the pair’s downtrend from last November. 1.3000 would be the immediate target, while 1.3100 around the 20 and 30-day moving averages will be a key resistance level.
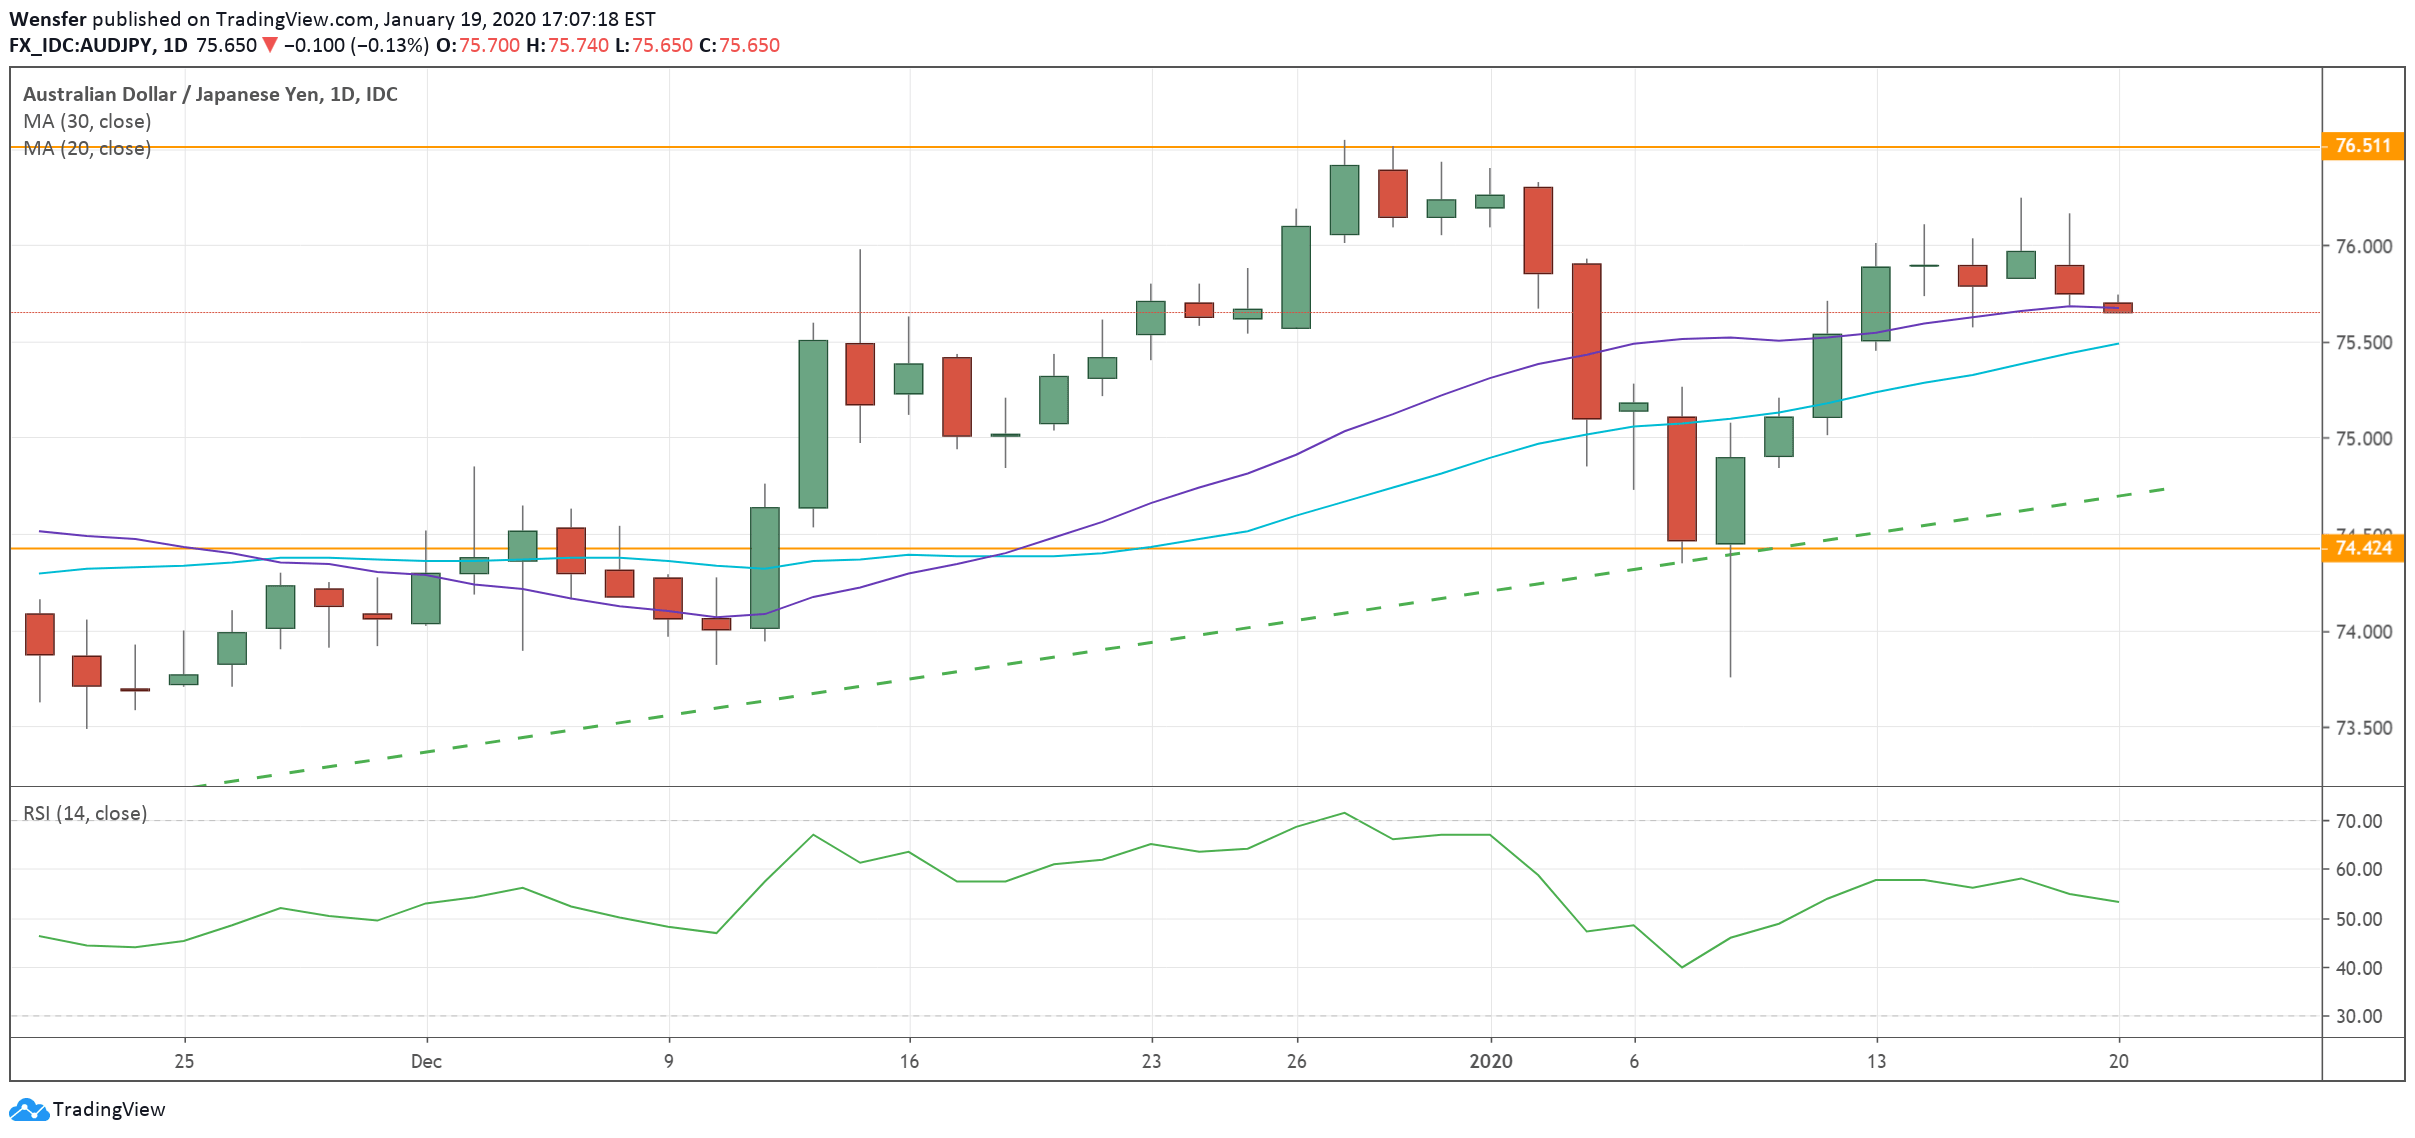
AUDJPY Hovers Under Key Resistance
Brighter trade prospects allowed the Australian dollar to rally back to its highs from last summer. As the Bank of Japan issues its rate decision this week, markets widely expect the bank to keep its monetary policy steady for the time being. An upbeat growth outlook could support the yen in the short term. However, improvement in global sentiment is likely to favor the Aussie in the medium term. The pair is about to test the previous high of 76.50. A breakout on the upside could trigger a rally towards 77.30.
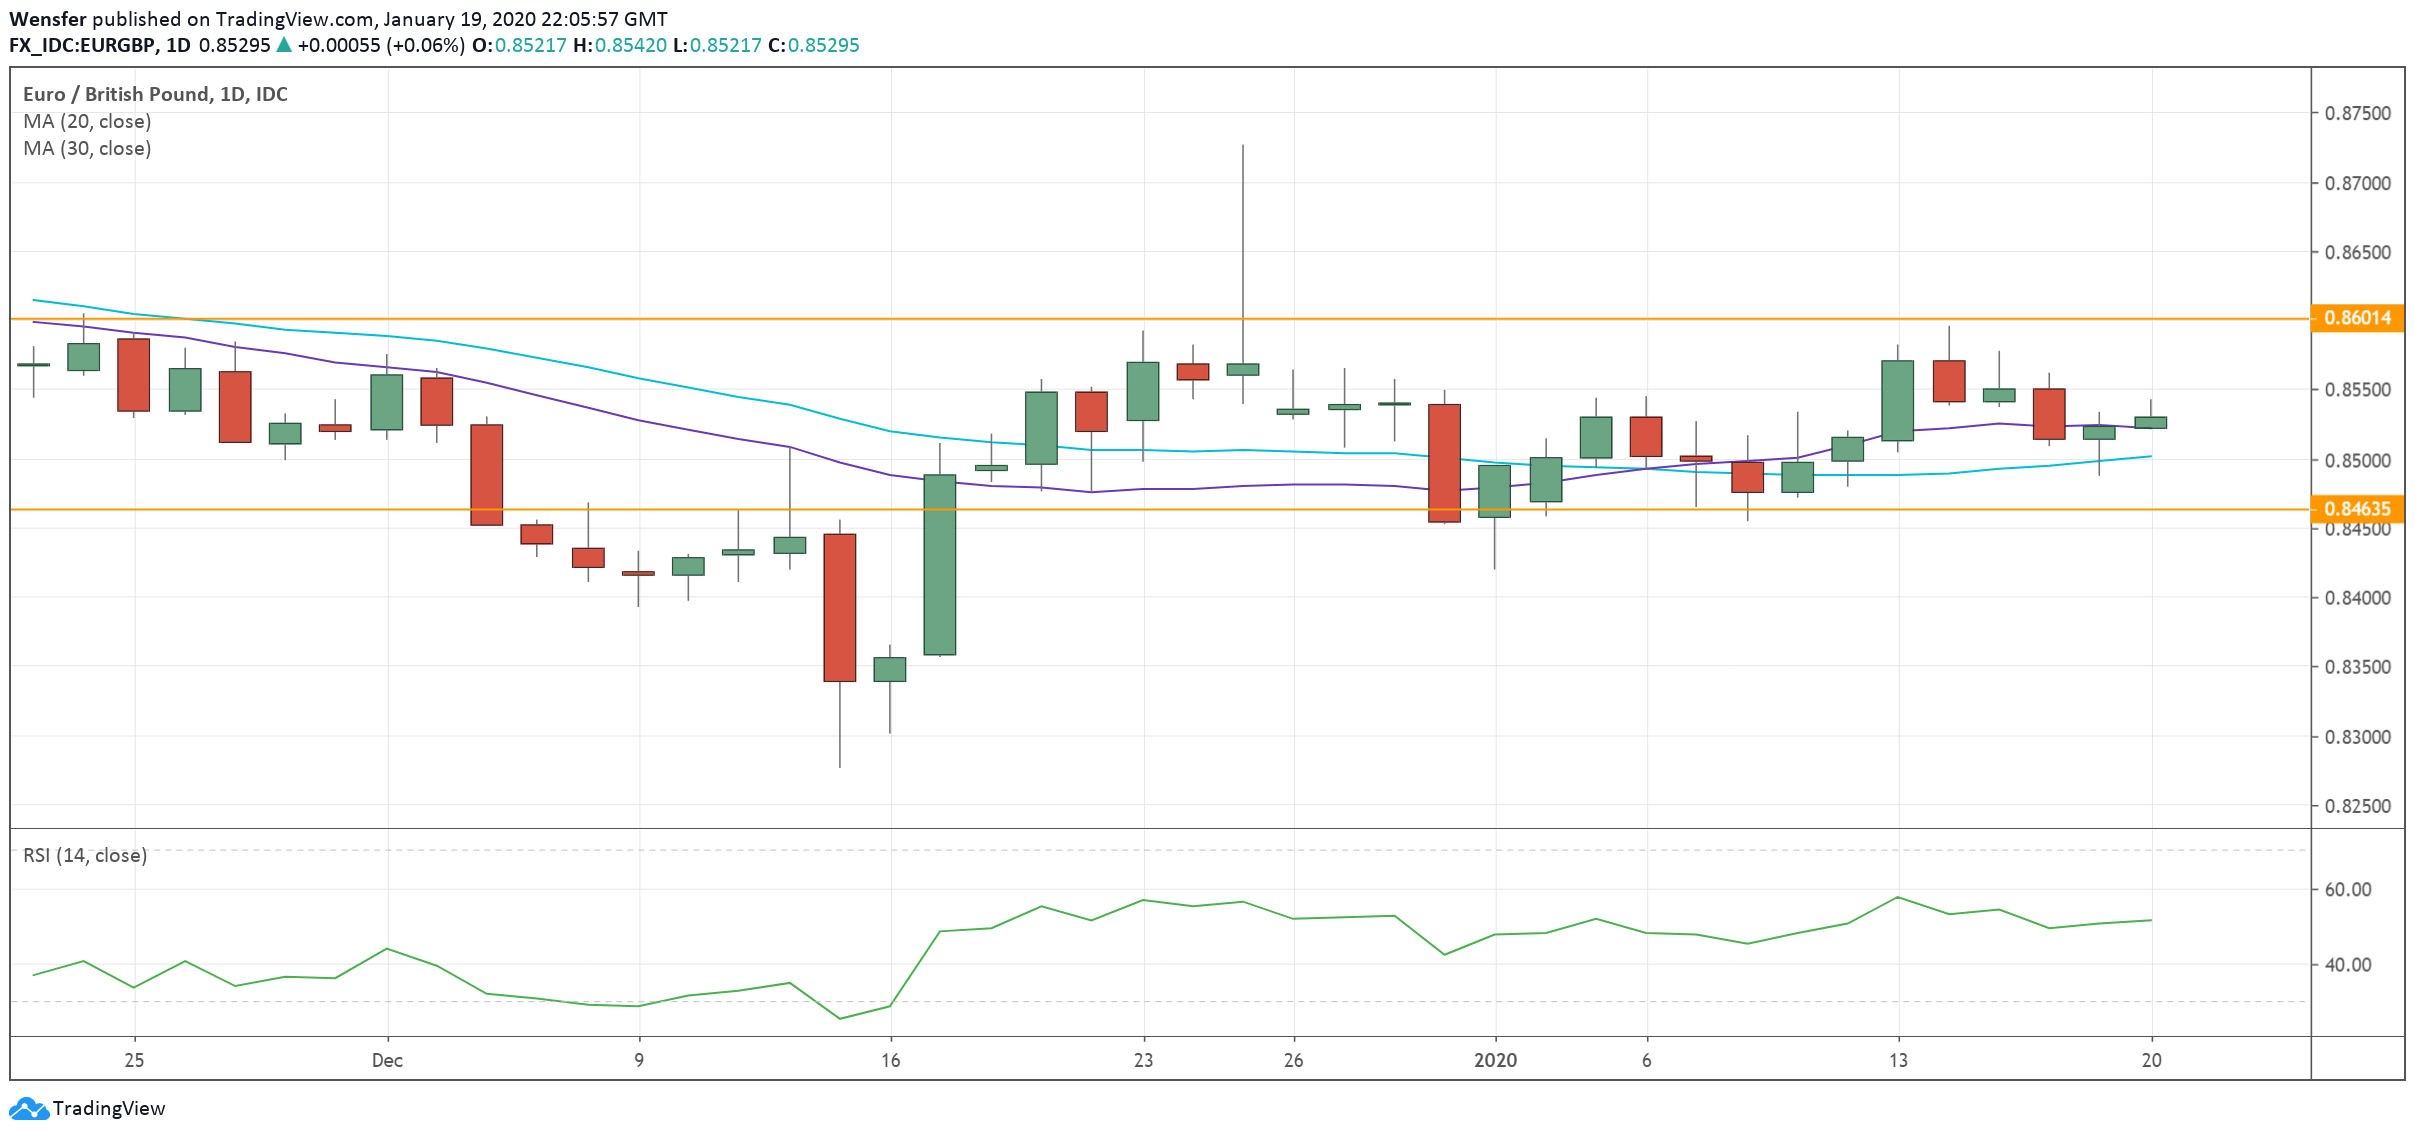
EURGBP Looks for Opportunity to Bounce
The euro’s recent recovery has much to do with signs of economic stabilization and an optimistic tone from the ECB in December. An assertive central bank on Thursday could further lift the single currency. On the flip side of the coin, soft UK retail sales have slammed a brake on the pound’s rally. A disappointing employment figure on Tuesday could fuel speculations of a BOE rate cut, and push the pound into new lows. 0.8460 is a major support level for the euro to rebound. On the upside, the psychological level of 0.8600 needs to be lifted before any protracted rally.
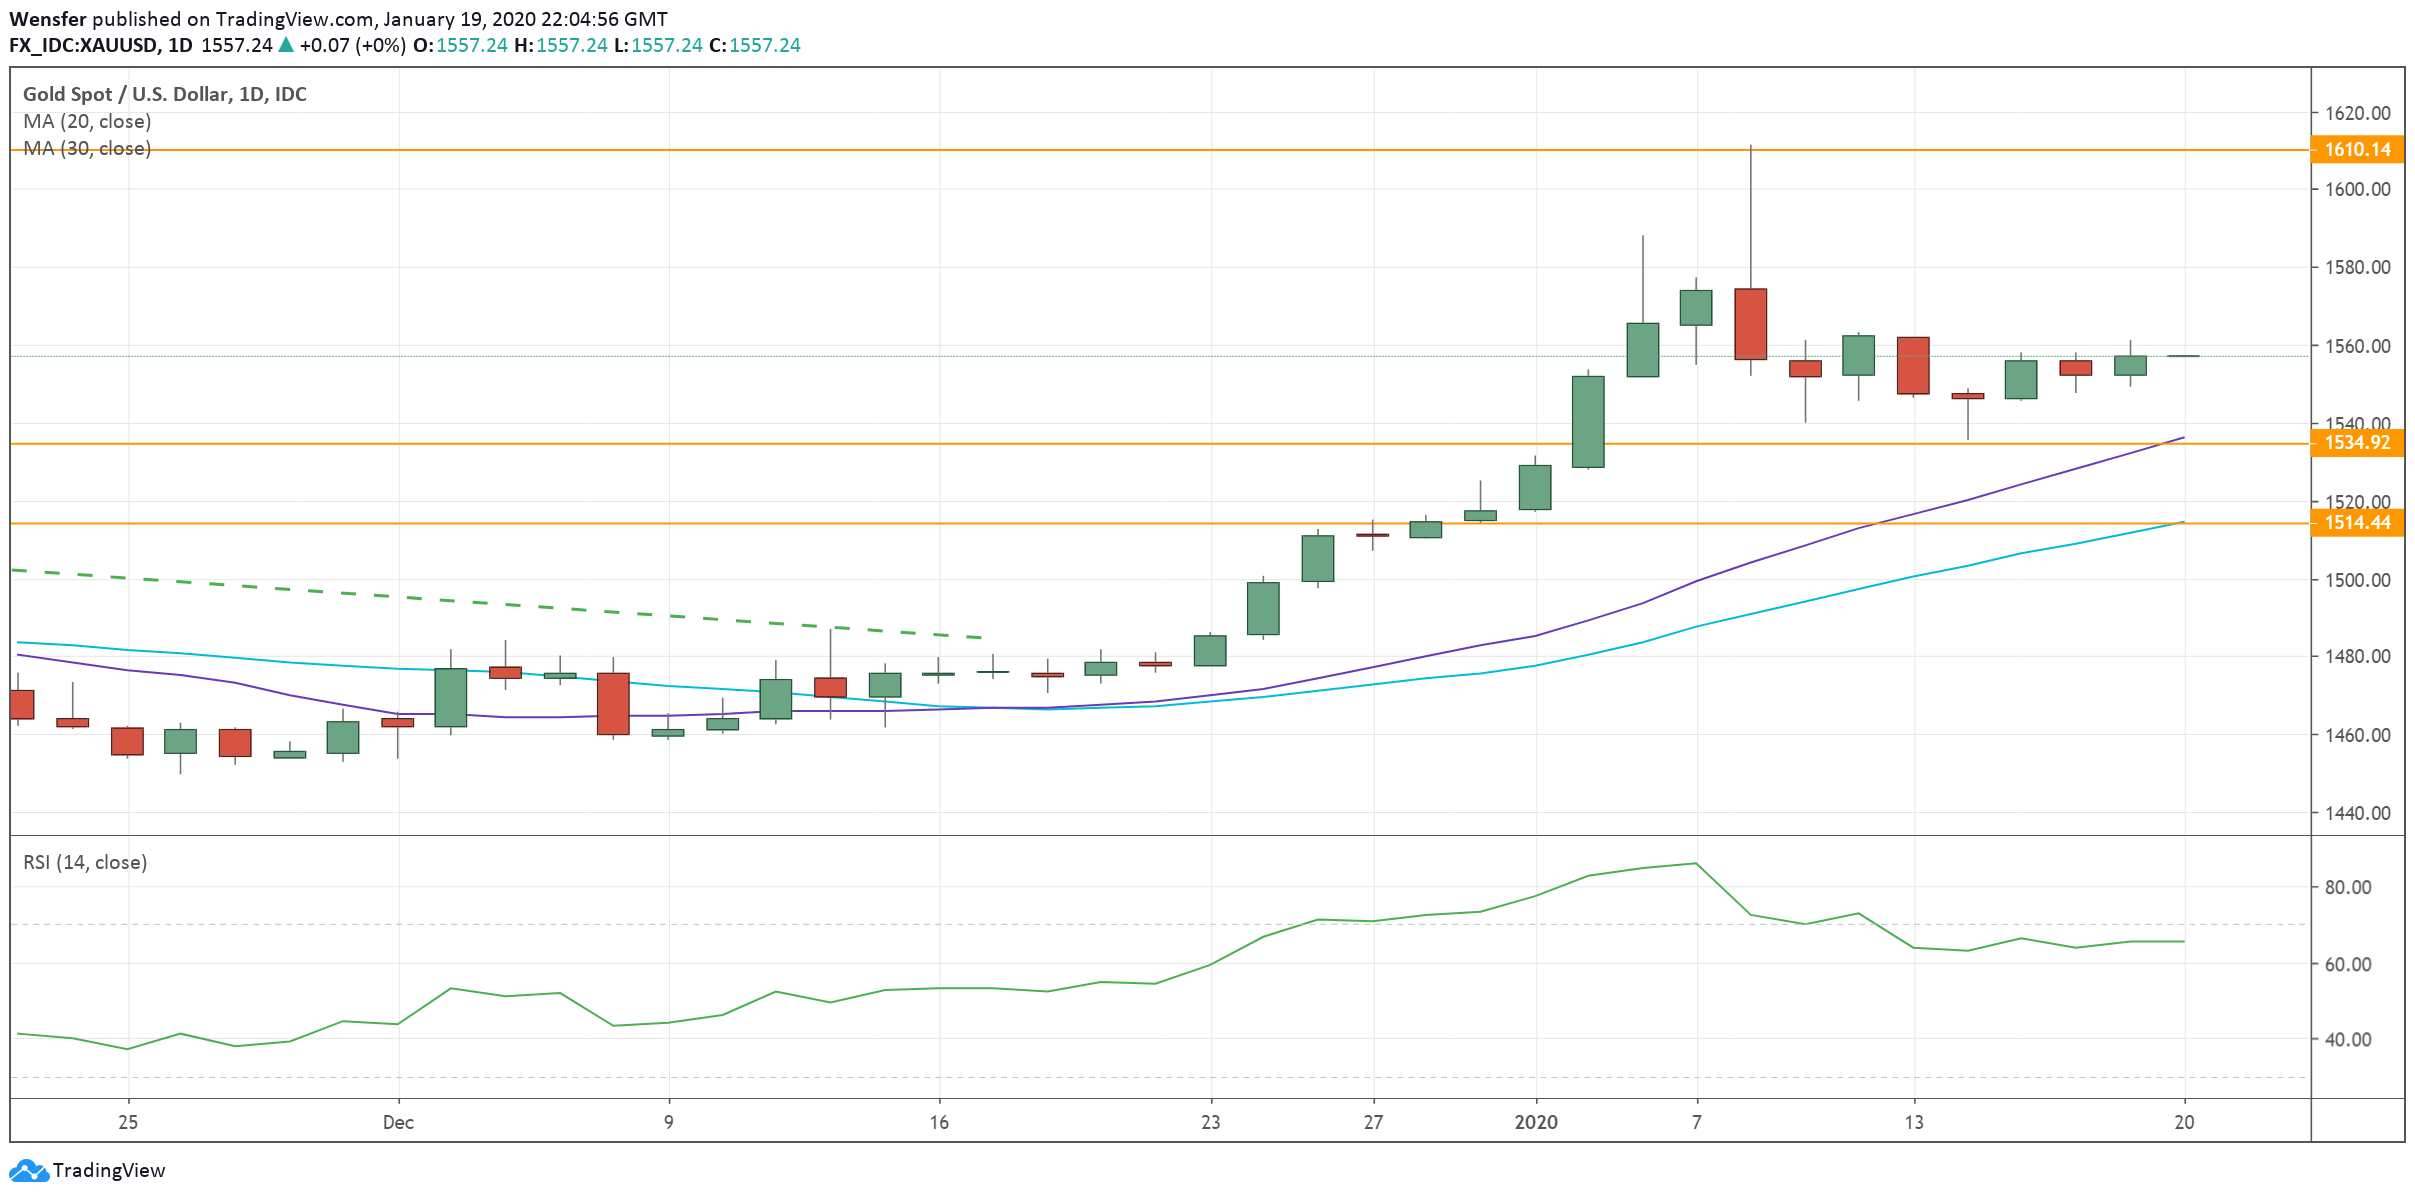
Gold Enters Consolidation Phase
Global sentiment remains upbeat after the US and China signed the “phase one’ trade deal, in which China agreed to buy $200 billion worth of US products. However, a number of market commentators fear that the truce is brittle. Chinese growth has slowed down drastically. It may seem too optimistic to believe that China has the capacity to absorb a 50% increase in American imports. The precious metal may continue to grind sideways after its meteoric rise. 1535 near the 20-day moving average is the immediate support.
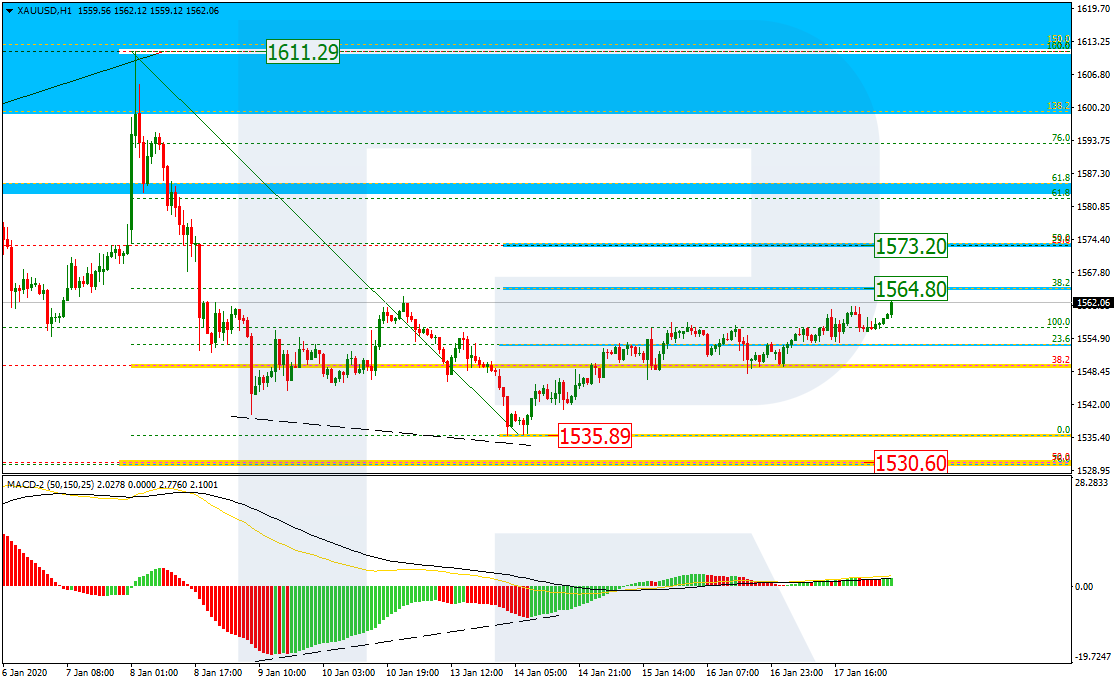
As we can see in the H4 chart, there is a correction inside another correction. The first correctional descending wave has reached 38.2% fibo, while the next one may head towards 50.0% and 61.8% fibo at 1530.60 and 1511.80 respectively. After finishing the pullback, the instrument may resume trading upwards to reach the current high at 1611.29 and the post-correctional extension area between 138.2 and 161.8% fibo at 1599.45 and 1625.70 respectively.
The H1 chart shows more detailed structure of the correction. The pair is heading towards 38.2% fibo at 1564.80 and may later continue growing to reach 50.0% fibo at 1573.20. the support is the local low at 1535.89.
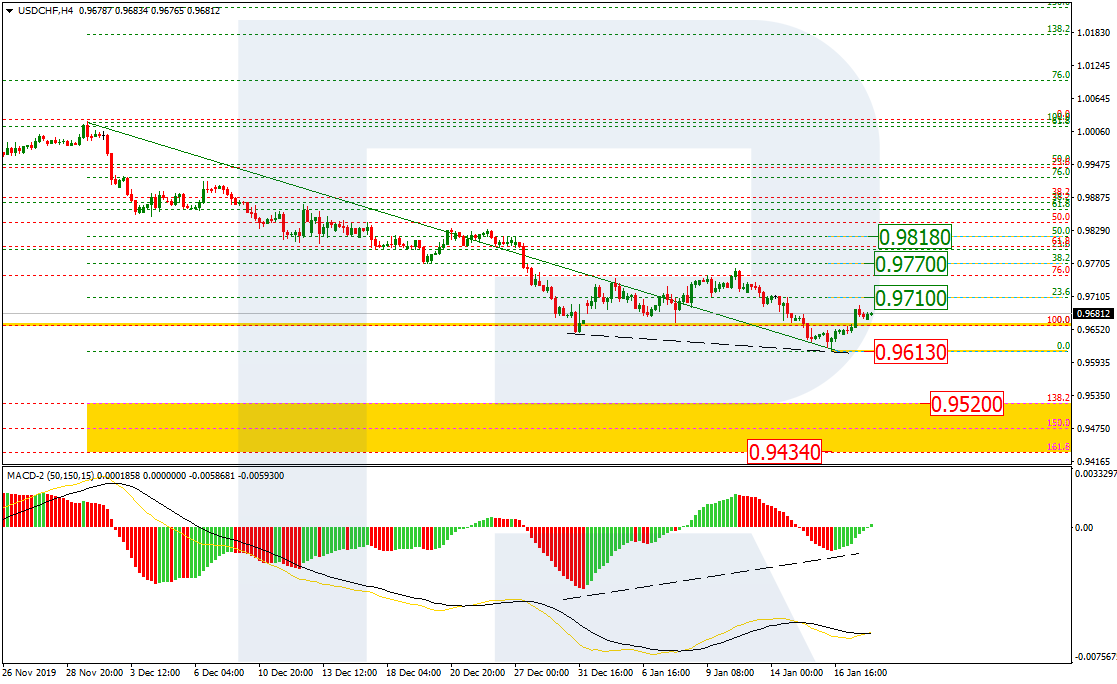
USDCHF, “US Dollar vs Swiss Franc”
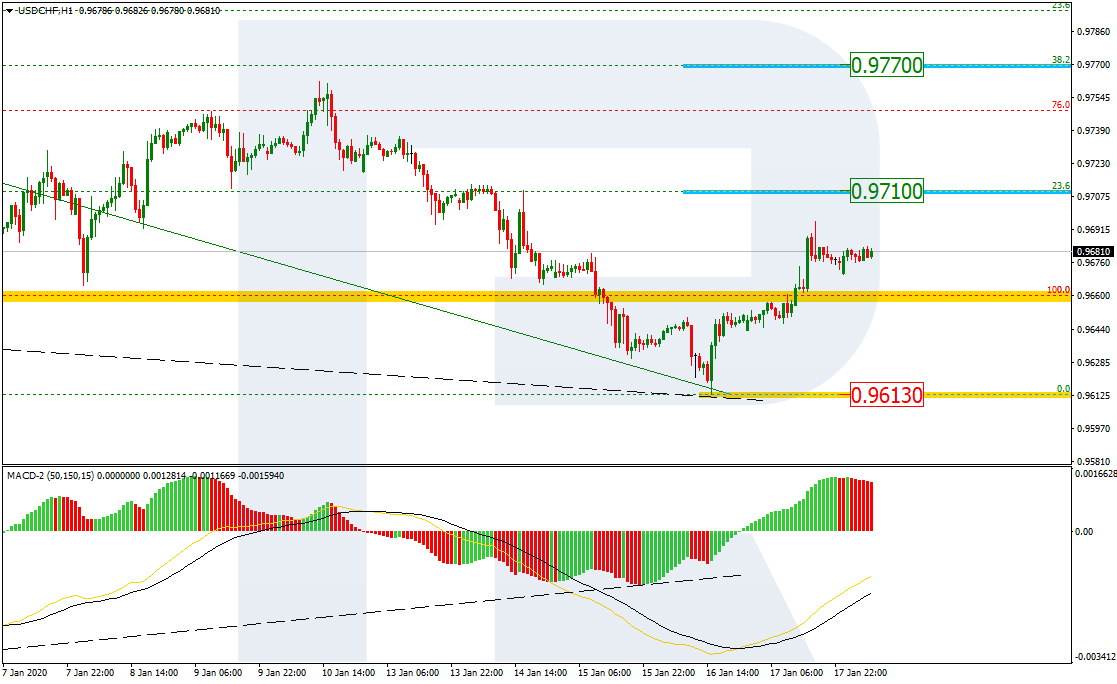
As we can see in the H4 chart, the pair is intending to continue trading downwards to reach the post-correctional extension area between 138.2 and 161.8% fibo at 0.9520 and 0.9433 respectively. However, considering the convergence on MACD and a slight growth, one can expect a new correctional uptrend. This scenario is valid as long as the instrument hasn’t broken the low at 0.9613.
In the H4 chart we can see that the instrument is moving towards 23.6% and 38.2% fibo at 0.9710 and 0.9770 respectively.
Attention! Forecasts presented in this section only reflect the author’s private opinion and should not be considered as guidance for trading. RoboForex LP bears no responsibility for trading results based on trading recommendations described in these analytical reviews.
The EUR/USD currency pair is dominated by bearish sentiment. Greenback is supported by a series of optimistic economic releases from the US, which was published last week. At the moment, the trading instrument is testing a key support level of 1.10900. Mark 1.11100 is already a “mirror” resistance. The technical picture signals a further decline in the EUR / USD currency pair. We recommend opening positions from key levels.
Today the news background is calm. US financial markets will be closed due to the holiday.
Indicators signal the strength of sellers: the price has fixed below 50 MA and 100 MA.
The MACD histogram is in the negative zone, but above the signal line, which gives a weak signal to sell EUR/USD.
The Stochastic Oscillator is in the neutral zone, the %K line is below the %D line, which indicates a bearish sentiment.
Trading recommendations
Support levels: 1.10900, 1.10500
Resistance levels: 1.11100, 1.11300, 1.11450
If the price consolidates below the level of 1.10900, expect a further drop toward 1.10600-1.10400.
Alternatively, the quotes could grow toward 1.11300-1.11400.
The GBP/USD currency pair
Technical indicators of the currency pair:
Prev Open: 1.30777
Open: 1.29928
% chg. over the last day: -0.64
Day’s range: 1.29705 – 1.30090
52 wk range: 1.1959 – 1.3516
GBP/USD quotes went down. Sterling set new local lows. Demand for the US dollar remains at a fairly high level. At the moment, the key support and resistance levels are 1.29600 and 1.30150, respectively. The GBP/USD currency pair has the potential for further decline. Investors expect up-to-date information on Brexit. Open positions from key levels.
The Economic News Feed for 20.01.2020 is calm.
The price fixed below 100 MA, which signals the strength of sellers.
The MACD histogram is in the negative zone and continues to decline, indicating a bearish mood.
The Stochastic Oscillator is near the oversold zone, the %K line crossed the %D line. There are no signals at the moment.
Trading recommendations
Support levels: 1.29600, 1.29200, 1.29000
Resistance levels: 1.30150, 1.30550, 1.31000
If the price consolidates below 1.29600, expect a further drop toward 1.29300-1.29100.
Alternatively, the quotes could grow toward 1.30400-1.30600.
The USD/CAD currency pair
Technical indicators of the currency pair:
Prev Open: 1.30415
Open: 1.30579
% chg. over the last day: +0.12
Day’s range: 1.30550 – 1.30710
52 wk range: 1.2949 – 1.3566
The USD/CAD currency pair continues to trade in a long flat. There are no defined trends. Participants in financial markets expect additional drivers. At the moment, the following local support and resistance levels can be distinguished: 1.30500 and 1.30750, respectively. A trading instrument has potential for growth. We recommend that you pay attention to the dynamics of prices of “black gold”. Open positions from key levels.
The Economic News Feed for 20.01.2020 is calm.
Indicators do not give accurate signals: 50 MA crossed 100 MA.
The MACD histogram has moved into the positive zone, indicating bullish sentiment.
The Stochastic Oscillator is in the neutral zone, the% K line is above the% D line, which gives a signal to buy USD / CAD.
Trading recommendations
Support levels: 1.30500, 1.30300, 1.30000
Resistance levels: 1.30750, 1.31000, 1.31300
If the price consolidates above 1.30750, USD/CAD quotes are expected to rise. The potential movement is to 1.31000-1.31200.
Alternatively, the quotes could descend toward 1.30300-1.30000.
The USD/JPY currency pair
Technical indicators of the currency pair:
Prev Open: 110.138
Open: 110.077
% chg. over the last day: -0.05
Day’s range: 110.077 – 110.216
52 wk range: 104.45 – 113.53
The USD/JPY currency pair has stabilized after continued growth. The trading instrument is currently consolidating. Local levels of support and resistance are: 110.000 and 110.300, respectively. In the near future, a technical correction is possible. We recommend that you keep track of current information regarding the second phase of the trade agreement between Washington and Beijing. Open positions from key levels.
The news background on the Japanese economy is calm.
Indicators do not give accurate signals: the price crossed 50 MA.
The MACD histogram is near the 0 mark.
The Stochastic Oscillator is in the neutral zone, the %K line crossed the %D line. There are no signals at the moment.
Trading recommendations
Support levels: 110.000, 109.800, 109.400
Resistance levels: 110.300, 110.600
If the price consolidates above 110.300, expect further grotwht toward 110.600-110.800.
Alternatively, the quotes could correct toward 109.600-109.400.
On Friday, the US currency strengthened against a basket of major currencies. The dollar index (#DX) closed yesterday in the green zone (+0.31%). Last week, the United States published a series of optimistic statistics on retail sales, real estate market and Philadelphia Fed manufacturing index. Demand for greenback is still high.
The British pound is declining due to weak economic statistics released on Friday. So, the volume of retail sales decreased by 0.6% in December, while investors forecasted growth by 0.5%. Also, the British are saddened by the news that Prince Harry and his wife Meghan decided to abandon the throne and all titles, choosing a more calm and ordinary life. The British believe that they paid taxes for nothing for so many years, which were spent to ensure the monarchs. Investors also expect up-to-date information on Brexit.
The “black gold” prices show a variety of trends. Currently, futures for the WTI crude oil are testing the $58.75 mark per barrel.
Market Indicators
On Friday, there was the bullish sentiment in the US stock market: #SPY (+0.31%), #DIA (+0.12%), #QQQ (+0.49%).
The 10-year US government bonds yield has risen slightly. At the moment, the indicator is at the level of 1.82-1.83%.
The Economic News Feed for 20.01.2020:
Today, the publication of important economic news is not expected. We recommend paying attention to the speech by the ECB President.
US financial markets are closed due to the holiday.
With the US bank holiday Martin Luther King Day (for modified Trading hours, please check our trading schedule), volatility in financial markets should be expected to stay low into the start of the week.
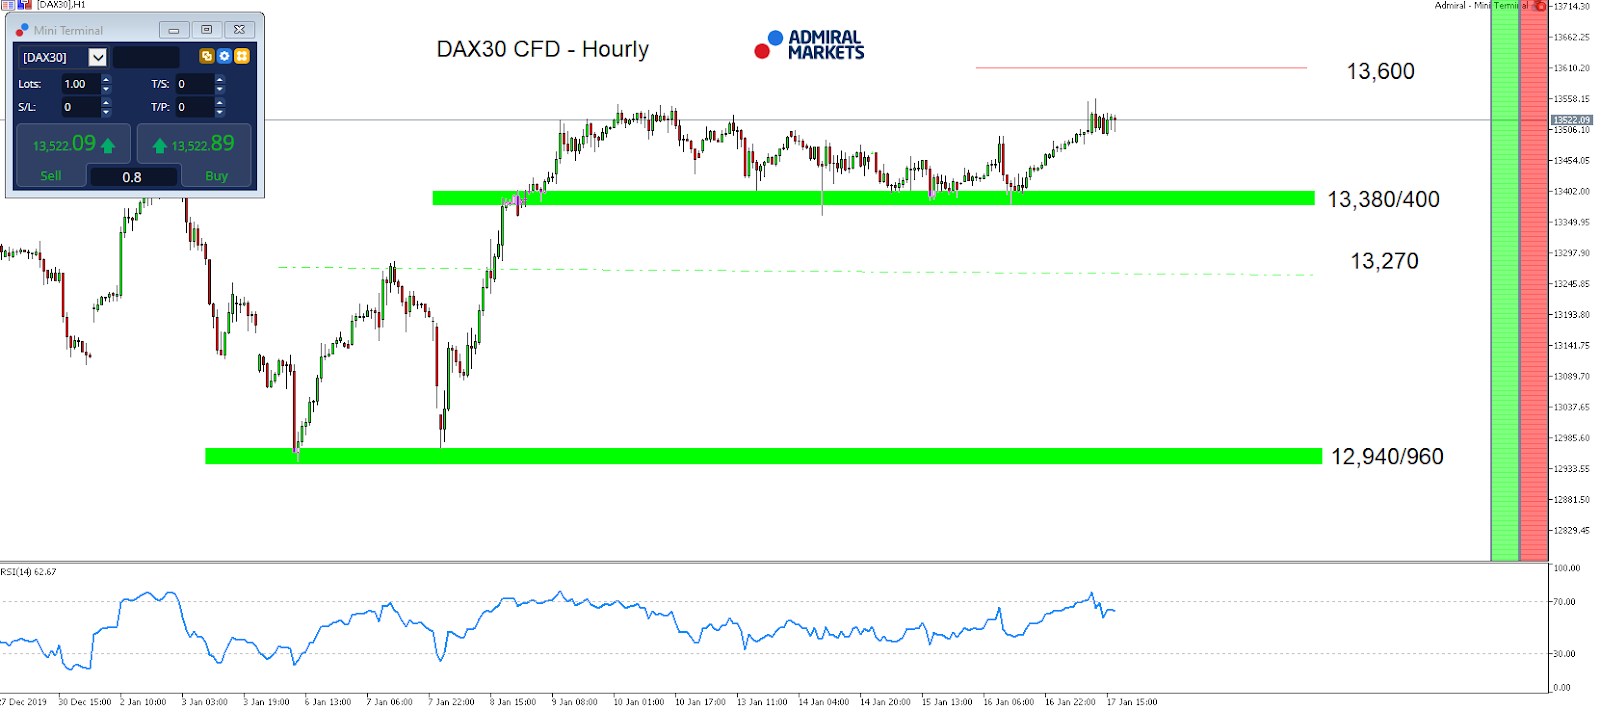
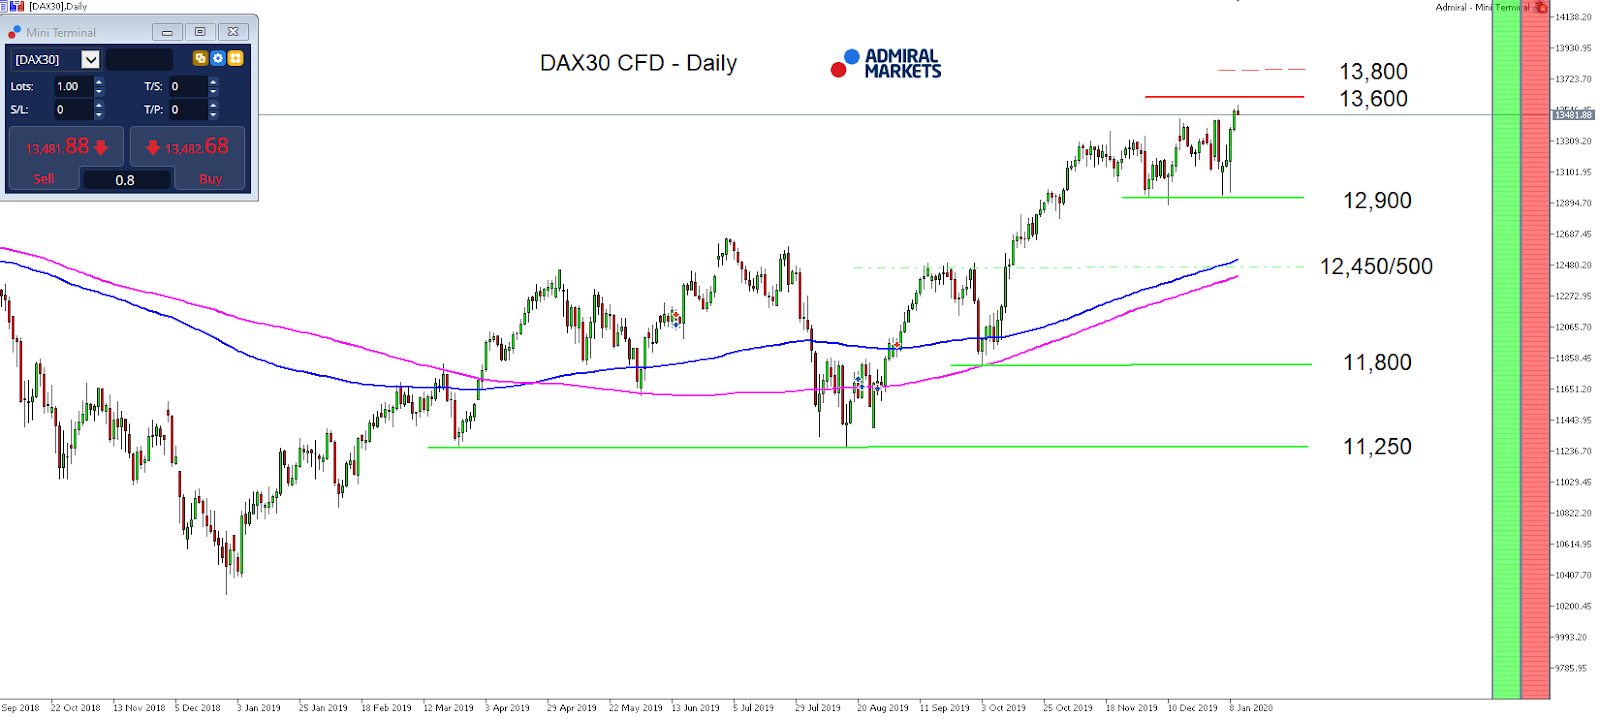
In general, low volatility favours a drift higher, resulting in an elevated chance to see a push higher and an attack of the current DAX30 CFD all time highs around 13,600 points.
Technically, the mode on H1 stays long in the DAX30 CFD as long as we trade above 13,380/400 points.
A break above 13,600 points finds a next potential target in the region around 13,800 points and above around the psychologically relevant region around 14,000 points.
However, if the bulls fail to substantially break above 13,600 points and in the days to come, we may see another attack at the region around 13,380/40 points with a break lower, a first target on the downside could be found around 13,250/270 points.
In general, volatility shouldn’t be expected to significantly increase with the ECB rate decision on Thursday, making this bearish outlook unlikely in our opinion:
Source: Admiral Markets MT5 with MT5SE Add-on DAX30 CFD Daily chart (between 27 December 2019 to 17 January 2020). Accessed: 17 January 2020 at 10:00 PM GMT
Source: Admiral Markets MT5 with MT5SE Add-on DAX30 CFD Daily chart (between 05 October 2018 to 17 January 2020). Accessed: 17 January 2020 at 10:00 PM GMT
Please note: Past performance is not a reliable indicator of future results, or future performance.
In 2015, the value of the DAX30 CFD increased by 9.56%, in 2016 it increased by 6.87%, in 2017 it increased by 12.51%, in 2018 it fell by 18.26%, in 2019 it increased by 26.44% meaning that after five years, it was up by 34.2%.
Disclaimer: The given data provides additional information regarding all analysis, estimates, prognosis, forecasts or other similar assessments or information (hereinafter “Analysis”) published on the website of Admiral Markets. Before making any investment decisions please pay close attention to the following:
This is a marketing communication. The analysis is published for informative purposes only and are in no way to be construed as investment advice or recommendation. It has not been prepared in accordance with legal requirements designed to promote the independence of investment research, and that it is not subject to any prohibition on dealing ahead of the dissemination of investment research.
Any investment decision is made by each client alone whereas Admiral Markets shall not be responsible for any loss or damage arising from any such decision, whether or not based on the Analysis.
Each of the Analysis is prepared by an independent analyst (Jens Klatt, Professional Trader and Analyst, hereinafter “Author”) based on the Author’s personal estimations.
To ensure that the interests of the clients would be protected and objectivity of the Analysis would not be damaged Admiral Markets has established relevant internal procedures for prevention and management of conflicts of interest.
Whilst every reasonable effort is taken to ensure that all sources of the Analysis are reliable and that all information is presented, as much as possible, in an understandable, timely, precise and complete manner, Admiral Markets does not guarantee the accuracy or completeness of any information contained within the Analysis. The presented figures refer that refer to any past performance is not a reliable indicator of future results.
The contents of the Analysis should not be construed as an express or implied promise, guarantee or implication by Admiral Markets that the client shall profit from the strategies therein or that losses in connection therewith may or shall be limited.
Any kind of previous or modeled performance of financial instruments indicated within the Publication should not be construed as an express or implied promise, guarantee or implication by Admiral Markets for any future performance. The value of the financial instrument may both increase and decrease and the preservation of the asset value is not guaranteed.
The projections included in the Analysis may be subject to additional fees, taxes or other charges, depending on the subject of the Publication. The price list applicable to the services provided by Admiral Markets is publicly available from the website of Admiral Markets.
Leveraged products (including contracts for difference) are speculative in nature and may result in losses or profit. Before you start trading, you should make sure that you understand all the risks.
On Friday, January 17, the euro was down at the close of trading. The euro followed in the footsteps on the GBP, which fell heavily against the US dollar after weak retail sales figures for December were published in the UK. The data increased the likelihood that the Bank of England would decide to lower the level of basic interest rates in the country at its next meeting. The EURUSD pair fell to 1.1086. By the end of the day, the euro had fallen 0.43%, and by 0.26% across the entire week.
The American session saw continued pressure on the euro, due to the upcoming long weekend in the US.
Today’s events (GMT+3):
14:00 Germany: German Buba Monthly Report.
21:30 Eurozone: ECB’s President Lagarde speech.
National holiday in USA.
Current situation:
Friday’s expectations for a decrease in the EURUSD pair were fully justified, with the fall In price ended at the 67th degree. On the hourly chart, a three-wave structure has formed from 1.1172. According to the AO indicator, there is no defined end to the downward movement, and bears may attempt to set a new minimum at the 1.1086 mark.
At the time of writing, the euro is worth 1.1099. The price is hovering around the trend line at 1.1172. Given that there is a national holiday in the US, and the Stochastic Operator is in the oversold zone, it is forecast to grow to 1.1106 with a subsequent drop to 1.1089.
Most major currencies are trading in the black, and the economic calendar is scarce. A spike in volatility may be caused by the head of the ECB Christine Lagarde, who is scheduled to speak at 21:30 Moscow time. According to the forecast, we considered a weak rebound, however there could be a sharp “double bottom” – it all depends on the bulls’ activity. Crosses with the euro are all up, with the exception of EURAUD. If Monday’s price stays above 1.1086 until Tuesday, then bulls will have the opportunity to restore the price to 1.1140.
China’s central bank left its new benchmark interest rate, the one-year Loan Prime Rate (LPR), steady at 4.15 percent for the second month in a row as expected after the rate on the medium-term lending facility (MLF) was maintained on Jan. 14.
The People’s Bank of China (PBOC) also kept the rate on the 5-year LPR, used to price mortgages, at 4.80 percent. After reforming its method for calculating LPR and designating it as its new benchmark rate for all loans on August 17, 2019, PBOC set it as 4.25 percent on Aug. 20, 6 basis points below the old LPR and 10 basis points below the previous benchmark lending rate.
LPR was then cut a further 5 basis points in September and November last year for a total effective easing of 20 points in the benchmark lending rate since August.
Under the revised method for calculating the benchmark lending rate, LPR is expressed as a spread to the rate on MLF, which last week was maintained at 3.25 percent.
By Dmitriy Gurkovskiy, Chief Analyst at RoboForex – The British Pound against the USD is starting another January week under pressure: the pair is trading below 1.3000.
The Pound’s major problem right now is the anticipation of the Brexit. Everything is ready and the United Kingdom may start the procedure of exiting the European Union at any moment before January 31st. however, London decided to wait for the exact date.
The statistics published last week showed that the Retail Sales in the United Kingdom lost 0.6% m/m in December after reducing by 0.8% in the previous month. Consumers can’t or don’t want to increase their expenses before the country starts the exiting procedure. It’s another signal that the country’s economy is looking pretty weak and the Bank of England may have to decide on helping it much earlier than the regulator planned based on its conservative approach.
This week, there will be some interesting numbers on the British labor market in November. Most likely, the Average Earnings Index hasn’t increased since November 2019 and that’s bad news for the Pound.
As we can see in the H4 chart, GBP/USD is moving downwards; it is forming the fifth wave with the target at 1.2885. Possibly, today the pair may consolidate around 1.3000. Later, the market may break this range to the downside and then continue falling to reach the above-mentioned target. After that, the instrument may form a new ascending structure towards 1.3100. From the technical point of view, this scenario is confirmed by MACD Oscillator: its signal line is moving downwards. After the line breaks 0, the price may boost its decline.
In the H1 chart, GBP/USD is forming another descending wave towards 1.2930. After reaching it, the instrument may start a new correction to return to 1.3000 and then resume trading downwards with the target at 1.2885. Later, the market may form one more structure to the upside to reach 1.3050. From the technical point of view, this scenario is confirmed by Stochastic Oscillator: its signal line is moving below 50, thus indicating a strong descending tendency.
Disclaimer
Any predictions contained herein are based on the authors’ particular opinion. This analysis shall not be treated as trading advice. RoboForex shall not be held liable for the results of the trades arising from relying upon trading recommendations and reviews contained herein.