by JustForex
The EUR/USD currency pair
- Prev Open: 1.10188
- Open: 1.10222
- % chg. over the last day: +0.02
- Day’s range: 1.10113 – 1.10276
- 52 wk range: 1.0879 – 1.1572
The EUR/USD currency pair is in sideways movement. There is no defined trend. At the moment local support and resistance levels are at 1.10000 and 1.10350, respectively. Today the Fed will announce its decision on the key interest rate. Financial markets participants expect the regulator to keep the main parameters of monetary policy at the same level. We recommend you to pay attention to comments and rhetoric of the Central Bank representatives. Open positions from key levels.
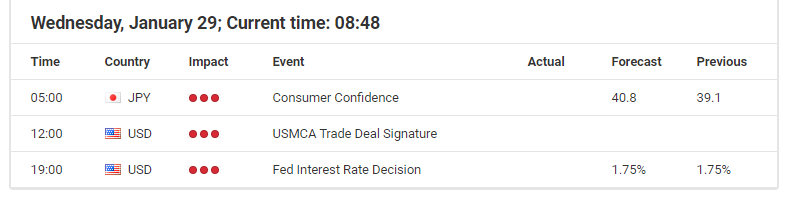
The Economic News Feed for 29.01.2020:
- – Unfinished sales index in the US real estate market – 17:00 (GMT+2:00);
- – US Federal Reserve interest rate decision – 21:00 (GMT+2:00).

Indicators do not give accurate signals: the price has crossed 50 MA.
MACD histogram is near the 0 mark.
The stochastic oscillator is located in the oversold area, the %K line has crossed the %D line. No signals at the moment.
- Support levels: 1.10000, 1.09700
- Resistance levels: 1.10350, 1.10600, 1.10750
If the price fixes below 1.10000, expect a further decline toward 1.09700-1.09400.
Alternatively, the quotes could recover toward 1.10700-1.10900.
The GBP/USD currency pair
- Prev Open: 1.30588
- Open: 1.30271
- % chg. over the last day: -0.24
- Day’s range: 1.30152 – 1.30287
- 52 wk range: 1.1959 – 1.3516
The technical picture on the GBP/USD currency pair is ambiguous. At the moment the sterling is consolidating. Local support and resistance levels are acting: 1.30000 and 1.30350, respectively. Investors are waiting for additional drivers. Today the key event will be the Fed meeting. We recommend opening positions from key levels.
The Economic News Feed for 29.01.2020 is calm.

The price is fixed below 50 MA and 100 MA, which signals the strength of the sellers.
The MACD histogram is in the negative zone, but above the signal line, which gives a weak signal to sell GBP/USD.
The Stochastic Oscillator is in the neutral zone, the %K line is above the %D line, which indicates a bullish mood.
- Support levels: 1.30000, 1.29650
- Resistance levels: 1.30350, 1.30650, 1.31000
If the price fixes below 1.30000, GBP/USD quotes are expected to fall further toward 1.29650-1.29400.
Alternatively, the quotes could grow toward 1.30700-1.31000.
The USD/CAD currency pair
- Prev Open: 1.31939
- Open: 1.31550
- % chg. over the last day: -0.24
- Day’s range: 1.31537 – 1.31653
- 52 wk range: 1.2949 – 1.3566
Yesterday USD/CAD quotes retreated from local highs. Currently, the CAD is consolidating in the range of 1.31450-1.31750. The trading instrument has potential for further correction after the prolonged rally. Today, investors’ attention is focused on the Fed meeting. Additional support for the Canadian dollar is provided by the oil quotes recovery. Positions should be opened from key levels.
The Economic News Feed for 29.01.2020 is calm.

Indicators do not give accurate signals: the price has crossed 50 MA and 100 MA.
MACD has crossed into the negative zone, which indicates the development of bearish sentiments.
The Stochastic Oscillator is located in the neutral zone, the %K line is above the %D line, which gives a signal to buy USD/CAD.
- Support levels: 1.31450, 1.31200, 1.30900.
- Resistance levels: 1.31750, 1.32000, 1.32300.
If the price fixes below 1.31450, expect further correction toward 1.31000-1.30800.
Alternatively, the quotes could grow toward 1.32000-1.32300.
The USD/JPY currency pair
- Prev Open: 108.889
- Open: 109.120
- % chg. over the last day: +0.23
- Day’s range: 109.035 – 109.263
- 52 wk range: 104.45 – 113.53
USD/JPY currency pair is in a flat. The technical pattern is ambiguous. At the moment the local support and resistance levels can be distinguished at 108.900 and 109.250. In the nearest future, a correction of USD/JPY quotes after a prolonged decline is not excluded. We expect the Fed to decide on the key interest rate. We also recommend you to pay attention to the US government bond yield dynamics. Open positions from key levels.
The Economic News Feed for 29.01.2020 is calm.

Indicators do not give accurate signals: the price has crossed 50 MA and 100 MA.
The MACD histogram is in the positive zone but below the signal line, which gives a weak signal to buy USD/JPY.
The Stochastic Oscillator is in the neutral zone, the %K line is below the %D line, which indicates a bearish mood.
- Support levels: 108.900, 108.750, 108.400
- Resistance levels: 109.250, 109.650, 109.800
If the price fixes above 109.250, expect the quotes to correct toward 109.500-109.750.
Alternatively, the quotes could fall toward 108.700-108.400.
by JustForex